Secondary Muon Asymmetries at Sea Level with Low Systematics
Abstract
Project GRAND has the capability of measuring the angle and identity of single tracks of secondary muons at ground level. The array is comprised of 64 stations each containing eight proportional wire planes with a 50 mm steel absorber plate placed above the bottom two planes in each station. The added steel absorber plate allows muon tracks to be separated from the less massive electrons. Over 100 billion identified muon angles have been measured. With the high statistics available, it is possible to obtain muon angular asymmetries with low systematics by subtracting west from east (and separately, south from north) angles; the subtraction eliminates most of the systematic errors while still retaining adequately small statistical errors on the differences. A preliminary analysis is performed as a function of solar time to obtain the effects on the muon rate due to effects of the sun.
1 Introduction
Cosmic rays are highly isotropic, yet small anisotropies do exist because of various effects such as the east-west asymmetry due to the magnetic field of the earth bending the predominately positively charged cosmic rays toward the east. This effect has been observed some time ago; it is a constant effect depending upon the magnetic latitude of the detector and is independent of the time of day. The value of this asymmetry is sensitive to the primary energy spectra and physical effects (such as, for example, the cosmic ray trajectory’s deflection in the sun’s or Earth’s magnetic field) which depend on the low energy cut-off of the experiment.
2 The Compton-Getting Effect
Another predicted asymmetry effect is that due to the Compton Getting Effect (CGE, see [Compton and Getting (1935)] and [Cutler and Groom (1991)]) which describes a source of anisotropy due to the velocity of the detector relative to the frame in which the cosmic rays were created isotropically. The magnitude of the effect is given by:
| (1) |
where is the fractional asymmetry, the quantity in square brackets is with F the counting rate along the direction of the velocity and A the average rate, is the velocity of the detector relative to the rest frame of the cosmic rays, is the cosmic ray direction relative to , cos is the projection of the cosmic ray along the forward direction of , and is the differential cosmic ray spectral index describing the energy spectrum of the primary cosmic ray.
Using values of 30 km/sec for (the orbital speed of the Earth about the sun) and 2.7 for the spectral index, Equation 1 gives a CGE maximum amplitude of 0.47. The orbital speed of the Earth around the sun is used rather than the 220 km/sec velocity of the sun in the Galaxy since the data will be analyzed in a sun-centered frame and the larger effect of the Galactic speed will cancel out as the data are averaged over an integer number of solar years (assuming uniform data accumulation over this time).
The asymmetry due to the Compton Getting effect using the orbital speed of the Earth around the sun will not be constant but depends upon the time of day relative to local noon (when the sun is due south of the experiment, which for GRAND is, on average, 12:45 EST). It is expected that the CGE asymmetry in E-W will be a positive maximum at midnight and negative maximum at noon (with a slight perturbation due to the Earth’s rotational speed, which at GRAND is 0.35 km/sec, about two orders smaller in magnitude than the Earth’s speed of revolution about the sun). We study the east-west asymmetry (as well, the north-south) as a function of the solar time of day and subtract this CGE in order to measure any residual asymmetry due to other physical phenomena.
3 Experimental Array
Project GRAND is an array of 64 proportional wire stations. Each station is composed of four pairs of orthogonal planes. Each plane contains 80 detection wires; the planes are accurately aligned with the north/south or east/west directions. There is a steel plate above the bottom pair of planes; electrons scatter, stop, or shower because of the steel absorber plate but the higher mass muons are relatively unaffected. Because an electron will be misidentified as a muon approximately 4% of the time and a muon will be misidentified as an electron also 4% of the time, this arrangement allows Project GRAND to differentiate muon tracks with 96% accuracy while retaining 96% of them. Given the 80 channels of proportional wires in a plane and the vertical separation between the planes, Project GRAND is able to measure the direction of a muon track to 0.26∘, on average, in each of two orthogonal planes. This geometrical arrangement of planes has a sensitivity cutoff-angle of from vertical. The muon threshold energy is 0.1 GeV for vertical tracks, increasing as 1/cos() for inclined from vertical.
Muons are identified and recorded at a rate of 2000 Hz. Since January of 1998 through December of 2000, over 95 billion muon tracks have been identified.
Project GRAND measures the direction and identity of secondary muon tracks. In obtaining this east-west asymmetry by subtracting the west numbers from the east numbers (E-W), most systematic errors are eliminated. This E-W asymmetry is measured as well as a similar difference between muons originating from the south subtracted from the northern hemisphere (N-S). In taking these differences between the two hemispheres, angles of degrees from zenith have been deleted. These differences are then normalized to the sum. The high statistics available allows small differences to be seen with moderate error bars.
4 Acceptance
Since Project GRAND is not sensitive to the whole sky (its cutoff angle is 63∘ from zenith) and, like other ground-based detectors, it is more sensitive to cosmic rays coming from near its zenith, the appropriate data-average of cos must be obtained to use in Equation 1 in order to calculate the expected magnitude of the asymmetry in GRAND’s data due to the CGE.
The acceptance for Project GRAND, , is given by:
| (2) |
The angle is the muon’s angle from the vertical or zenith direction, is the projection of upon the xz-plane and is the yz-projection. It combines a geometrical factor, , a cos factor describing the projection of the muons unto the zenith direction, and a factor, , which describes the muon absorption in the Earth’s atmosphere due to the increased path length in air for muons inclined from the vertical direction.
The geometrical factor in Equation 1 arises from the arrangement of several horizontal proportional wire planes placed above each other in order to measure the angle of the muon from the vertical direction. Since it is required for the muon to traverse both the top and bottom planes, as the muon’s angle is inclined from zenith there is less area available in the planes for both planes to detect the muon. These geometrical factors are the two [1 - 0.537tan] terms in Equation 2. The limiting projected angle is when a particle strikes the first wire of the top plane and the last wire of the bottom plane; this projected angle is from zenith. Any track of greater projected angle is not able to simultaneously intercept the top and bottom planes so will not be detected by this arrangement of proportional wire planes. The 0.537 in Equation 1 is the ratio between the horizontal width of the detector planes and the vertical spacing between the top and bottom planes of a detector station.
The combined acceptance function is then folded with the term in Equation 1 to find a data-averaged value for to use in order to find the expected experimental asymmetry due to the CGE due to the orbital velocity of the Earth about the sun. Multiplying the CGE amplitude of 0.47 times the data-averaged cos (0.139) yields as the predicted Compton Getting effect which contributes to the east-west asymmetry as measured by Project GRAND; any residual asymmetry would then be due to other physical effects.
5 Data Analysis
From January 1998 through December 2000, 673 data files have been created containing information on muon tracks. These files have information on the local solar time, and direction of origin of the track. From these data files only those files containing 24 (or 48) continuous hours of data were selected. A smoothness test was applied to the data of each day to reduce the amount of error caused by possible temporary failures of a detector station or stoppages of the experiment. These have the potential to produce structure in the subsequent analyses which would have nothing to do with the physics under study.
The data for each 24 hour period was divided into 48 half hour segments. Any 24 hour period where the standard deviation of the half hours was greater than 5% of the average for that day was not used in the analysis. This left 304 days of data after this smoothness cut containing a total of 50 billion muon tracks for the subsequent analysis described below. This cut is perhaps a little severe but helps insure that a possible residual asymmetry in a single day will not produce a noticeable effect in the sum over all the days; any remaining asymmetry should then be due to a physical effect other than the CGE.
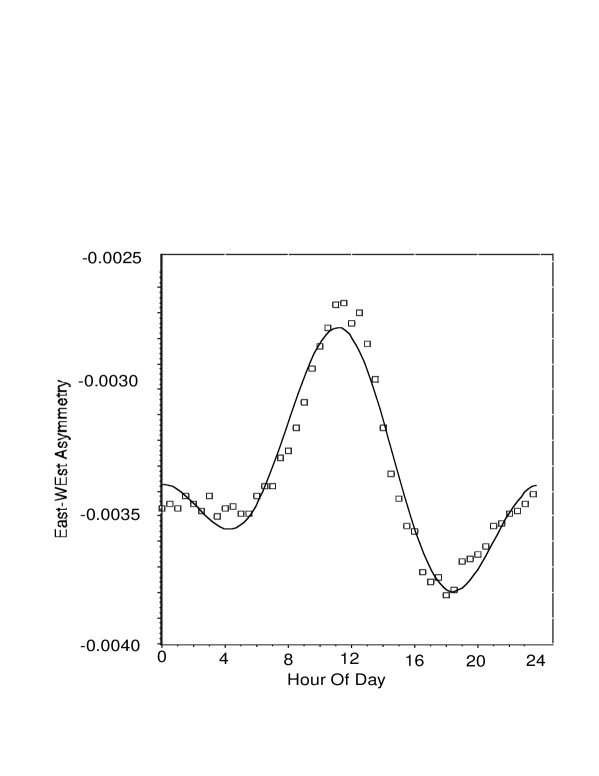
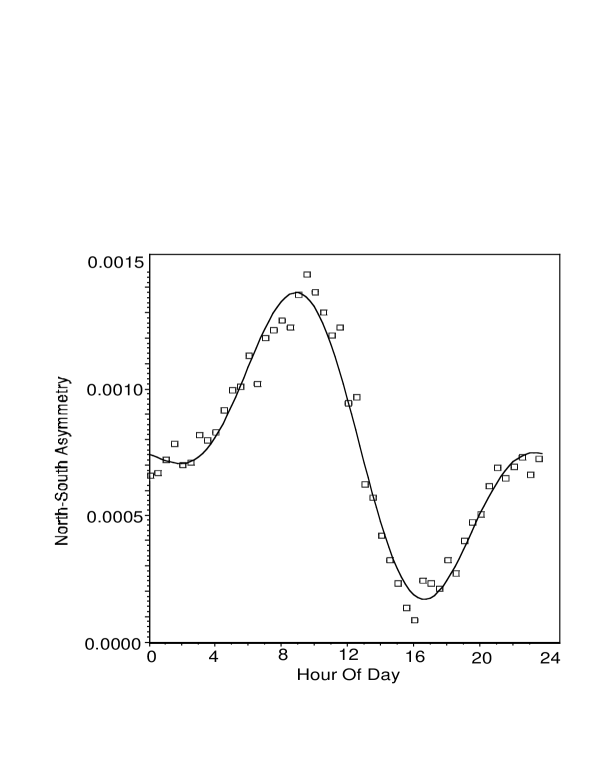
Since Project GRAND can determine the direction of incident muons, it was possible to separate muons from the eastern hemisphere from those of the western and an east-west (E-W) difference obtained. Also, muons from the southern hemisphere were subtracted from those from the northern hemisphere. These E-W and N-S differences were obtained for each half-hour interval of data to obtain the corresponding asymmetry for that time period. These asymmetry numbers for each half hour of the solar day were summed; these sums were then normalized by dividing by the total number of muons accumulated during that half hour of the day. The asymmetries were then plotted versus each half hour of the day in Eastern Standard Time (EST). The results are shown in Figures 1 and 2.
6 Fits
Figure 1 displays the east-west asymmetry and Figure 2 the north-south. Equation 3 describes a curve with once- and twice-a-day variations which is fit to the data by finding the parameters which give a least-square error.
| (3) |
The factor of 15 in the cosine function converts from hours to degrees in the once-a-day term. The factor of 30 in the second cosine function is twice as large; the additional factor of two gives the twice-per-day variation. , , and are hours in EST. The magnitude of is the average variation, and are parameters which describe the magnitude of the variations relative to the average, while and describe the locations of the peaks of these two variations in hour-of-day in EST. The values for these parameters are shown in Table 1. For east-west, the twice-a-day variation is 82% of the once-a-day variation. However, for north-south asymmetry, the twice-a-day variation is 61% of the once-a-day value. The twice-a-day variation has the same strength for both the E-W and N-S asymmetries; the N-S once-a-day variation is 30% larger than the E-W.
Fitting the E-W asymmetry data to Equation 3 yields the fitted parameters in Table 1. The errors shown assume no correlations and are, therefore, underestimates for those errors which are correlated. The largest asymmetry parameter is “A” for the E-W subtracted data of . This is due to the magnetic field of the Earth and the positive charge of the primary cosmic ray spectrum. The non-constant asymmetry is the most negative at 18.1 hours and least negative at 11.2 hours with the value fluctuating between and , respectively; the difference of these two extremes is . The curve generated from fitting the N-S data to Equation 3 has an average value of . The North-South asymmetry is the greatest at 8.9 hours and least at 16.7 hours yielding asymmetry values of and , respectively; the difference of these two extremes is , a larger difference than in the E-W case.
The CGE effect predicts an east-west asymmetry value (the once-a-day B parameter) of for the Project GRAND detectors. The remaining (now larger) asymmetry of is therefore be due to physics other than the CGE. One such possibility is the effect of the sun’s interplanetary magnetic field deflecting the cosmic rays on their way toward the Earth. The CGE predicts no asymmetry for the north-south direction, so the measured valule is due to other physical phenomena.
| Parameter | E - W | N - S |
|---|---|---|
| A | -0.00335 0.00001 | 0.00075 0.00001 |
| B | 0.00033 0.00002 | 0.00044 0.00002 |
| D | 0.00028 0.00002 | 0.00026 0.00002 |
| C | 10.0 0.2h | 7.0 0.1h |
| E | 11.5 0.1h | 9.7 0.1 h |
7 acknowledgemens
Project GRAND is funded through the University of Notre Dame and private donations.
References
- [Astonomical Almanac (1999)] Larson, D. and Holdway, R. ed., 2000 Astronomical Almanac. U.S. Government Printing Office, Washington D.C., 1999.
- [Compton and Getting (1935)] Compton, A.H. and Getting, I.A., Phys Rev 47, 817, 1935.
- [Cutler and Groom (1991)] Cutler, D.J. and Groom, D.E., ApJ 376, 322, 1991.
- [Lin et al. (1999)] Lin, T. F., Fields, B., Gress, J., and Poirier, J., Proceedings of the 26th International Cosmic Ray Conference (ICRC), Vol. 4, p. 100, 1999; World Wide Web: http://www.nd.edu/grand.