Detection of Infall Signatures Towards Serpens SMM4
Abstract
We present the detection of kinematic infall signatures towards the Class 0 protostellar system SMM4 in the Serpens cloud core. We have observed the dense molecular gas towards the embedded source using millimeter and submillimeter line transitions of density sensitive molecular tracers. High signal-to-noise ratio maps obtained in HCO+ J=10, J=32 and J=43, and CS J=21 show the blue-bulge infall signature. The blue-bulge infall signature can be observed in the centroid velocity maps of protostellar objects when infall dominates over rotation. The line profiles of HCO+ and CS exhibit the characteristic blue asymmetric line profile signature consistent with infall. In addition, HCO+ and CS optical depth profiles obtained using isotopic observations show a red asymmetry also consistent with an infall interpretation. Using three-dimensional radiative transfer models based on the rotating, collapse model of Terebey, Shu and Cassen, we derive infall parameters of the source. To determine the direction and orientation of molecular outflows in the larger Serpens cluster, wide-field mapping of CO J=10 emission was also performed.
1 Introduction
The study of star formation is currently at a fascinating stage. With the advent of large millimeter and submillimeter single-dish telescopes, and interferometers, the earliest stages of star formation have been under considerable observational scrutiny. The youngest protostars, also known as Class 0 sources (of age a few yrs), are so completely embedded in their dust and gas cocoons that they are only detectable longward of mid-infrared wavelengths (Andrè, Ward-Thompson, & Barsony, 1993; Barsony, 1994). A typical Class 0 protostar consists of a central accreting source (that may be surrounded by a dynamic accretion disk), an extended, massive, rotating infall envelope, and a vigorous bipolar molecular outflow.
While collapse is one of the most important stages of star formation, direct observation of protostellar collapse is rendered difficult due to the kinematic confusion in star forming regions. Millimeter and submillimeter line profiles are not just affected by collapse motions. They are also affected by motions such as rotation, outflow and turbulence that are characteristic of the earliest stages of star formation. Much effort has been invested in finding a distinctive signature of infall. The most used infall signature is the blue asymmetric line profile that is seen in optically thick molecular transitions in the presence of a centrally peaked excitation temperature gradient (Walker et al., 1986; Zhou, 1992, 1995). A mapping signature based on centroid velocity maps (dubbed the “blue-bulge” signature of infall) was proposed and subsequently detected towards several Class 0 sources (Walker, Narayanan, & Boss, 1994; Narayanan, 1997; Narayanan and Walker, 1998; Narayanan, Walker, & Buckley, 1998). As long as the emission remains optically thick, the blue-bulge signature is found to be relatively insensitive to both variations in molecular abundance and source inclination (Narayanan and Walker, 1998). The blue-bulge signature naturally accounts for infall and rotation, and since it occurs along the equatorial direction of the protostar, is expected to be less affected by outflow.
The Serpens star-forming core, at a distance of 310 pc, is known to harbor about a half-dozen Class 0 protostellar candidates (Casali, Eiroa, & Duncan, 1993; White, Casali, & Eiroa, 1995; Hurt & Barsony, 1996; Testi & Sargent, 1998). As part of a study of the kinematics and evolutionary state of a larger set of YSOs (Narayanan et al., 2001), we performed a multi-transitional study of all the Class 0 objects in the Serpens core. In this paper, we concentrate on SMM4, which is the brightest submillimeter continuum object in the southeastern section of the Serpens core (Casali et al, 1993), and has the strongest overall H2CO emission of all observed sources in Serpens(Hurt & Barsony, 1996). We mapped the CS J=21 transition, and three different transitions of HCO+ emission at four different angular resolutions to constrain the infall parameters of this source. We also mapped a 20′ 10′ region around SMM4 in CO J=10 to determine the orientation and effect of outflows. In addition, we constrained the infall parameters of SMM4 using three-dimensional collapse models based on the (Terebey, Shu, & Cassen, 1984, hereafter TSC) solutions for protostellar collapse. In §2 we describe our observations, and in §3 we present our results.
2 Observations
A summary of all the observations obtained is shown in Table 1.
2.1 FCRAO Observations
Observations at the Five College Radio Astronomy Observatory111FCRAO is supported in part by the National Science Foundation under grant AST 97-25951. (FCRAO) 14 m telescope were performed in December, 1998 using the SEQUOIA 16-beam array receiver (Erickson, Grosslein, & Erickson, 1999), and the FAAS backend consisting of 16 autocorrelation spectrometers. The effective resolution obtained with each transition is summarized in Table 1. The HCO+, CS and their isotopic counterpart transitions were observed using the frequency-switched mode and, after folding, third order baselines were subtracted. 12CO and its rarer isotopes were observed using position-switched mode, and first order baselines were removed. Pointing and focus were checked every few hours on nearby SiO maser sources. A 6′ 6′ region centered on SMM4 ( (1950) = , (1950) = 1°11′10″) was mapped with half-beam sampling in all transitions. In the CO J=10 transition, a larger region (20′ 12′) was mapped at full beam sampling.
| Telescope | Transition | Frequency | Velocity Res. | Beam Size |
|---|---|---|---|---|
| (GHz) | (kms-1) | (″) | ||
| FCRAO | H13CO+ J=10 | 86.754330 | 0.067 | 62 |
| FCRAO | HCO+ J=10 | 89.188523 | 0.066 | 60 |
| FCRAO | C34S J=21 | 96.412940 | 0.061 | 56 |
| FCRAO | C32S J=21 | 97.980950 | 0.060 | 55 |
| FCRAO | 13CO J=10 | 110.201354 | 0.053 | 49 |
| FCRAO | CO J=10 | 115.271202 | 0.203 | 47 |
| JCMT | H13CO+ J=32 | 260.255478 | 0.090 | 19 |
| JCMT | HCO+ J=32 | 267.557619 | 0.088 | 19 |
| HHT | H13CO+ J=32 | 260.255478 | 0.288 | 29 |
| HHT | HCO+ J=32 | 267.557619 | 0.288 | 28 |
| HHT | 13CO J=32 | 330.587960 | 0.227 | 23 |
| HHT | CO J=32 | 345.795999 | 0.217 | 22 |
| HHT | H13CO+ J=43 | 346.998540 | 0.210 | 22 |
| HHT | HCO+ J=43 | 356.734256 | 0.210 | 21 |
2.2 HHT Observations
HCO+ and H13CO+ J=43 and CO J=32 observations were conducted in January 1998 with the 10 m Heinrich Hertz Telescope (HHT)222The HHT is operated by the Submillimeter Telescope Observatory (SMTO), and is a joint facility for the University of Arizona’s Steward Observatory and the Max-Planck-Institüt fur Radioastronomie (Bonn).. The facility dual polarization 345 GHz SIS receiver system was used as the frontend. The J=32 transitions of HCO+ and H13CO+ were observed in June 1998 with the facility 230 GHz SIS receiver. For both sets of observations, several backend spectrometers were used simultaneously. The available spectrometers at the HHT were two 1 GHz wide ( 1 MHz resolution) acousto-optic spectrometers (AOSs), one 250 MHz wide ( 400 kHz resolution) AOS, and three filterbank spectrometers (with resolutions of 1 MHz, 250 kHz and 62.5 respectively). The results presented in this paper are only from the 250 kHz filterbank spectrometer. All observations were conducted using position-switching. The HCO+ and CO transitions were mapped in a 1′ 1′ region centered on SMM4 with a grid spacing of 10″. Single spectra were obtained towards SMM4 with the H13CO+ transitions.
2.3 JCMT Observations
HCO+ J=32 observations were also carried out at the James Clerk Maxwell Telescope (JCMT)333The James Clerk Maxwell Telescope is operated by the Royal Observatories on behalf of the United Kingdom Particle Physics and Astronomy Research Council, the Netherlands Organization for Scientific Research and the Canadian National Research Council. in August 1998. A 1′ 1′ map was made towards SMM4, with a grid spacing of 10″. The mapping was performed using the on-the-fly mapping capability at the JCMT. Position switched observations were also made in the H13CO+ J=32 transition towards the central position of SMM4. The JCMT observations were done using the facility A3i single channel SIS receiver. The spectrometer backend used was the Dutch Autocorrelation Spectrometer (DAS) configured to operate with an effective resolution of 95 kHz and total bandwidth of 125 MHz.
3 Analysis
3.1 Line Profiles
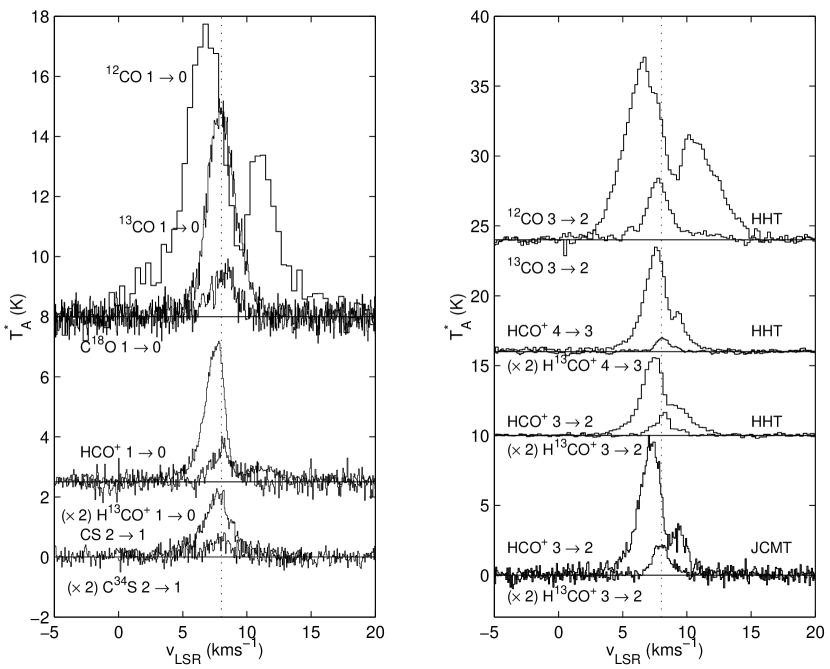
In Figure 1 we present a plot of our spectral observations towards the central position of SMM4. The left panel shows the millimeter lines and the right panel shows the submillimeter lines. In Table 2, we list the centroid velocities with uncertainties of the transitions shown in Figure 1. The centroid velocities were computed over a velocity interval that corresponded to the linewidth of the optically thin isotope. Also listed in the table are the beamwidths of the observations repeated from Table 1.
Several trends can be observed in the HCO+ and CS spectra towards the central position that suggest that infall is occurring towards SMM4. The noteworthy feature of most of the HCO+ and CS lines (the main isotope) in Figure 1 is that they show the classic blue asymmetric line profile, the signature expected for infall. The millimeter transitions of CS and HCO+ do not show identifiable double-peaked line profiles. The self-absorption dip in the HCO+ J=10 line may actually be down at the continuum level (there is some emission redward of this dip; see Figure1). While the CS J=21 line profile does not show a clear blue asymmetry, its centroid velocity is clearly blueshifted (see Table 2). In contrast, the optically thin isotopic spectra (the H13CO+ and C34S transitions) appear more gaussian and centered on the vLSR of the object, again as expected in an infall interpretation (Narayanan et al., 1998; Narayanan and Walker, 1998).
In all cases, for molecular tracers that probe the infalling material, the centroid velocity of the corresponding main, more optically thick isotope would be expected to be lower (bluer) than its rarer, more optically thin counterpart. Indeed that is the pattern seen for corresponding isotopic pairs for HCO+ and CS in Table 2. It would also be expected that higher lying submillimeter transitions show a more pronounced blue asymmetric line profile, since they would preferentially probe regions of greater density and hence larger infall velocities. Indeed, the HHT HCO+ J=43 transition shows a more pronounced blue asymmetry than the HHT HCO+ J=32 transition. However, the JCMT HCO+ J=32 transition has a bluer centroid velocity than the HHT HCO+ J=43 transition (see Table 2). This is probably because the JCMT J=32 observation has a higher angular resolution than the HHT J=43 observation. At higher angular resolution, the same transition would probe more embedded regions of higher infall velocity, and hence would be expected to have more pronounced blue asymmetry. Indeed that is the case seen towards the higher resolution JCMT HHT HCO+ J=32 spectrum as compared with the corresponding HHT spectrum. The corresponding centroid velocity for the JCMT observed J=32 transition is also lower (or bluer) compared to the HHT observed transition (see Table 2). As expected for an infall interpretation, the FCRAO millimeter wavelength CS and HCO+ line profiles, on account of their lower angular resolution and lower critical densities appear to show a less pronounced blue asymmetry compared to the submillimeter transitions. The FCRAO CO J=10 and the HHT CO J=32 transitions also show blue asymmetric line profiles. Their respective isotopic transitions are more gaussian in appearance and centered about the vLSR of the source. Low-lying CO transitions, because of their lower critical density are not expected to be as good tracers of infall as HCO+ or CS. In addition, CO is usually seen to trace outflows in protostellar objects. Indeed, in SMM4, as we will show below, the 12CO transitions do trace outflow in this system. Table 2 shows that for the submillimeter transition of CO, the main isotope has a redder centroid velocity that the corresponding rarer isotope. This would be consistent with CO J=32 tracing the underlying outflow.
| Telescope | Transition | vC | Beam Size | |
|---|---|---|---|---|
| (kms-1) | (kms-1) | (″) | ||
| FCRAO | H13CO+ J=10 | 8.17 | 0.05 | 62 |
| FCRAO | HCO+ J=10 | 7.66 | 0.09 | 60 |
| FCRAO | C34S J=21 | 7.97 | 0.01 | 56 |
| FCRAO | C32S J=21 | 7.62 | 0.01 | 55 |
| FCRAO | 13CO J=10 | 8.02 | 0.01 | 49 |
| FCRAO | CO J=10 | 7.77 | 0.12 | 47 |
| JCMT | H13CO+ J=32 | 7.97 | 0.01 | 19 |
| JCMT | HCO+ J=32 | 7.43 | 0.05 | 19 |
| HHT | H13CO+ J=32 | 8.04 | 0.01 | 29 |
| HHT | HCO+ J=32 | 7.63 | 0.01 | 28 |
| HHT | 13CO J=32 | 7.90 | 0.10 | 23 |
| HHT | CO J=32 | 8.06 | 0.02 | 22 |
| HHT | H13CO+ J=43 | 8.11 | 0.02 | 22 |
| HHT | HCO+ J=43 | 7.54 | 0.05 | 21 |
3.2 Optical Depth Profiles
In the presence of infall, isotopic line emission would always be expected to be redshifted with respect to the main line (Narayanan et al., 1998). In the presence of infall alone, both the emergent line intensity and the emergent optical depth profile must be asymmetric; the line intensity would be greater at blueshifted velocities, and correspondingly, the line optical depth would be greater at redshifted velocities. Indeed, the red asymmetry in the optical depth profiles of HCO+ J=43 emission derived from main and isotopic observations were used to bolster the case for infall in the IRAS 16293-2422 Class 0 system (Narayanan et al., 1998). In the presence of pure expansion (outflow), the converse would be true: the line profile would be red asymmetric, and the optical depth profile would be blue asymmetric. The recently proposed quantitative indicator of infall, which is the difference in the velocity of peak emission between main and isotopic lines, normalized by the FWHM of the isotopic line (Mardones et al, 1997), is based on this effect; would be more negative for regions with stronger infall velocity fields.
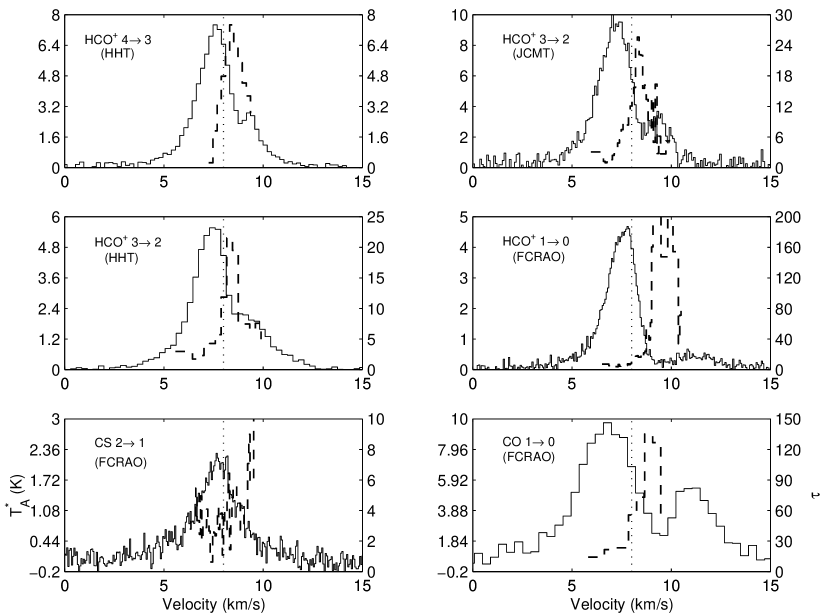
To determine the nature of the optical depth profiles, we performed an optical depth analysis of the observed HCO+, CS and CO lines. Figure 2 shows the resultant optical depth profiles towards the central position of SMM4. The optical depth calculations were performed only over the FWHM of the isotopic line. The opacities were estimated from the observed line profile ratios of HCO+/H13CO+, CS/C34S, and CO/C180. The opacity, of the more abundant isotope was estimated using , where is the ratio of main to isotopic abundances, and and are the line intensities of the main and isotopic lines respectively. The main line is smoothed to the velocity resolution of the corresponding isotope, and the opacity calculation is performed for all velocities within the FWHM of the isotopic line. This technique assumes that the excitation temperature is the same for the main and isotopic species. Isotopic abundance ratios of [HCO+]:[H13CO+] 65:1, [CS]:[C34S] 22.5:1, and [CO]:[C18O] 280:1 are assumed (Wilson and Rood, 1994).
From Figure 2, it is seen that all the observed optical depth profiles towards the central position of SMM4 shows a red asymmetry, which is consistent with an infall scenario towards this object. Moreover, it is seen that for similar angular and spectral resolutions, HCO+ has greater optical depth, and hence, seems to trace infall better than CS. The latter result is probably due to the fact that the dipole moment of HCO+ is twice that of CS, and hence, line and opacity profiles of HCO+ would be expected to show more pronounced asymmetries.
3.3 Integrated Intensity Maps
3.3.1 CO Maps
The CO J=10 and J=32 spectra in Figure 1 show deep self-absorption and line wings, suggesting the presence of outflows in this source. Previous attempts at associating specific outflows with the individual submillimeter sources in the Serpens cloud have shown a complex set of flows in this region (White et al, 1995; Wolf-Chase et al, 1998; Davis et al., 1999). We performed wide-field imaging (20′ 12′) of the CO J=10 emission towards the Serpens region to understand the global distribution of CO. Higher transitions of CO tend to pick up the hotter, denser gas that may be associated with the outflow closer to the driving source, and so we mapped a smaller region of the J=32 transition around SMM4. In Figure 3, we present three successively zoomed in views of the outflows in three different CO transitions towards SMM4.

The EHV lobes of CO J=10 in Figure 3 show several flows. At least four distinct redshifted lobes are seen: one east of SMM3, one northeast of SMM6, one west of SMM1, and one south and west of SMM4 and SMM2. However, corresponding blueshifted lobes that may form a bipolar flow are seen to be less distinct. There is one blueshifted lobe west of SMM1. In the vicinity of SMM4, blueshifted emission occurs to the north of SMM4 and to the south and east of SMM2. In the archival JCMT CO J=21 data shown in the top left of Figure 3, a distinct bipolar flow is seen in the region around SMM4, with EHV blueshifted emission to the north-east of SMM4, and redshifted emission to the south-west. The lobes seen in the J=21 data have good correspondence with the J=10 data. In addition the J=21 EHV emission does not seem to trace the lower excitation material seen in the J=10 EHV emission. This detection of outflow towards SMM4 is confirmed in the CO J=32 map obtained with the HHT (top right plot of Figure 3), which also shows the same orientation and direction of the outflow. Curiously, in the J=21 map of Figure 3, the blueshifted lobe of emission north-east of the driving source has a different position angle (°° measured east of north) from the redshifted lobe of emission which seems to be directed almost due south of the driving source. A similar morphology is seen in the CO J=32 map, with the p.a. of the blueshifted lobe being even further eastward (°° east of north) than in the J=21 transition444The uncertainties in the position angles are estimated from the angles subtended from the driving source location to the edges of the half-power contours in the corresponding integrated intensity map.. Close to the driving source, it is possible that the redshifted lobe has a similar p.a. to the blueshifted one. But further downstream ( 30″ away), the redshifted lobe becomes more north-south in direction, possibly due to some interaction of the outflow with the ambient cloud material. The difference in the position angles of the blue and redshifted lobes of the outflow might be due to precession in the underlying jets. Higher angular resolution observations will be required to test this hypothesis.
3.3.2 HCO+ Maps
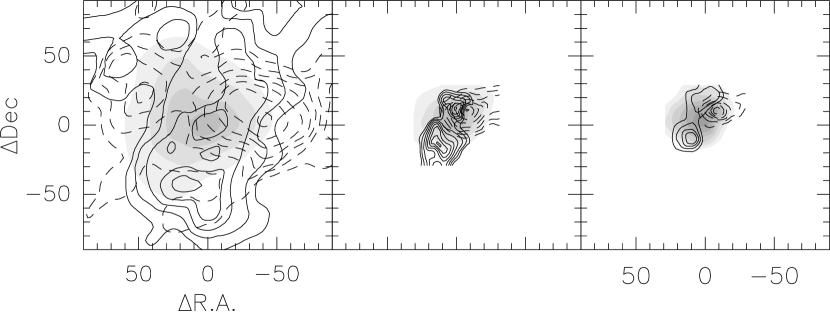
The blue-bulge signature is expected to be seen in the centroid velocity maps of optically thick, density sensitive tracers like HCO+, which preferentially traces the infalling dense cloud core. On the other hand if HCO+ emission arises mostly from the outflow material, the interpretation of the centroid velocity signature becomes less clear. Do the molecular outflows mapped in CO have an effect on the HCO+ line profiles? To determine this, we made integrated intensity maps of the blueshifted, linecore and redshifted emission of HCO+ J=10, J=32, and J=43. Figure 4 shows the maps, where the integrated intensity in the line core is shown in grayscale, while the blueshifted and redshifted integrated intensity maps are shown in dashed and solid line contours respectively. While the linecore integrated intensity maps are expected to trace the dense (infalling) molecular cloud core, the linewing maps might indicate if the HCO+ emission is arising from material entrained by the outflow.
The HCO+ J=10 linecore integrated intensity map of Figure 4 is centered on SMM4, but has a morphology that is extended along the direction of the CO outflow, as well as orthogonal to it. The elongation of the linecore emission orthogonal to the outflow might be due to the embedded dense cloud core. At the same time, the component of the J=10 linecore emission that is elongated along the outflow direction might be taken as morphological evidence for the contamination of HCO+ J=10 linecore emission from material associated with the high velocity molecular outflow. The J=10 linewing emission also follows these orthogonal directions, but shows heavy contamination by the outflow. The peak emission of the redshifted outflow lobe seen in the JCMT CO J=21 map (see Figure 3) at an offset of (,) is also seen in the HCO+ J=10 redshifted linewing emission, indicating that HCO+ J=10 linewing emission is probably arising from the swept-up dense shells of the underlying outflow.
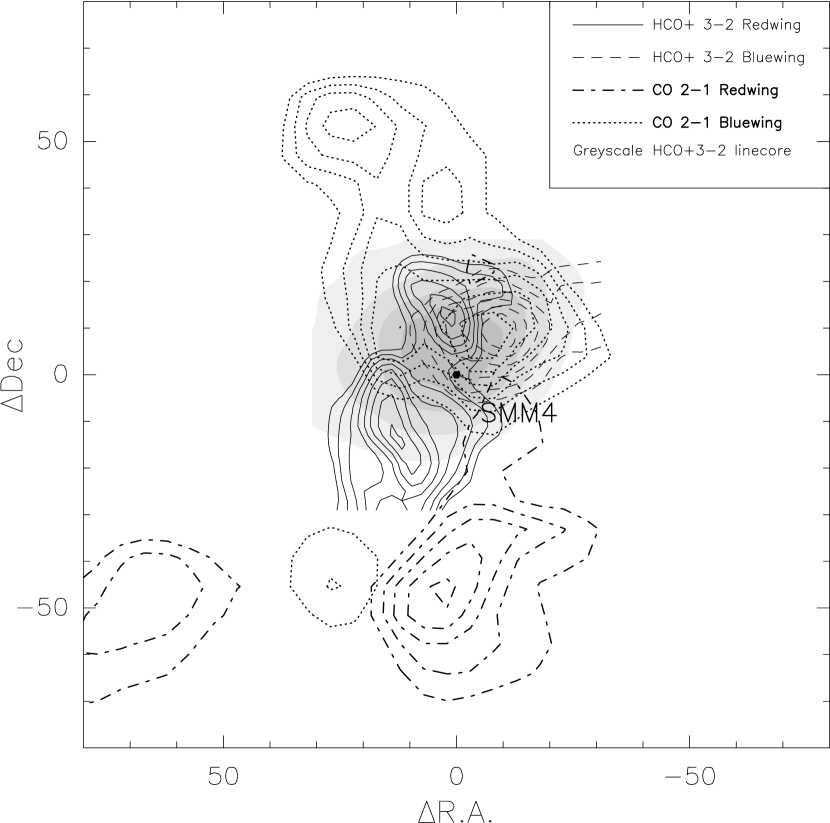
Higher-lying transitions of HCO+ have higher critical density and excitation requirements and are expected to be less contaminated by outflow. Indeed, the integrated intensity maps of JCMT HCO+ J=32 emission in Figure 4 show very little evidence for extension along the outflow. The linecore map appears elliptical and is centered on SMM4, and probably traces the infalling, dense cloud core. The morphology of the linewing emission is a little more complicated. There are two distinct lobes of redshifted emission. The one in the north is probably associated with the redshifted component also seen to the north in the CO map (see Figure 3). The northern redshifted lobe might be associated with the SMM3 source. Other than this, there is a blueshifted lobe to the northwest and a redshifted lobe to the southeast. To study in detail the effects of the outflow on the HCO+ line profiles, in Figure 5, we superpose the JCMT CO J=21 outflow maps of Figure 3b with the JCMT HCO+ J=32 maps from Figure 4b. Several important conclusions can be drawn from this figure. The HCO+ J=32 linewing and linecore emission have similar position angles, and it is approximately orthogonal to the direction of the outflow, which indicates that both linecore and linewing submillimeter HCO+ emission might be tracing the dense starforming cloud core. The redshifted lobe of HCO+ J=32 emission is clearly anticorrelated with any outflow emission. On the other hand, the blueshifted linewing emission of the HCO+ J=32 transition is positionally coincident with the blueshifted lobe of the CO outflow. It is possible that the blueshifed outflowing gas is interacting with dense ambient gas in the foreground giving rise to the blueshifted HCO+ emission seen northwest of SMM4. Due to possibility that some portion of the linewing emission of HCO+ might be contaminated by outflow, in the next section, when we derive the centroid velocity maps, we will only use the linecore of HCO+ emission to trace any infall signatures. The linecore emission of HCO+ J=32 is flattened and elliptical and appears orthogonal to the outflow. From the elliptical lobe of emission in the HCO+ J=32 linecore (see Figures 4 and 5), we estimate a position angle of °° west of north for the major axis of the ellipse. If this elliptical lobe of emission traced in the HCO+ J=32 linecore is tracing a rotating cloud core, then it could be used to constrain the position angle of the outflow, as the outflow would be expected to be orthogonal to the orientation of the cloud core. The approximately northeast-to-southwest direction implied by the blueshifted outflow lobe is more consistent with the orientation of the HCO+ cloud core, than a north-south outflow implied by the redshifted lobe of the outflow (see Figure 3). Our numerical modeling of the infall region (see §4.1 below) is also more consistent with a ° position angle than a north-south orientation for the rotational axis. A rotating type of structure was also seen in the case of the protobinary IRAS 16293, where submillimeter linecore and linewing emission of CS J=76 and HCO+ J=43 showed evidence for a rotating, circumbinary structure (Narayanan et al., 1998).
The HCO+ J=43 maps seen in the rightmost panel of Figure 4 also show a similar result. Here too, the lincore emission is elongated orthogonal to the outflow, and the HCO+ linewings seem to trace rotation in the cloud core. The orthogonality of the HCO+ J=43 linewing emission from the EHV linewing emission of CO J=32 (see Figure 3) is even more pronounced. It is also seen that the peaks of redshifted and blueshifted emission of this next higher transition are located closer to the center of SMM4 compared to the HCO+ J=32 lobes, probably due to the enhanced excitation conditions closer to the center of the object.
In summary, the linewing emission of HCO+ becomes progressively less associated with outflow as we go up the rotational ladder. The linecore emission of the J=32 and J=43 transitions of HCO+ are likely not impacted by the outflow, while the HCO+ J=10 linecore emission might be tracing both the embedded cloud core as well as dense shells of the molecular outflow.
3.4 Centroid Velocity Maps
The centroid velocity of a line profile is that velocity at which the integrated intensity (the area under the line profiles) is equal on either side. Centroid velocity maps have been shown to be a better tool in the detailed study of complicated velocity fields than integrated intensity maps (Adelson & Leung, 1988; Narayanan et al., 1998). Centroid velocity maps of CS and HCO+ emission derived from numerical models of collapse have been shown to be a good indicator of underlying infall and rotational velocity fields (Narayanan and Walker (1998), hereafter NW). In the model isovelocity maps of NW, the rotational velocity field imposes a gradient of blueshifted to redshifted velocities, with the sense of the gradient being orthogonal to the rotational axis. When infall dominates in the central regions, the line profiles in the central region become blue asymmetric, and hence there is a preponderance of blue-shifted velocities in the central regions of the isovelocity maps, giving rise to the so-called “blue-bulge” signature. NW also showed that if the angular momentum content in a given cloud is low, or if the infalling cloud core is observed with low angular resolution, then the blue-bulge signature is “washed-out”, that is the central regions of the isovelocity maps just consist of blue-shifted velocities. The first detection of the predicted blue-bulge signature was reported towards IRAS 16293 (Narayanan et al., 1998).
In Figure 6, we present the centroid velocity maps of the observed HCO+and CS transitions towards SMM4. The centroid velocities are expressed with respect to the vLSR of the source, i.e., we have subtracted the vLSR (8 kms-1) from the centroid velocities, making negative velocities (shown with dashed lines) blueshifted, and positive velocities (shown with solid lines) redshifted. In an effort to separate out the effect of outflow velocity fields from the dynamics of the cloud core, the velocity centroids were computed over line core velocities. As shown in §3.3.2, HCO+ linecore emission, especially of the submillimeter transitions, is mostly distinct from effects of molecular outflow.
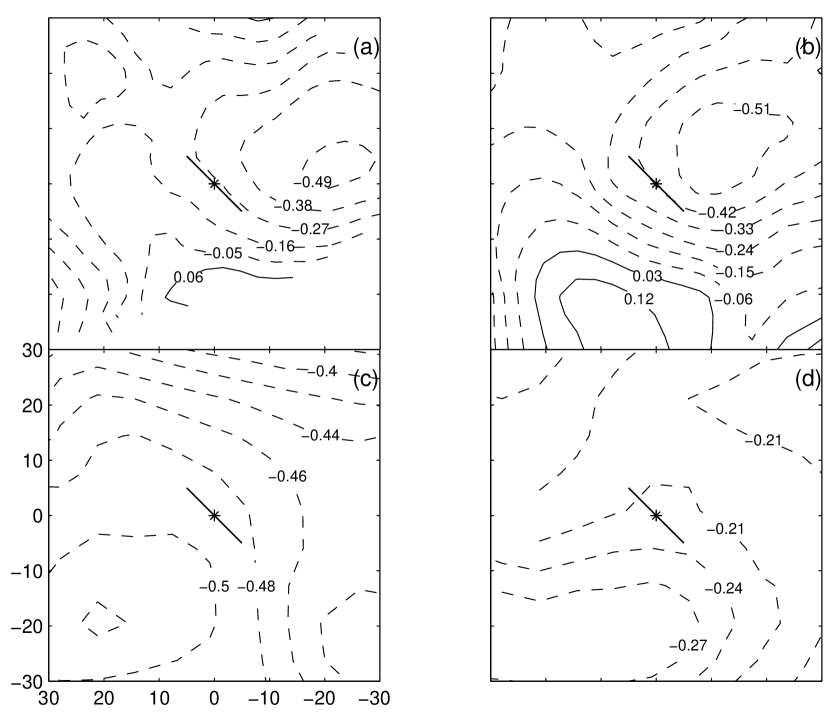
All four maps shown in Figure 6 show an increasing gradient in centroid velocity from the northwest to the southeast. The contours are seen to be more or less parallel, and is approximately orthogonal to the major axis of the ellipse of HCO+ linecore emission. The gradient is more ordered and pronounced in the submillimeter transitions. The blueshifted emission in all four centroid velocity maps are seen to encroach well south of the rotational axis and the central source at (0,0), pushing redshifted velocities to the extreme southeastern edge of the map. In Figure 6, the submillimeter maps of HCO+ J=32 and J=43, probably because of the higher angular resolution (19″ and 21″ respectively), show the blue-bulge signature more clearly. The millimeter maps of CS and HCO+ (bottom panels of Figure 6) are at lower angular resolution (55″ and 60″ respectively), and as predicted by theory (Narayanan and Walker, 1998), at lower angular resolution the blue-bulge signature appears washed out, so that only blueshifted velocities are seen. As was discussed above, even the linecore emission of millimeter HCO+ is affected by outflow. However, the gradient seen in the bottom panels of Figure 6 is not north to south or north-east to south-west, as might be expected if the millimeter lincore emission was only purely tracing the outflow. The gradient is northwest-southeast which is approximately orthogonal to the outflow. This argues that the dominant underlying velocities traced by even the millimeter CS and HCO+ linecore emission are rotation and infall. Thus, all four centroid velocity maps in Figure 6 are consistent with the detection of the blue-bulge infall signature towards SMM4.
4 Discussion
4.1 Infall Parameters Using TSC Models
One of the thorniest problems in the unambiguous detection of infall is the kinematic confusion that exists in protostellar regions. The velocity fields associated with protostars include infall, rotation, turbulence and outflow motions. To disentangle these motions, one needs an accurate physical model for the protostar and a flexible radiative transfer code to predict the appearance of emergent spectra. Such model calculations will help us derive observational diagnostics and procedures to disentangle the kinematics in real protostellar systems. In addition, such models can be used to constrain observations and derive useful physical information of the protostellar region under study.
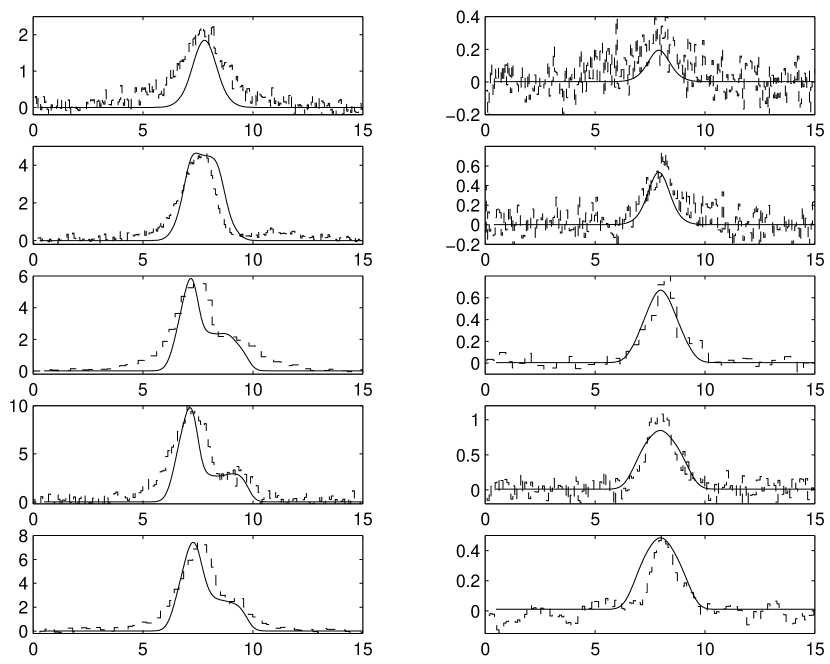
While there have been several studies of line formation in a spherically symmetric cloud core undergoing only infall motions (e.g. Walker et al., 1986; Zhou, 1992; Choi et al, 1995), only a few studies have included rotation into the mix (e.g. Zhou, 1995; Walker et al, 1994; Narayanan et al., 1998; Narayanan and Walker, 1998). We follow the prescription outlined in Narayanan et al. (1998) in using the TSC (Terebey et al., 1984) solution of protostellar collapse to model our observations. The TSC solution naturally accounts for infall and rotation. In Table 3, we present the results of fitting all our observations with the 3-dimensional TSC infall models. The infall radius rinf, sound speed , the time since onset of infall tinf (t), rotational rate , and the turbulent velocity used in the radiative transfer solution are summarized in Table 3. About fifty model runs were made by varying the infall parameters each time. The synthetic observations were then convolved to the resolution of the telescopes used in the observations presented in this paper. For the modeling, the main and isotopic lines of all the observed CS and HCO+ data from this work were used to obtain best fits to the observations. In the fitting process, the entire mapping data obtained observationally are compared with the synthetic model maps. The best fit model is obtained “by eye”, comparing not only the spectral profiles, but also the integrated and centroid velocity maps. While efforts were made to ensure goodness of fit for the entire line profile, more emphasis was laid on the linecore (which is expected to be less impacted by outflow). Figure 7 shows the best-fit model spectra overlaid on the observed spectra for the main and isotopic lines towards the central position of SMM4. While only the central spectra are shown for each transition, the fits are good through most of the mapped regions.
| Parameter | Value |
|---|---|
| 0.5 km s-1 | |
| rinf | 0.015 pc |
| tinf | yrs |
| vturb | 0.75 km s-1 |
The TSC model is a parameterized model, and hence the search space to obtain the best fit model is quite large. For this reason, observational constraints when available, were used to set the initial value of the infall parameters in the fitting process. The initial value of the infall radius rinf was constrained using the ratio of HCO+ J=32 main beam temperatures towards the central source obtained from JCMT and HHT. As shown in Narayanan et al. (1998), it is possible to constrain the emitting source size from the ratio of the main beam temperatures of the same transition obtained at two different telescopes with different beam sizes. At 267 GHz, the main beam efficiencies are 0.6 and 0.71, and beam sizes are 19″ and 28″ respectively for JCMT and HHT, which can be used to obtain the emitting source size of SMM4 to be 10.5″. This size is in very good agreement with the core size derived from molecular emission observed with high angular resolution aperture synthesis observations (Hogerheijde et al, 1999). Now that rinf is constrained, if the time since onset of collapse tinf is known, the initial value of the effective sound speed can be determined. It is now believed that the pure infall phase before the onset of molecular outflows is extremely short-lived or non-existent (Andrè et al, 1993; Saraceno et al., 1996). Hence the dynamical time-scale of the observed outflows can be used as a good indicator of tinf. From the projected EHV lobes in the JCMT CO J=21 data shown in Figure 3 and the maximum flow velocity, we derive an outflow dynamical timescale of years, which was used as the initial value of tinf in the model fits. The angles subtended by the rotational axis in and out of the plane of the sky are also input parameters to the models. The angle in the plane of the sky is taken to be (east of north) from the appearance of the outflow lobes in Figure 3. We initially assumed that the outflow was in the plane of the sky, and the best-fit models are consistent with this interpretation. The best value of vturb was chosen from the linewidth of our H13CO+ observations. For our model fits we used a temperature distribution profile of K. In the radiative transfer program we used a HCO+to H2 abundance of and CS to H2 abundance of . For isotopic ratios, we used [12C/13C] and [32S/34S] .
Since the fitting is done “by eye”, it is difficult to claim that the best fit model is a unique fit to the observed data. While some model parameters are only loosely constrained, the modeling exercise does set strong constraints on other parameters. For example, the direction and size of the gradient seen in the centroid velocity maps shown in Figure 6 can only be reproduced in the models, by assuming a rotational axis at an ° position angle. Assuming a north-south or east-west orientation of the rotational axis results in model centroid velocity maps that have gradients west to east and north to south, not the north-west to south-east sense seen in Figure 6. The angle that the rotational axis makes to the plane of the sky is also well constrained. Significant departures from the assumed orientation, viz., the rotational axis is in the plane of the sky, results in bad fits to the ratio of blue-to-red peaks of the HCO+ lines.
4.2 Infall Size Scales, Velocities and Rates
The best fit infall size of pc corresponds to an angular diameter of ″ at the distance of the Serpens cloud. The HCO+ estimated core size (as discussed above) is 10″, so this indicates that the expansion wave might have already escaped the densest regions of the core. As seen in Figure 3, other protostellar sources are located quite close to SMM4. The TSC model is applicable only to isolated collapse resulting in a single protostar. The values derived above for the infall parameters of SMM4 using the TSC model should thus be interpreted with some caution. If we assume that the constrained infall parameters are not heavily affected by the cluster environment, we can quantify some other physical parameters in the SMM4 system.
From Table 3, the infall timescale is given by yrs. This number is in good agreement with the lower limit to the age of the outflow system derived as yrs in this work (see above), as well as the estimate of years from the CO observations of Davis et al. (1999). This would indicate that outflow was triggered almost simultaneously with the onset of collapse in SMM4. The rotational velocity, s-1 implies that the turnover radius pc . From the self-similar solution of Shu (1977), a mass accretion rate of M⊙yr-1 is derived. The present mass of the star-disk system can then be calculated by giving a mass of M⊙, which falls well within the dust mass limits derived by Hogerheijde et al (1999) for SMM4. The centrifugal radius (or the accretion disk radius) of the SMM4 system at the present epoch is AU.
It is expected that the observed luminosity of L⊙ (Hogerheijde et al, 1999) in SMM4 is probably dominated by the process of accretion. If we assume all the observed luminosity arises from accretion onto one star, we can estimate the mass of the star as follows: the bolometric luminosity is given by , where R R⊙, and M⊙yr-1. This gives M⊙. Since the mass of the star-disk system is M⊙, the mass of the central disk is M⊙. The maximum value of the disk mass that is stable to m gravitational instability is given by (Adams and Lin, 1993). In the case of SMM4, this ratio is 0.67, which implies that the disk should be gravitationally unstable against collapse or fragmentation. From the above discussion, it appears that both the cloud core and accretion disk (if present) are in a state of dynamical collapse.
4.3 Robustness of the Infall Interpretation
The observational identification of dynamical collapse in the early stages of star formation has been a subject of repeated controversy (see Zhou & Evans, 1994, for a review). Given the history of the subject, it is natural to worry about whether our identification of collapse in our sources is indeed the only unique conclusion. Below we discuss some alternate models and methods of their elimination.
In identifying the classic asymmetric blue peak signature of an observed line profile with infall, we have to worry about four possible alternatives: (1) two cloud components along our line of sight, and the blueshifted cloud happens to be stronger; (2) a background component that is being absorbed by an unassociated foreground component that happens to be redshifted; (3) an outflow source with a stronger blue lobe; (4) the blueshifted part of a rotating cloud. Statistically speaking, all four models listed above have a 50% chance of producing the asymmetric blue profile. The infall scenario has a 100% chance of producing the asymmetric blue signature. In observing a large number of infall candidates, the preponderance of blueshifted asymmetry in the central line profiles can be statistically interpreted as identification of infall (Gregersen et al., 1997). However, for individual sources, the blue asymmetric line profile alone is not unique evidence for infall.
If we observe a second line that is optically thin, we can start eliminating some of the models mentioned above. In model (1), the optically thin line would have two peaks or a single peak aligned in velocity with one of the two cloud components. In model (2), the optically thin line should show a single peak aligned in velocity with the background component. On the other hand, if the observed optically thin line has a single peak in the absorption dip of main line, this would eliminate both models (1) and (2). Another effect to study when observing an isotopic line is to use line ratios of main to isotopic transitions, as was done in this work, to derive an optical depth profile. Infall would be expected to produce an asymmetric red profile in optical depth, in addition to an asymmetric blue peak in the line profile. In models (3) and (4) we would not expect the red asymmetry a-priori in the optical depth profile. For instance, a strong blueshifted outflow lobe (model 3), in the presence of an increasing temperature gradient toward the center of the source, would be expected to have an asymmetric blue optical depth profile as well as an asymmetric blue line profile. However, to eliminate models (3) and (4) convincingly, we need line maps to determine the effect of outflows and rotation.
Effects of outflows are not expected to be seen orthogonal to the outflow. For sources, where outflow is in the plane of the sky, its effects are expected to be somewhat reduced. One way to get around the problem of outflow contamination is to choose molecular species that are not very abundant in outflows. We have adopted this technique in our study by choosing the HCO+J=32 and J=43 transitions, which because of their higher critical densities are not expected to be excited in outflows. Detailed study of maps of the HCO+ transition along with high velocity CO maps from outflows, as was done in this work, will help us understand the effect of outflows on the identification of the infall signature.
The blue-bulge signature obtained by mapping an optically thick transition naturally takes into account the effect of rotation. Are there other interpretations other than infall when we observe the morphology of the blue-bulge signature? Outflows can produce a gradient from blueshifted to redshifted velocities (e.g. Narayanan & Walker, 1996). However, such a gradient should be in the same direction as the outflow. The choice of the vLSR of the cloud is somewhat critical in determining the distribution of blueshifted and redshifted velocities in the centroid velocity maps. By obtaining careful observations of an optically thin tracer (which would show a gaussian profile about the vLSR), such systematic errors can be reduced. To zeroth order, however, we have found from models and observations that the overall morphology of the gradient and bowing of the velocity contours towards the center of the source is independent of the choice of both the velocity window and the cloud velocity. When the velocity gradient is orthogonal to the outflow, and the blue-bulge morphology is seen, the simplest explanation is one that involves infall.
SMM4 is a prototypical infall candidate in that all three conditions, viz. the right sense of asymmetry in line profiles (blue asymmetric) and optical depth profiles (red asymmetric), and the blue-bulge signature in centroid velocity maps of density sensitive molecules are seen. In summary, convincing evidence for infall in individual sources requires both mapping and obtaining isotopic transitions. In the case of SMM4, the mapping data and isotopic data from density sensitive molecules are consistent with an infall interpretation.
5 Summary of Results
The region around the Class 0 protostellar system SMM4 in the Serpens cloud core has been mapped in several millimeter and submillimeter high density molecular tracers, providing the detection of kinematic infall signatures towards this object. These observations show both the classic blue-asymmetric line profile signature and the blue-bulge centroid velocity signature of infall. The main conclusions of this paper are summarized below.
-
1.
The line profiles of optically thick main isotopes of HCO+ J=10, J=32 and J=43, and CS J=21 exhibit the characteristic blue asymmetric line profile signature consistent with infall. Blue asymmetric line profiles are also seen in the CO J=10, J=21 and J=32 transitions. In all cases, the centroid velocity of the optically thick main isotope is bluer than the optically thin rarer isotope.
-
2.
The HCO+, CS and CO optical depth profiles obtained from main and isotopic transitions show a red asymmetry also consistent with an infall interpretation.
-
3.
Wide-field mapping of CO J=10 emission shows that the Serpens region has many criss-crossing outflows. From high signal-to-noise ratio smaller scale CO J=21 and J=32 maps, a bipolar outflow associated with SMM4 has been identified.
-
4.
Centroid velocity maps made with linecore emission of CS J=21, and HCO+ J=10, J=32 and J=43 transitions showed the blue-bulge infall signature. The blue-bulge infall signature is a robust indicator of collapse in protostellar objects where infall dominates over rotation, and one can disentangle the outflow field.
-
5.
We used three-dimensional radiative transfer models based on the rotating, collapse model of Terebey, Shu and Cassen and derived infall parameters for SMM4. The constraints for the infall size is AU. The dynamical age of the outflow and infall phase of the SMM4 system is yrs, which falls well within the predicted duration of the Class 0 stage of early stellar evolution.
References
- Adams and Lin (1993) Adams, F. C., and Lin, D. N. C., 1993, in Protostars and Planets III, ed. E. H. Levy and J. I. Lunine (Tucson: University of Arizona Press), 732
- Adelson & Leung (1988) Adelson, L. M. and Leung, C. M., 1988, MNRAS, 235, 349
- Andrè et al (1993) Andrè, Ph., Ward-Thompson, D., and Barsony, M. 1993, ApJ, 406, 122
- Barsony (1994) Barsony, M. 1994, ASP Conf. Ser. 65, Clouds, Cores and Low Mass Stars, D. P. Clemens and R. Barvainis (San Francisco: ASP), 197
- Casali et al (1993) Casali, M. M., Eiroa, C., Duncan, W. D. 1993, A&A, 275, 195
- Choi et al (1995) Choi, M., Evans, N. J., Gregersen, E. M., and Wang, Y., 1995, ApJ, 448, 742
- Davis et al. (1999) Davis, C. J., Matthews, H. E., Ray, T. P., Dent, W. R. F. and Richer, J. S. 1999, MNRAS, 309, 141
- Erickson et al (1999) Erickson, N. R., Grosslein, R. M., and Erickson, R. B., 1999, to appear in IEEE Trans. on Microwave Theory & Techniques.
- Gregersen et al. (1997) Gregersen, E. M., Evans, N. J., Zhou, S., and Choi, M., 1997, ApJ, 484, 256.
- Hogerheijde et al (1999) Hogerheijde, M. R., van Dishoeck, E. F., Salverda, J. M. and Blake, G. A. 1999, ApJ, 513, 350.
- Hurt & Barsony (1996) Hurt, R. L. and Barsony, M. 1996, ApJ, 460, L45
- Mardones et al (1997) Mardones, D., Myers, P. C., Tafalla, M., Wilner, D. J., Bachiller, R., and Garay, G., 1997, ApJ, 489, 719
- Narayanan & Walker (1996) Narayanan, G., and Walker, C. K., 1996, ApJ, 466, 844.
- Narayanan (1997) Narayanan, G., 1997, Ph. D. Thesis, University of Arizona
- Narayanan et al. (1998) Narayanan, G., Walker, C. K., and Buckley, H. D. 1998, ApJ, 496, 292
- Narayanan and Walker (1998) Narayanan, G., and Walker C. K. 1998, ApJ, 508, 780 (NW).
- Narayanan et al. (2001) Narayanan, G., Moriarty-Schieven, G. M., Butner, H. B., and Walker, C. K. 2001, in prep.
- Saraceno et al. (1996) Saraceno, P., André, P., Ceccarelli, C., Griffin, M., and Molinari, S., 1996, A&A, 309, 827
- Terebey et al. (1984) Terebey, S., Shu, F. H., and Cassen, P., 1984, ApJ, 286, 529 (TSC)
- Testi & Sargent (1998) Testi, L., and Sargent, A. I. 1998, ApJ, 508, L91
- Walker et al. (1986) Walker, C. K., Lada, C. J., Young, E. T., Maloney, P. R., and Wilking, B. A. 1986, ApJ, 309, L47
- Walker et al (1994) Walker, C. K., Narayanan, G., and Boss, A. P., 1994, ApJ, 431, 767
- White et al (1995) White, G. J., Casali, M. M., and Eiroa, C. 1995, å, 298, 594
- Wilson and Rood (1994) Wilson, T. L., and Rood, R., 1994, ARA&A, 32, 191.
- Wolf-Chase et al (1998) Wolf-Chase, G. A., Barsony, M., Wootten, H. A., Ward-Thompson, D., Lowrance, P. J., Kastner, J. H., and McMullin, J. P., 1998, ApJ, 501, L193
- Zhou (1992) Zhou, S., 1992, ApJ, 394, 204
- Zhou & Evans (1994) Zhou, S., and Evans, N. J., 1994, in Clouds, Cores and Low Mass Stars, ed. D. P. Clemens, and R. Barvainis (San Francisco: ASP), 183.
- Zhou (1995) Zhou, S., 1995, ApJ, 442, 685