Kinematic and morphological modeling of the bipolar nebula Sa2-23711affiliation: Based on observations collected at the European Southern Observatory, Chile
Abstract
We present [OIII]500.7nm and H+[NII] images and long-slit, high resolution echelle spectra in the same spectral regions of Sa2–237, a possible bipolar planetary nebula. The image shows a bipolar nebula of about 34″extent, with a narrow waist, and showing strong point symmetry about the central object, indicating it’s likely binary nature. The long slit spectra were taken over the long axis of the nebula, and show a distinct “eight” shaped pattern in the velocity–space plot, and a maximum projected outflow velocity of V106 kms-1, both typical of expanding bipolar planetary nebulae. By model fitting the shape and spectrum of the nebula simultaneously, we derive the inclination of the long axis to be 70o, and the maximum space velocity of expansion to be 308 kms-1. Due to asymmetries in the velocities we adopt a new value for the system’s heliocentric radial velocity of -30km.s-1. We use the IRAS & 21cm radio fluxes, the energy distribution, and the projected size of Sa2-237 to estimate it’s distance to be 2.10.37kpc. At this distance Sa2-237 has a luminosity of 340 L☉, a size of 0.37pc, and – assuming constant expansion velocity – a nebular age of 624 years. The above radial velocity & distance place Sa2–237 in the disk of the Galaxy at z=255pc, albeit with somewhat peculiar kinematics.
1 Introduction
Most low mass stars spend some time at the end of their lives as Planetary Nebulae (PNe) before they die away as cooling white dwarfs. The processes by which these spherically symmetrical low mass stars become –often highly asymmetric– PNe are not well understood. Especially strong asymmetries exist in the sub–class of bipolar PNe. Candidates for the formation of bipolar PNe include binary central objects, fast rotating single stars with strong magnetic fields, and interacting wind models. Although, for the more extremely collimated nebulae, a binary system is becoming a generally accepted necessity. A glance at Balick (1987), Schwarz et al. (1992) and Górny et al. (1999) shows that a majority of PNe are significantly asymmetrical. A recent overview of asymmetrical PNe is given in Kastner et al. (2000).
Bipolar PNe have been shown to have properties very different from those of the general population of PNe (Corradi & Schwarz, 1995). They form an interesting group combining shocks and photoionization, dust and gas, and very high outflow velocities with interesting kinematics. They have giant dimensions (several are 1pc), central stars with higher mass (as in type I PNe), and surprisingly, evidence shows they have lower than typical luminosities (Corradi & Schwarz, 1995). In some cases, the combination of high temperatures and excitation with low luminosity and the presence of a variable Near Infra-Red (NIR) source indicates the presence of a compact, hot binary component. In the case of M2–9, measurable expansion parallax (Schwarz et al. 1997) and internal movements (Doyle et al. 2000) have been observed. Several bipolar PNe possess point–symmetry and are, strictly speaking, not plane–symmetric as are the other bipolar PNe. The point–symmetry can be spectacularly clear (Schwarz 1993, López et al. 1993) and has been suggested to be due to precession in the binary orbit of the central object (Schwarz et al. 1992, Livio 2000).
The bipolar nebula Sa2-237 (PN G011.1+07.0, 17h44m42s -15°45′13″J2000.) which is briefly presented in a poster paper by Masegosa et al. (1999), is discussed in some detail in this paper. Information on Sa2-237 is sparse, a SIMBAD search only resulted in IRAS fluxes, and a heliocentric systemic radial velocity measurement of -81kms-1. The 18 references since 1983 are all to catalogs or papers discussing samples of PNe; apart from the Masegosa poster, no papers have been found about the object itself. The kinematic and morphological analysis of Sa2-237 presented here will hopefully advance the understanding of the interesting characteristics of bipolar PNe.
2 Observations & Data
The spectra were secured with EMMI, the ESO Multi Mode Instrument, mounted at the NTT, during the night of 2000.12.04. Using the long slit echelle mode with grating 14 results in a resolution of 0.004nm per pixel on the CCD. A slit width of 08 on the sky gives a spectral resolving power of 70000 spatially projecting onto 2.2 pixels. The CCD was a Tektronix TK2048EB 2k2 chip with 24 pixels each covering 028 on the sky along the slit of 300″length. The CCD has a RON of 5e, a dark current of 1.7e pix-1hr-1, and was used with a gain of 2.17eADU-1 in the unbinned mode. The order of the echelle grating was selected by using an H filter (ESO No.596) passing also the [NII] lines at 654.8 & 658.3nm, or an [OIII]500.7nm filter (ESO No.589). The exposure times were 4800s (in two 2400s exposures) for the H spectrum, and 2400s for the [OIII] spectrum. For details on the NTT, EMMI and it’s filters and gratings, see www.ls.eso.org/lasilla/Telescopes/NEWNTT/
The images were also taken with EMMI, but used in the RILD imaging mode. The same ESO filters used for the spectra were used to acquire the images, and the exposure times were 500s for the [OIII] image and 300s for H.
The observations were reduced in the usual way using the IRAF package (see www.iraf.noao.edu) and the resulting images and spectra are shown in Figures 1 & 2 respectively.
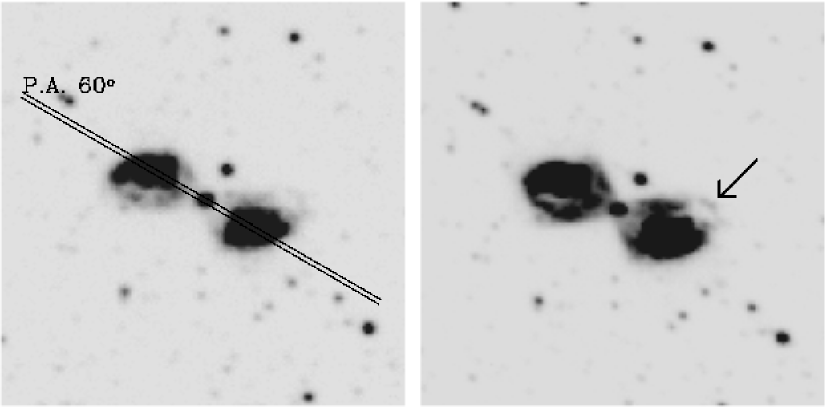
Our images show a bipolar nebula with a narrow waist extending over about 34″, and point symmetry about the central object. The lobes are oriented more or less to the E and W, and are brighter in the northern part of the E lobe and the southern part of the W lobe. In the extreme NW of the W lobe there is a faint loop visible, indicated by an arrow in Figure 1, which may have an even fainter counterpart in the opposite lobe. Deeper imaging may be able to resolve this, and also determine if there is fainter emission further away from the central object. Several other bipolars have had faint emission detected far from the brighter parts of the nebula: e.g. MyCn18 (Bryce et al. 1997) & M2–9 Kohoutek & Surdej 1980) therefore it is worth looking for this around Sa2–237. The object is extended in 2MASS NIR images, with the E lobe being the brighter, and the central object is much brighter than the nebula.
The position of the slit used to acquire the spectra in Figure 2 is over plotted on the [OIII] image. The same slit position was used to acquire the H+[NII]658.4 spectrum. The slit width of 08 is plotted to scale.
Additional data for this paper has been extracted from the literature. This includes the following fluxes and magnitudes for Sa2–237.
IRAS: 12 = 1.17 25 = 6.01 60 = 16.56 100 = 8.29 (Jy); Persi et al. (1987): J=11.85 H=11.05 K=10.72 L=8.7; 2MASS: J=13.06 H=12.57 K=11.83; Tylenda et al. (1991): B=16.08 V=15.50 & H=2.510-17Wm-2; Condon & Kaplan (1998): 1.4GHz (21cm)=5.8 mJy.
The Persi et al. and IRAS results are nearly co-eval (1984-1985) while the 2MASS magnitudes are from 1998; note the differences of up to 1.5 mag between the NIR measurements over the time interval of 14 yrs, indicating variability of the source.
The reported systemic radial velocity of Sa2–237 from Beaulieu et al. (1999) is -81kms-1.
3 Analysis
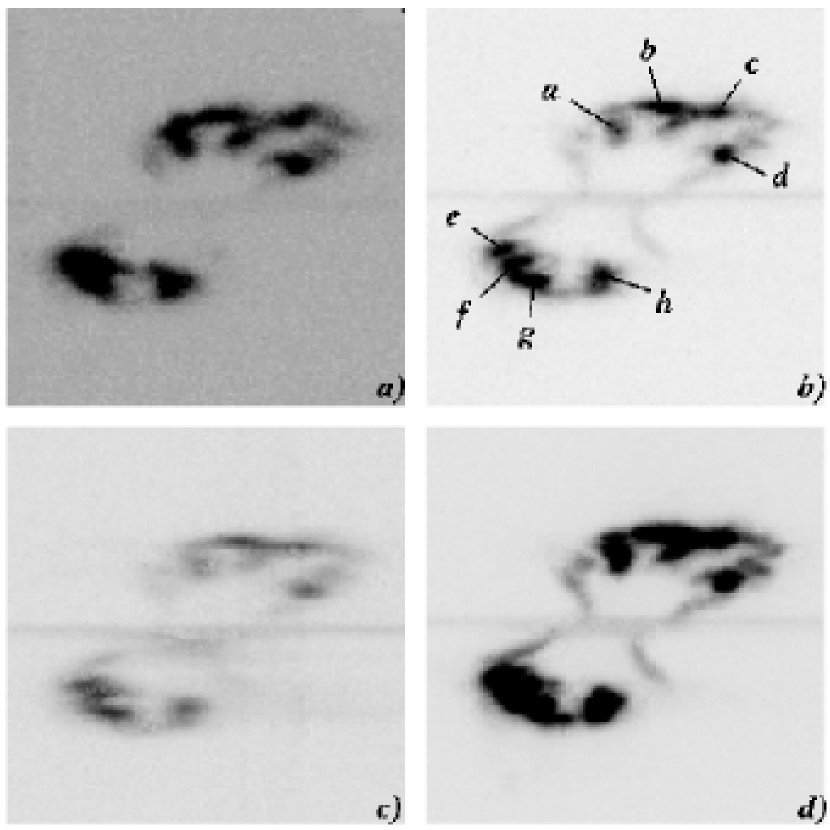
Radial velocities were extracted from the more intense regions of the spectra labeled from a to h in Figure 2. 2–D gaussian fits were used to determine the velocities listed in Table 1.
| Line | [OIII] | [NII] | H | [NII] |
|---|---|---|---|---|
| Part | 500.685 | 654.806 | 656.280 | 658.339 |
| a | 54 | 44 | 43 | 43 |
| b | 14 | 0 | 6 | 0 |
| c | -60 | -54 | -48 | -55 |
| d | -60 | -58 | -57 | -59 |
| e | 145 | 153 | 149 | 152 |
| f | 134 | 143 | 142 | 143 |
| g | 129 | 124 | 127 | 126 |
| h | 56 | 58 | 56 | 57 |
| 2Vmax | 205 | 211 | 206 | 211 |
2Vmax is the projected expansion velocity between the fitted regions with the largest velocity difference. We are aware that there is very faint emission at higher velocities but the SN ratio is too low to use these data for velocity calculations. Also, the smearing out due to seeing dictates the use of the fitted peaks for velocity determinations. This Vmax forms a lower limit to the true space expansion velocity since the projection has not been taken into account yet.
Note the difference in 2Vmax between the [NII] lines (211kms-1) and the [OIII] (205kms-1) & H (206kms-1) lines. An explanation lies in the behavior of the material and the excitation lines. [NII] and other low excitation lines (e.g. [OI], [SII]) form in the outer regions of these nebulae, while [OIII] is typically found closer to the central object. The velocity of the material tends to be directly proportional to the distance from the central object, hence the higher velocities in the [NII] line as shown in Sa2–237. As far as we are aware, this is the first time that this effect has been observed in a bipolar nebula; it is common in elliptical PNe.
A small intensity asymmetry between the blue and red shifted loops in the spectra indicates the likely possibility of a small misalignment of the slit. Such an offset would show up as an intensity asymmetry due to the point symmetric nature of the nebula. An estimated offset of 05 from the central object is sufficient to have caused this effect. Our conclusions, however, are not affected by this small offset.
We have derived the systemic velocity as the centre of the point symmetry of the eight shaped velocity–space plot. This follows directly from our modeling and is an accurate estimate of the system radial velocity. By applying the appropriate correction we find the heliocentric radial velocity of Sa2–237 to be -30kms-1. The LSR velocity for Sa2–237 is -16kms-1. Note that this is significantly different from the velocity reported by Beaulieu et al. 1998 & Durant et al 1998). For objects at l=11° in the Galactic plane we expect a small positive velocity of about VLSR=+10kms-1 at 2kpc. Our VLSR=-16kms-1, possibly indicates somewhat peculiar kinematics for Sa2–237 but we still place the object in the disk, albeit a bit far from the plane for a bipolar (type I) PN at 255pc. With the Beaulieu velocity it would have been impossible to kinematically place Sa2–237 in the disk.
The fluxes and magnitudes listed in Section 1 are used to create the energy distribution of Sa2–237 in Figure 3. The NIR values plotted are those from Persi et al. 1987, since they are nearly co–eval with the IRAS data.
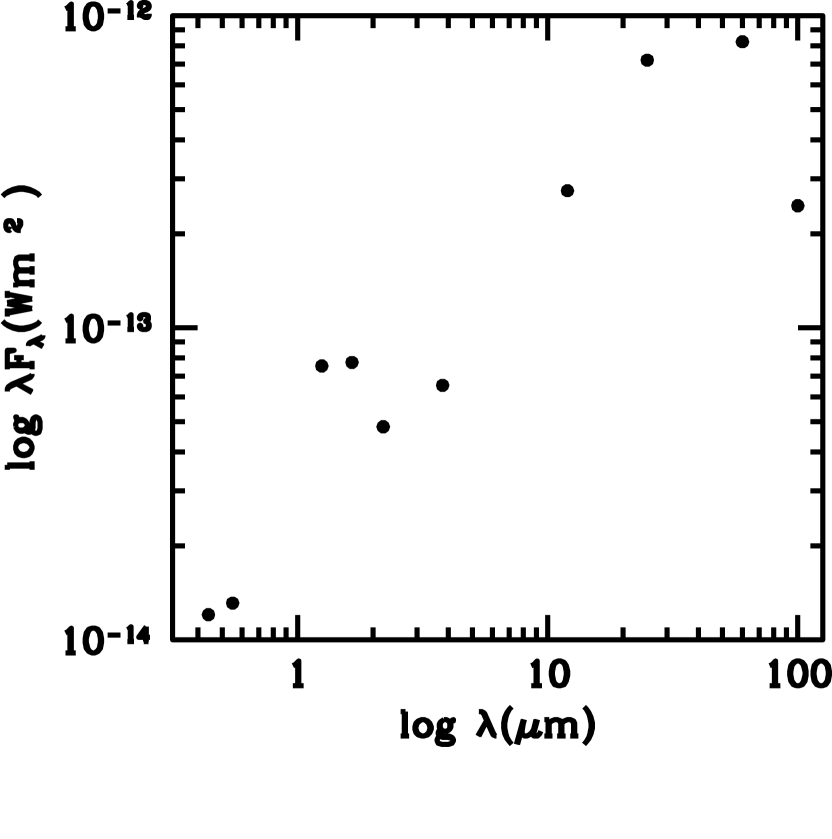
There is clearly a major contribution from the IRAS fluxes compared to the visible and NIR. This is addressed further below. Integrating the fluxes over wavelength, and correcting by a factor of 1.5 (Meyers et al. 1987) for the unobserved parts of the spectrum, yields L=77d2L☉ for the luminosity of Sa2–237, where d is the distance to Sa2–237 in kiloparsecs.
4 Model and discussion
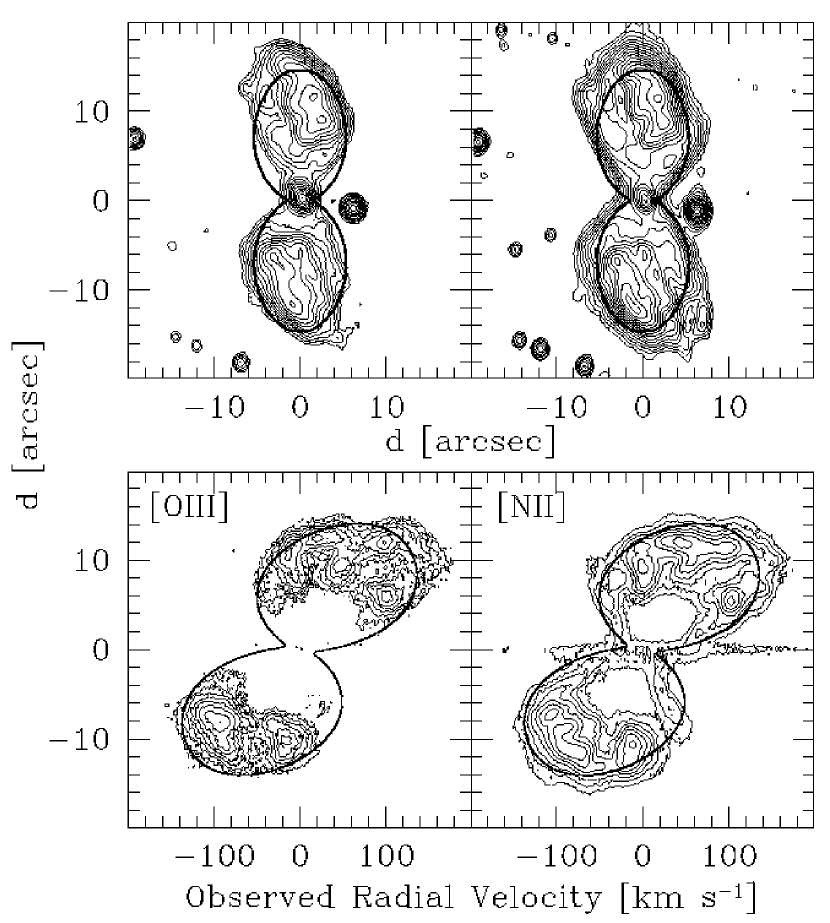
Using a simple model for the shape and kinematics of a generic bipolar
nebula, in the manner of Solf & Ulrich (1985), we fit the morphology
and spectrum of Sa2–237 simultaneously. The model has the following
properties: the velocity of expansion is proportional to the distance
from the center of the material, there is symmetry about the
equatorial plane, and no time evolution. The nebula therefore expands
in a self–similar way. The parameters are: the polar expansion
velocity, Vp, the ratio of polar to equatorial velocity, Rv, the
inclination to the line of sight of the polar axis, i, and the
agedistance-1, Pad. The expansion velocity as a
parametrized function of latitude in the nebula is given by:
V() = Ve+(Vp-Ve)sinγ()
where is the latitude, Ve & Vp are the equatorial and polar expansion velocities respectively, and is the shape factor. For more details see the paper by Solf & Ulrich (1985) whose parametrization we have followed here.
By fitting the shape of the image and the spectrum simultaneously, we derive the following parameters for Sa2–237: The inclination, i, to the line of sight is 70°and the maximum expansion velocity is 260kms-1.
We estimate the distance to Sa2–237 from the observational and
literature data. Comparision with M2–9, a well studied PN (although
some authors consider it to be a symbiotic nova; Sa2–237 may well be
such a nove as well) which has a similar morphology as Sa2–237 and a
well-determined distance of 640pc (Schwarz et al. 1997), and with
Mira, gives the following results:
Scaling the M2–9 distance of to that of Sa2–237 by the object’s 1.4 GHz radio fluxes gives 1.66kpc, by luminosity gives 2.68kpc and by size gives 2.11kpc. A similar comparison with the IRAS flux of o Cet, which has an accurate Hipparcos distance of 168pc, and assuming that the cool component in Sa2–237 is also a Mira, made plausible by the 1.5mag variability of Sa2–237, gives 1.96kpc. The average distance to Sa2–237 based on these four estimates, is 2.1kpc, with a standard deviation of 0.37kpc, which can be taken as the formal error on this value. We therefore adopt a distance of 2.1kpc0.37kpc to Sa2–237.
The distance of 2.1kpc is used to compute the following parameters for Sa2–237. The size of the object is 0.37pc, it’s luminosity is 340L☉, and the age of the nebula, assuming constant expansion velocity, is 624yrs. Using the model-derived inclination of i=70o, the space velocity of expansion of Sa2–237 is 308kms-1, using the maximum measured expansion velocity 2Vmax. Note that this tends to slightly overestimate the space expansion velocity since the maximum projected velocity, for objects near the plane of the sky, is not the polar one, but more due to material at an inclination angle marginally smaller than the 70°derived from the model, and located at a latitude slightly below the poles of the nebula. This would bring the observed space velocity nearer that derived from the model (see also below).
Comparing the results derived from the observational data with the model parameters, we get that the agedistance parameter, Pad=0.30, in good agreement with Pad=0.28 from the model, given the uncertainties in all parameters. The computed expansion polar velocity at i=70o is 308kms-1, cf. 260kms-1 from the model fitting. Note that only 4o difference in i, that is i=66o, gives 260kms-1 instead of 308kms-1, making also this a reasonable agreement. We therefore adopt a space expansion velocity of 308kms-1 for Sa2–37.
All these parameters are typical of bipolar nebulae, and this strengthens our confidence that Sa2–237 is indeed a bipolar PN or symbiotic nova such as M2–9, He2–104, or BI Cru (Corradi & Schwarz (1993) and various others.
The orientation near the plane of the sky of Sa2–237 implies that the central object is likely obscured by equatorial material, which would cause a large extinction. There must be a pole to equator density gradient to produce the bipolar shape, with the highest density at the equator. This is the reason why the IRAS contribution is much larger than the optical+NIR flux, as the FIR radiation comes from the equatorial disk as reprocessed optical and NIR flux absorbed in the torus. The energy distribution of M2–9 is similar and this object is also near the plane of the sky. Note that radio fluxes are not (or much less) affected by this and the distance ratios computed from the radio and IRAS fluxes confirm this: the radio distance is smaller (1.66kpc) than the IRAS ( luminosity) distance (2.68kpc), indicating some extinction in the IRAS flux but none in the radio.
One can, over the next years, attempt to measure the expansion parallax for Sa2–237, as we have done for M2–9, as it should be 0053 yr-1, at our distance of 2.1kpc. Taking one or two images per year would give a result within a few years, and would allow a direct check on our derived distance. We have started such a program of observations.
In the images, the nucleus of the nebula is relatively bright, but in the spectra no strong H emission appears. It is likely that it is a stellar spectrum, not an emission line core, as in symbiotic stars. It would be interesting to take a spectrum of this star and attempt to classify it.
5 Summary & conclusion
We summarize the properties of Sa2–237.
It is a bipolar planetary nebula, similar to M2–9, M1–16 and others, projecting 34″onto the sky, at a distance of 2.1kpc, with a size of 0.37pc, L=340L☉, and expanding at 2Vexp=616kms-1. It’s point symmetric morphology hints at the presence of precession and thus the central object may well be a binary. The object’s inclination is 70°to the line of sight.
Based on the symmetry in the observed expansion velocities, we adopt a heliocentric radial velocity for Sa2–237 of -30kms-1, and place it in the Galactic disk at z=255pc.
We suggest that the expansion parallax can be measured on a relatively short time scale as it is 005 p.a. This would confirm or adjust the distance to Sa2–237.
Spectra of the central object may tell us what properties it has, as it seems to be stellar in nature and not an emission line core, as in many other such objects.
6 Acknowledgments
The CTIO Research Experiences for Undergraduates Program is funded by the National Science Foundation.
References
- Balick (1987) Balick, B., 1987 AJ, 94, 671
- Beaulieu et al. (1999) Beaulieu, S.F., Dopita, M.A., Freeman, K.C. 1999 ApJ, 515, 610
- Bryce et al. (1997) Bryce, M., López, J.A., Holloway, A.J., Meaburn, J. 1997 ApJ, 487, L161
- Condon & Kaplan (1998) Condon, J.J., Kaplan, D.L. 1998 ApJS, 117, 361
- Corradi & Schwarz (1993) Corradi, R.L.M., Schwarz,H.E. 1993 A&A, 268, 714
- Corradi & Schwarz (1995) Corradi, R.L.M., Schwarz,H.E. 1995 A&A, 293, 871
- Doyle et al. (2000) Doyle, S., Balick, B., Corradi, R.L.M., Schwarz, H.E. 2000 AJ, 119, 1339
- Durant et al. (1998) Durant, S., Acker, A., Zijlstra, A. 1998 A&ASuppl.Ser., 132, 13
- Górny et al. (1999) Górny, S., Schwarz, H.E., Corradi, R.L.M., Van Winckel, H. 1999 A&ASuppl.Ser., 136, 145
- Kastner at al. (2000) Kastner, J. H., Soker, N., Rappaport, S. Eds.,Asymmetrical planetary nebulae II 2000 ASP Conference Series, Vol. 199
- Kohoutek & Surdej (1980) Kohoutek, L., Surdej, J., 1980 A&A, 85, 161
- (12) Livio, M., in Asymmetrical planetary nebulae II, Kastner, J. H., Soker, N., Rappaport, S. Eds., 2000 ASP Conference Series, Vol. 199, p. 243.
- López et al. (1993) López, J.A., Roth.M., Tapia, M. 1993 A&A, 267,194
- Masegosa et al. (1999) Masegosa, J., Vázquez, R., Miranda, L.F., Torelles, J.M., López, J.A., Sánchez del Rio, J. 1999 “Astrophysics with the NOT” p256 Karttunen, H., Piirola, V. Eds.
- Meyers et al. (1987) Meyers, P.C. et al. 1987, AJ, 319, 340
- Persi et al. (1987) Persi, P., Preite Martinez, A., Ferrari-Toniolo, M., Spinoglio, L. 1987 in “Planetary and Proto-Planetary Nebulae: From IRAS to ISO”, Preite Martinez, A. Ed.
- Schwarz et al. (1992) Schwarz, H.E., Corradi, R.L.M., Melnick, J. 1992 A&ASuppl.Ser., 96, 23
- Schwarz (1993) Schwarz, H.E. 1993 in ESO Conf. Proc. 46, 223 Schwarz, H.E. Ed.
- Schwarz et al. (1997) Schwarz, H.E., Aspin, C., Corradi, R.L.M., Reipurth, B. 1997 A&A, 319, 267
- Solf & Ulrich (1985) Solf, J., Ulrich, H. 1985 A&A, 148,274
- Tylenda et al. (1991) Tylenda, R., Acker, A., Stenholm, B., Gleizes, F., Raytchev, B. 1991 A&ASS, 89, 77