The radio/optical alignment and the recent star formation associated with ionized filaments in the halo of NGC 5128 (Centaurus A) ††thanks: Based on observations collected at the European Southern Observatory, Paranal, Chile, within the Observing Programme 63.N-0229, and on observations collected by Magellan I telescope at Las Campanas Observatory, Chile.
Abstract
We used the direct CCD camera at the Magellan I telescope at Las Campanas Observatory and FORS1 at Antu VLT at ESO Paranal Observatory to image fields centered on the inner and outer optical filaments in the halo of NGC 5128. In the vs. color-magnitude diagrams we have identified young blue supergiants associated with these line-emitting filaments located between the inner radio lobe and the northern middle lobe. Around the outer filament stars as young as 10 Myr were detected. They are principally aligned with the direction of the radio jet, but a vertical north-east alignment along the edge of the H i cloud is also present. Young stars in the inner filament field are found inside the bright knots of photoionized gas and are strongly aligned in the direction towards the center of the galaxy at the same position angle as the inner radio jet. Fitting the Padova isochrones on UV color-magnitude diagrams we find that the blue stars around the inner filaments have ages similar to the ones around the outer filaments Myr and the same abundance of Z=0.004. The presence of young blue supergiants clearly shows that the bright blue knots in the north-eastern halo of NGC 5128 are associations of young stars with photoionized gas. The temperature of the brightest stars is T K, insufficient to account alone for the high excitation lines observed in the surrounding ionized gas. Thus the optical emission jet is principally seen due to its alignment with the radio structure of the AGN. The highly collimated star formation is present only in the north eastern halo of the galaxy, suggesting the interaction of the jet with the gas clouds deposited during the last accretion event as the preferred triggering mechanism. From these observations we infer a lower limit for the age of the NGC 5128 jet of yr. The triggering of the star formation in the dense clouds in the halo of the galaxy by the jet supports the alignment effect observed in high redshift radio galaxies. It also suggests that radio galaxies should have higher than normal star formation rates.
1 Introduction
NGC 5128, the nearest giant elliptical galaxy (Israel, 1998), was associated with the strong radio source Centaurus A by Bolton et al. (1949). In the optical, the galaxy has an elliptical light distribution crossed in the center by a strong warped dust lane. The diffuse optical extensions were first discovered by Johnson (1963) and subsequently the rich system of shells around the elliptical galaxy was detected by Malin et al. (1983). Blanco et al. (1975) and Peterson et al. (1975) discovered the optical jet or filaments in NGC 5128. The origin and the nature of the emission-line filaments have been hotly debated (Dufour & van den Bergh, 1978; Graham & Price, 1981; Graham, 1983; Morganti et al., 1991; Sutherland et al., 1993; Morganti et al., 1999).
The origin of diffuse shells (Malin et al., 1983) can be explained with phase wrapping of stars from an accreted disk galaxy (Quinn, 1984). Rejkuba et al. (2001) discussed the stellar populations in the prominent diffuse north-eastern shell and in the halo of NGC 5128. The ‘outer filament’ situated at from the centre extends for in the direction of position angle (Blanco et al., 1975) overlaping partially with the diffuse stellar shell. While the stellar populations in the shell are similar to the rest of the halo of the giant elliptical, the stars close to the emission-line filament are predominantly young (see also Mould et al., 2000; Fassett & Graham, 2000).
The ‘inner filament’ is located at the distance of from the nucleus and extends outward over at a position angle (Blanco et al., 1975). It consists of three bright knots, identified as A, B and C by Blanco et al. (1975) and two more diffuse structures, E and F (Morganti et al., 1991). Here we report the detection of a young stellar population associated with the optical emission-line inner () and outer () filaments in the north-eastern halo of NGC 5128. Throughout the paper we adopt distance modulus to NGC 5128 of 27.8 (Soria et al., 1996; Harris et al., 1999) that corresponds to a distance Mpc. At this distance, on the sky translates to 1.047 kpc in the galaxy.
2 The Data
We used FORS1 at VLT Antu to image the outer field because it is less crowded and the filaments cover a larger area than in the inner field. On the contrary in the inner field Magellan I was necessary because despite of having a smaller area it gives higher resolution for the crowded field.
The field with the inner filaments (, ) was imaged with the Magellan I (Walter Baade) Telescope, one of the twin 6.5 m Magellan telescopes at Cerro Manqui at the Las Campanas Observatory. The observations were taken on 22 February 2001, during the first Chilean run on the new telescope and one of the first 10 nights of scientific operations. The instrument was the direct CCD camera Tektronix with gain of 2 . At the f/11 focus of Magellan I the pixel scale is /pixel with a total field size of . The small pixel scale and the extraordinary good and stable seeing of during the whole night enabled us to obtain well sampled point spread function (PSF) images with almost no crowding problems deep in the halo of NGC 5128. The observations consist of , and exposures in Harris -, - and -bands111The exact names of filters were LC-3012, LC-3014 and LC-3011. For the filter transmission curves see ., respectively. The color composite image of the field can be found at the following URL .
The standard stars from the Landolt (1992) catalogue in two different fields were observed at four different airmasses on 22 and 23 February 2001 with the identical instrumental setup. Additional photometric standards in these fields were defined by Stetson (2000) in the and bands, making the total number of useful standard stars observed 15, 50 and 48 in , and , respectively. The following calibration equations reproduce the calibrated magnitudes with one-sigma scatter around the mean of 0.08, 0.024 and 0.031 for , and the band, respectively.
| (1) | |||||
| (2) | |||||
| (3) | |||||
The observations of the field that contains outer filaments (, ) were carried out in the service mode with FORS1 instrument on the 8.2m ESO Very Large Telescope (VLT) Antu at Paranal, on July 11th and 12th 1999. They consist of pairs of 15-min optical (Bessel - and -band) exposures taken in photometric conditions with seeing ranging from to . The FORS1 detector has pixel scale of /pixel and the field of view . A detailed description of these data and their reduction is given in Rejkuba et al. (2001).
The photometric measurements of the outer filament images were described in Rejkuba et al. (2001, Field 1). The photometry in the inner filament field followed a similar procedure. The stars were identified on the median combined image with the FIND algorithm that is part of the DAOPHOT II programme (Stetson, 1987). The PSF magnitudes were measured on all individual frames simultaneously with ALLFRAME (Stetson, 1994). Restricting the PSF fitting parameters sharpness and chi we rejected bad pixels and extended objects like galaxies and globular clusters (Rejkuba, 2001) from the final photometry list. Only the stars with good photometry () in at least two images were kept. The final photometric catalogue of of the inner filament field contains 1612, 8003 and 7683 stars with good photometry in the , and bands, respectively.
3 The Color-Magnitude and Color-Color Diagrams
In Fig. 1 we compare the UV color-magnitude diagrams of the inner and outer filament fields. The much larger field of VLT than Magellan I and the more extended star formation region in the outer field accounts for higher number of blue stars with colors . In both fields there is a young blue main sequence extending to magnitudes of . We “cleaned” the CMDs from foreground contamination using the Besançon group model of stellar populations in the Galaxy (Robin & Creze, 1986; Robin et al., 1996). Some of the stars in the red part () of the CMD are most probably still the remaining Galactic foreground stars, but in that area of the CMD supergiants on their blue–red excursions are also located (see also Rejkuba et al. (2001)).
The width of the blue to red supergiant loops in the red part constrains the abundance, while the brightness of the main sequence stars constrains the age of the population. In order to determine an upper limit for the temperature and ionizing fluxes of the stars we assumed the age and abundance from the isochrone fitting. The best fit from the available set of Padova isochrones (Bertelli et al., 1994) is obtained for Z=0.004 and the log(age yr. The brightest stars in both fields are lying along the yr old isochrone. Assuming then that the brightest stars have Z=0.004 and log(age)=7.0-7.1 yr, the temperature of the most luminous stars is between and K.
The comparison with another halo field in the southern region of the galaxy (Field 2 in Rejkuba et al. (2001)) indicates that the young population is confined to the regions aligned with the optical filaments.
The (U-V) vs. (V-I) color-color diagram for all the stars in the inner filament field with photometric errors mag and magnitudes brighter than 50% completeness limits in all bands is presented in Fig. 2. The foreground stars have not been subtracted. They form the sequence that crosses the diagram from upper right towards lower left corner. The objects in the lower left part of the color-color diagram are young supergiants in NGC 5128. The spread is due to possible differential reddening and spread in ages of the young stars. Most galaxies have and (Rodighiero et al., 2000), so only few of them at higher redshift may contribute to the spread in the bluest part of the color-color diagram. The isolated point to the left of the stellar sequence at and is most probably a galaxy. Absence of other points with similar colors indicate a good selection criteria and low contamination by background galaxies in our stellar photometry.
The reddening value inferred from the isochrone fitting to the stellar sequence is in good agreement with the values from the literature (Schlegel et al., 1998; Fassett & Graham, 2000; Rejkuba et al., 2001). The width of the young blue sequence is somewhat larger in the inner than in the outer filament field. This may indicate the presence of the small differential reddening amounting at most to . However, a possible spread in ages of young stars and the photometric errors at fainter magnitudes complicate the interpretation.
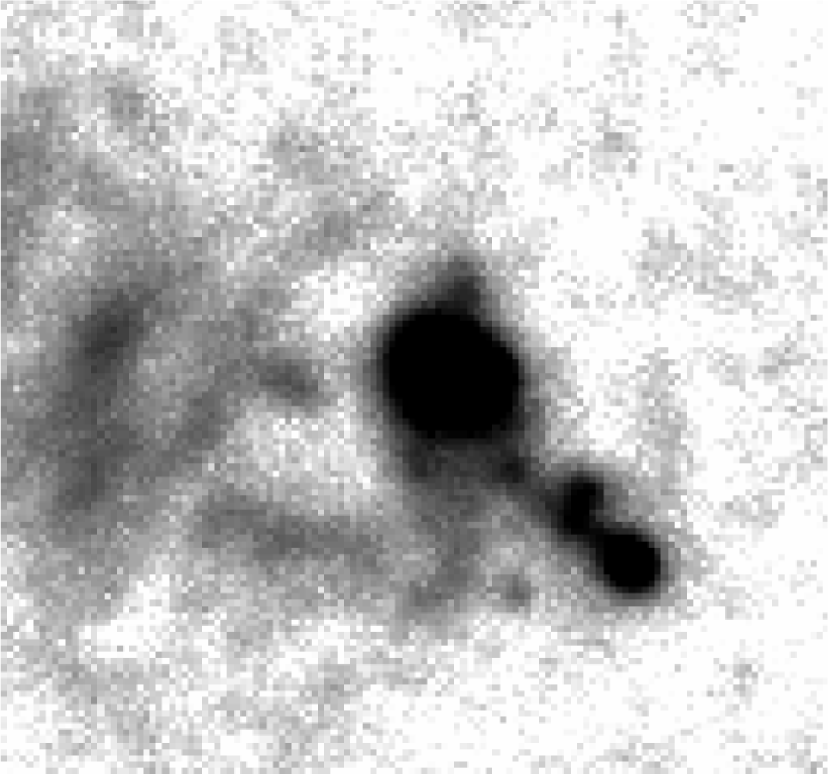
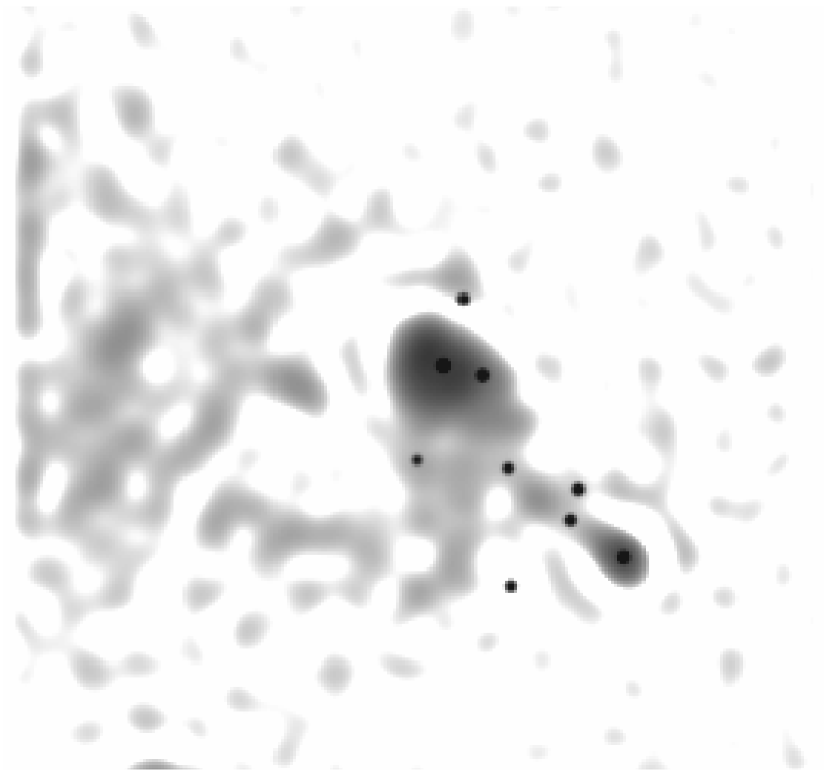
4 Knot A - Image deconvolution
The photometry of knot A (Blanco et al., 1975), a possible compact star forming region in the jet, required particular care. It consists of a mixture of stellar like objects, extended nebular emission and an unresolved background of faint stars. In order to estimate the relative contribution of these components to our photometry, we deconvolved a small portion of the Magellan I image of arcsec around the brightest hot spot using the MCS deconvolution algorithm (Magain et al., 1998). In this way we obtained a new image with improved spatial resolution (Fig. 3, top right) and a background map (or the “extended source channel”) containing the extended sources. The final pixel scale on the deconvolved image is and the resolution of point sources is .
In the MCS algorithm, one has to give as an input, initial estimated positions and intensities for all suspected point sources. The program then iteratively changes them while trying to deconvolve the data. The difference between the data and the deconvolved image (reconvolved back with the PSF) in units of the noise, is used to check the quality of the process, a posteriori. This difference image or residual map should be flat and equal to 1 everywhere in the field in case of perfect deconvolution. Since introducing a higher number of point sources in the image will always produce a better result, we deliberately choose the minimum number of point sources required for the deconvolution process to yield acceptable residual maps. Some faint stars in the deconvolved image are therefore present in the “extended source channel” of the data and we “see” fewer stars with the deconvolution process than with ALLFRAME. However, the stars we see are decontaminated from the extended underlying nebular emission and we can infer their magnitudes and colors with no contribution from the emission of the surrounding gas. The comparison between these new measurements and the photometry obtained with ALLFRAME (Fig. 3) indicates that the magnitudes and colors of blue stars measured with ALLFRAME are not excessively contaminated by line emission from the surrounding gas. In particular we show that knot A is composed of at least two point sources embedded in a more extended envelope, possible nebular emission or a very compact and still unresolved cluster. Other objects in the field do not show such extended emission apart from the compact object arcsec SW of knot A. The residual flux of knot A after star subtraction is erg/cm2/sec/Å.
5 Discussion
Many high-redshift radio galaxies show optical images elongated in the same direction as their double radio sources, the so called alignment effect (McCarthy et al., 1987; Chambers et al., 1987; De Breuck et al., 1999). The alignment has often been explained with models of star formation induced by shocks associated with the passage of radio components (Rees, 1989; Daly, 1990; Best et al., 1996), but in some cases scattering of nuclear light by dust or electrons and line-emission excited by the continuum from the obscured active nucleus are dominating optical and UV light (di Serego Alighieri et al., 1989; Dickson et al., 1995; Vernet et al., 2000). In NGC 5128 we can observe in more detail physical processes that are acting in these more distant galaxies.
The direct observations of young blue supergiants associated with the outer filaments were recently reported by several authors (Fassett & Graham, 2000; Mould et al., 2000; Rejkuba et al., 2001). Now for the first time we have resolved the young stars associated with the ionized filaments and knots in the inner part of the galaxy, and mapped these young stars over a large field along the radio jet. The remarkable alignment of the young stars and ionized gas over kpc is shown in Fig. 4 and 5. The red stars () are evenly distributed in both fields as expected for foreground galactic stars, while almost all recently formed stars lie along the knots and filaments of ionized gas. The north-south (vertical) alignment in the outer field is along the eastern edge of the H i cloud that is associated with the stellar shells (Schiminovich et al., 1994).
We checked the locations of all of the blue stars and in particular of the most luminous ones. In the outer field they are evenly distributed along the star forming region, while the four brightest blue stars in the inner field lie within a very small region, known as knot A (Blanco et al., 1975). Graham & Price (1981) found that the spectrum of the knot A shows characteristics of a normal H ii region and conclude that there must be hot stars embedded in that gas. We resolved here the brightest stars in that H ii region. The northern extension of knot A is distinguished by a higher excitation and electron temperature similar to what is observed in other knots and filaments in the inner and outer halo (Graham & Price, 1981; Morganti et al., 1991). The high excitation lines observed to be prominent in the filaments in the halo of NGC 5128 (e.g. He ii 4686 and high ratio of [Oiii] 5007/[Oii] 3727) show that the stars cannot be the only source of ionizing photons.
The complex velocity field of the filaments creates a puzzle. The spectroscopy of the ionized gas revealed a very wide range of velocities covering more than 550 km s-1 (Graham & Price, 1981; Graham, 1983; Morganti et al., 1991; Graham, 1998) and varying significantly on scales of pc. The mean velocity of the gas, around km s-1, is a few hundred km s-1 lower than the systemic velocity of the central region (Graham, 1979; Morganti et al., 1991; Graham, 1998), but is close to the measured velocity of the H I cloud that is located to the NW of the outer filaments (Schiminovich et al., 1994). If the stars shared the turbulent velocities of the gas, in yr they would travel kpc, which correspond to approx. at the distance of NGC 5128 (note that the field of view of Magellan is less than and that of VLT ). If they had these velocities, the gas and the stars would have been dispersed in the halo of the galaxy.
The large amount of the H i and CO gas (Schiminovich et al., 1994; Charmandaris, 2000) and its association with the diffuse stellar shells in the halo can be interpreted with the dynamical scenario of phase-wrapping, following the merger of a spiral galaxy with NGC 5128 approximately yr ago (Quinn, 1984; Charmandaris, 2000). The similar mean velocity of the H i cloud and the ionized gas in the filaments indicates the common origin of the gas. We detect here for the first time the young stars associated with the inner filaments. Their strong alignment with the line emitting filaments and with the radio and x-ray jet coming from the AGN nucleus of NGC 5128 suggests a connection between them and poses interesting questions like “Did the jet trigger the star formation?” or “Are the jets seen because of the star formation?” and “Would we see the jet if there were no blue stars there?”.
The answer to the first question is more complex and thus we address the others first. If we assume that the brightest stars have ages of Myr and metallicities of Z=0.004, then they have temperatures of K. The high excitation lines observed in the spectra of the ionized gas require ionization temperatures of the order of K. It is clear that an additional ionization mechanism is exciting the gas. The alignment of the ionized gas with the direction towards the nucleus of the galaxy and the fact that even though it is present, the gas in the other parts of the halo of NGC 5128 is not ionized, leaves as the most simple possibility either an interaction with the radio jet that leads to the shock excitation (Sutherland et al., 1993) or photoionization by the radiation field of a nuclear continuum source (Morganti et al., 1991, 1992). In any case, the “jet” of optical emission line features is not seen due to the star formation and it would most probably be visible even if the stars were not there.
The young stars formed after the collapse of the gas probably have the same origin as the H I and molecular clouds (Charmandaris, 2000). The presence of this cool gas, with K, is the necessary ingredient in the jet induced star formation models. In the model described by Rees (1989) the prime effect of the radio outburst in a galaxy would be to heat the surrounding medium and evacuate the radio lobe of thermal gas. However, it would not disturb the cool-phase clouds, which would then be triggered to collapse in the overpressured medium. So, the jet could have induced the collapse and the star formation without transferring to the stars the high turbulent velocities that are observed today in the gas. The star formation process driven by the external pressure may not be dissimilar from the one observed in the classical stellar associations, such as Orion. This means that one needs to find an alternative mechanism in order to explain the velocities of the gas that have been observed. One possibility is that supernova explosions induced shocks into the surrounding medium. However, the problem with this scenario is that the first generation of supernovae would explode some yr after the onset of the star formation. So, the gas would acquire the high velocities still million years ago and would have had plenty of time to disperse. It would have too low density and would probably not be visible any more. Thus either the first supernovae were not efficient enough to blow away all the gas or some new gas came from elsewhere. Also, the jet that triggered the star formation would have induced high velocities in the hot gas, which would then have plenty of time to disperse in the halo of the galaxy. The obvious source of the new gas is the close-by H I cloud that will continue to supply fresh material that can be ionized as long as it stays in the direction of the jet.
The inner and the outer filaments are not mutually aligned. Similarly the inner and the outer radio jets are misaligned. If we assume that the jet is precessing as suggested also by Haynes et al. (1983), it should have first hit the outer filament and precess in the eastward direction hitting later the inner filament field. The recent observations of the radio jet with VLBI (Tingay et al., 1998) and the x-ray jet with Chandra (Kraft et al., 2000) show close alignment with the inner filaments at the position angle of . Stars in the inner and the outer filament have the same ages to within our precision, of the order of yr. The distance between the inner and the outer filaments is , implying the projected precession rate of the the order of degrees per year. The presence of the large quantity of neutral gas towards the west of the outer filament implies that either the jet is precessing in a cone whose right edge does not pass the outer filaments on the west or that it is intermittent and started shining only yr ago.
Given the facts that the blue stars are aligned along the direction of the jet, that they have formed recently, that there is a lot of gas all over the halo of the galaxy (Schiminovich et al., 1994), but new stars are formed only where the jet passes across or close to that gas, we can conclude that the young stars observed in the filaments in the NE halo of NGC 5128 are result of the jet induced star formation. The optical emission from the gaseous filaments associated with those stars is mainly powered by the radiation field of the hidden nuclear continuum source (Morganti et al., 1991, 1992) or by the shock excitation due to the interaction of the radio jet with a dense cloud of material at the location of the filaments (Sutherland et al., 1993). If this cause-effect scenario is correct, we can put a lower limit to the age of the jet itself: it must have been acting for at least yr in order to form the stars observed.
6 Conclusions
We have used the direct camera at the Magellan I and FORS1 at Antu VLT to measure the stellar photometry in two fields in the halo of the giant elliptical galaxy NGC 5128. The fields were located at the position of the inner and outer optical filaments (Blanco et al., 1975). We detected the chain of blue stars aligned with the line-emitting filaments and with the radio jet. The main conclusions from this work are:
-
1.
We see young blue stars aligned with the jet over kpc.
-
2.
The young stars have ages of yr and their UV color-magnitude diagram is best fit with Padova isochrones (Bertelli et al., 1994) for abundance of Z=0.004.
- 3.
-
4.
The main excitation mechanism that ionizes the gas associated with the young stars is either beamed photoionization from the obscured AGN (Morganti et al., 1991, 1992) or shock ionization by the radio jet (Sutherland et al., 1993). The young stars with temperatures of the order of K contribute only a smaller part of ionizing photons.
-
5.
Our results support the alignment effect observed in high redshift radio galaxies, and suggest that radio galaxies should have higher than normal star formation rates.
-
6.
There is evidence for the jet to be processing from the outer to inner filament field eastward in the sky.
-
7.
We infer a lower limit for the age of the jet as yr.
References
- Bertelli et al. (1994) Bertelli, G., Bressan, A., Chiosi, C., Fagotto, F. & Nasi, E., 1994, A&AS, 106, 275
- Best et al. (1996) Best, P.N., Longair, M.S. & Röttgering, 1996, H.J.A., MNRAS, 280, L9
- Blanco et al. (1975) Blanco, V.M., Graham, J.A., Lasker, B.M. & Osmer, P.S., 1975, ApJ, 198, L63
- Bolton et al. (1949) Bolton, J.G., Stanley, G.J. & Slee, O.B., 1949, Nature, 164, 101
- Chambers et al. (1987) Chambers, K.C., Miley, G.K. & van Breugel, W., 1987, Nature, 329, 604
- Charmandaris (2000) Charmandaris, V., Combes, F. & van der Hulst, J.M., 2000, A&A, 356, L1
- Daly (1990) Daly, R.A., 1990, ApJ, 355, 416
- De Breuck et al. (1999) De Breuck, C., van Breugel, W., Minniti, D. et al., 1999, A&A, 352, L51
- di Serego Alighieri et al. (1989) di Serego Alighieri, S., Fosbury, R.A.E., Tadhunter, C.N. & Quinn, P.J., 1989, Nature, 341, 307
- Dickson et al. (1995) Dickson, R., Tadhunter, C., Shaw, M., Clark, N., & Morganti, R., 1995, MNRAS, 273, L29
- Dufour & van den Bergh (1978) Dufour, R.J. & van den Bergh, S., 1978, ApJ, 226, L73
- Fassett & Graham (2000) Fassett, C.I. & Graham, J.A., 2000, ApJ, 538, 594
- Graham (1998) Graham, J.A., 1998, ApJ, 502, 245
- Graham (1983) Graham, J.A., 1983, ApJ, 269, 440
- Graham (1979) Graham, J.A., 1979, ApJ, 232, 60
- Graham & Price (1981) Graham, J.A. & Price, R.M., 1981, ApJ, 247, 813
- Harris et al. (1999) Harris, G.L.H., Harris, W.E. & Poole, G.B., 1999, AJ, 117, 855
- Haynes et al. (1983) Haynes, R.F., Cannon, R.D. & Ekers, R.D., 1983, PASAu, 5, 241
- Israel (1998) Israel, F.P., 1998, A&AR 8, 237
- Johnson (1963) Johnson, H.M., 1963, AJ, 68, 76
- Kraft et al. (2000) Kraft, R.P., Forman, W., Jones C. et al., 2000, ApJ, 531, L9
- Landolt (1992) Landolt, A.U., 1992, AJ 104, 340
- Magain et al. (1998) Magain, P., Courbin, F. & Sohy, S., 1998 ApJ 494, 472
- Malin et al. (1983) Malin, D.F., Quinn, P.J. & Graham, J.A., 1983, ApJ 272, L5
- McCarthy et al. (1987) McCarthy, P.J., van Breugel, W., Spinrad, H. & Djorgovski, S., 1987, ApJ, 321, L29
- Morganti et al. (1999) Morganti, R., Killeen, N.E.B., Ekers, R.D. & Oosterloo, T.A., 1999, MNRAS, 307, 750
- Morganti et al. (1992) Morganti, R., Fosbury, R.A.E., Hook, R.N., Robinson, A. & Tsvetanov, Z., 1992, MNRAS, 256, 1P
- Morganti et al. (1991) Morganti, R., Robinson, A., Fosbury, R.A.E., di Serego Alighieri, S., Tadhunter, C.N. & Malin, D.F., 1991, MNRAS, 249, 91
- Mould et al. (2000) Mould, J.R., Ridgewell, A., Gallagher, J.S. III et al., 2000, ApJ, 536, 266
- Peterson et al. (1975) Peterson, B.A, Dickens, R.J. & Cannon, R.D., 1975, Proc. Astron. Soc. Aust., 2, p. 366
- Quinn (1984) Quinn, P.J., 1984, ApJ, 279, 596
- Rees (1989) Rees, M.J., 1989, MNRAS, 239, 1P
- Rejkuba (2001) Rejkuba, M., 2001, A&A, 369, 812
- Rejkuba et al. (2001) Rejkuba, M., Minniti, D., Silva, D.R. & Bedding, T., 2001, A&A, submitted
- Robin & Creze (1986) Robin, A. & Creze, M., 1986, A&A, 157, 71
- Robin et al. (1996) Robin, A.C., Haywood, M., Creze, M., Ojha, D.K. & Bienayme, O., 1996, A&A, 305, 125
- Rodighiero et al. (2000) Rodighiero, G., Granato, G.L., Franceschini, A., Fasano, G. & Silva, L., 2000, A&A, 364, 517
- Schlegel et al. (1998) Schlegel, D.J., Finkbeiner, D.P. & Davis, M., 1998, ApJ, 500, 525
- Schiminovich et al. (1994) Schiminovich, D., van Gorkom, J.H., van der Hulst, J.M. & Kasow, S., 1994, ApJ 423, L101
- Soria et al. (1996) Soria, R., Mould, J.R., Watson, A.M., et al., 1996, ApJ 465, 79
- Sutherland et al. (1993) Sutherland, R.S., Bicknell, G.V. & Dopita M.A., 1993, ApJ, 414, 510
- Stetson (2000) Stetson, P.B., 2000, PASP, 112, 925
- Stetson (1994) Stetson, P.B., 1994, PASP, 106, 250
- Stetson (1987) Stetson, P.B., 1987, PASP, 99, 191
- Tingay et al. (1998) Tingay, S.J., Jauncey, D.L., Reynolds, J.E. et al., 1998, AJ, 115, 960
- Vernet et al. (2000) Vernet, J., Fosbury, R.A.E., Villar-Martín, M. et al., 2001, A&A, 366, 7