Optical/Near-Infrared Imaging of Infrared-Excess Palomar-Green QSOs
Abstract
Ground-based high spatial-resolution (FWHM 0.3–0.8″) optical and near-infrared imaging (0.4—2.2 m) is presented for a complete sample of optically selected Palomar-Green QSOs with far-infrared excesses at least as great as those of “warm” AGN-like ultraluminous infrared galaxies (Lir/L). In all cases, the host galaxies of the QSOs were detected and most have discernable two-dimensional structure. The QSO host galaxies and the QSO nuclei are similar in magnitude at H-band. H-band luminosities of the hosts range from 0.5-7.5 L∗ with a mean of 2.3 L∗, and are consistent with those found in ULIGs. Both the QSO nuclei and the host galaxies have near-infrared excesses, which may be the result of dust associated with the nucleus and of recent dusty star formation in the host. These results suggest that some, but not all, optically-selected QSOs may have evolved from an infrared-active state triggered by the merger of two similarly-sized L∗ galaxies, in a manner similar to that of the ultraluminous infrared galaxies.
To appear in the December, 2001 Astronomical Journal
1 Introduction
Many galaxies (e.g., Seyfert galaxies, radio galaxies) have forms of abnormally energetic behavior lumped under the general heading of active galactic nuclei (AGN). IRAS discovered a new class of these AGN: galaxies that had QSO-like bolometric luminosities (L 1012 L☉) yet which emit nearly all of this luminosity at far-infrared wavelengths. Nearly all of these galaxies show evidence for merger activity along with optical line ratios similar to that of other AGN (Sanders et al. 1988a, Murphy et al. 1996, Veilleux et al. 1999). Tying together the theoretical framework for merger-induced fueling (Toomre & Toomre 1972, Barnes & Hernquist 1996) and the known merger structure around some QSOs (Stockton & MacKenty 1987, Hutchings et al. 1995) along with an evolutionary timeline, Sanders et al. (1988b) proposed that these so-called ultraluminous infrared galaxies (ULIGs) were the immediate progenitors of optically selected QSOs, and that ULIGs represented an evolutionary stage where the QSO nuclei were enshrouded in gas and dust. This dust shroud reradiates the nuclear emission at far-infrared wavelengths; eventually, powerful winds (Heckman et al. 1990) disperse the dust and reveal an optical QSO nucleus.
Surace & Sanders (1998, 1999, 2000b; hereafter called Papers I, II, and IV), Surace et al. (2000a; hereafter called Paper III), and Scoville et al. (2000) explored the morphology and colors of the circumnuclear and extended environments of ULIGs at optical and near-infrared wavelengths. They demonstrated that the emission at optical and near-ultraviolet wavelengths from ULIGs is dominated by an extended starburst many kpc in size. A compact core, however, dominates at near-infrared wavelengths. This result was dramatically confirmed at mid-IR wavelengths by Soifer et al. (2000) and thus directly demonstrated that the bolometric luminosity arises in very small region. If QSOs are relic ULIGs, then their host galaxies should provide evidence for the aged remnants of the structures found in ULIGs: faded extended tidal tails and debris, and aged star- forming knots from a tidally-triggered starburst.
At the same time, considerable advances were made in imaging studies of QSO host galaxies. Ground-based studies using high resolution techniques clearly revealed the host galaxies of many QSOs (Dunlop et al. 1993, McLeod & Rieke 1994ab) and in some cases the observed morphologies could be attributed to interactions (e.g. Hutchings & Neff 1992). More recent results have been obtained using the high spatial resolution of HST. McLure et al. (1999) have shown that the majority of high luminosity quasars (both radio-loud and radio-quiet) lie in elliptical hosts, while lower luminosity systems (primarily radio-quiet) lie in a wider variety of hosts. This is in contrast to earlier studies, which had difficulties detecting the hosts of QSOs (e.g. Bahcall et al. 1995).
By observing a complete sample of QSOs with bolometric and infrared luminosities similar to those of ULIGs and using the same instruments and techniques as Papers I—IV, the question of the relationship between the structure of the QSO host galaxies and ULIGs can be investigated. The development of high quantum efficiency, large format detectors spanning the wavelength range from the near-ultraviolet (3000Å) to the near-infrared (2.2µm) enable detailed studies over a wide range of wavelengths dominated by different emission processes. The advent of adaptive optics techniques coupled with superior ground-based sites also enable imaging with much higher spatial resolution than ever before possible, simplifying detection of QSO host galaxies and any compact features within them.
A general feature of the ULIG—QSO evolutionary scenario is that the spectral energy distributions (SEDs) must evolve from a state dominated by far- infrared emission (ULIGs) to a state where optical/ultraviolet emission becomes a strong, if not dominant component of the SED. The previous studies of ULIGs by Surace et al. (Papers I-IV) concentrated on samples of “cool” ULIGs ()111The quantities , , , and represent the IRAS flux densities in Jy at 12 µm, 25 µm, 60 µm, and 100 µm respectively., the least evolved with the most far-infrared dominated SEDs, and “warm” ULIGs () which have a stronger relative optical/ultraviolet component. The “youngest” QSOs (i.e. those closest to the ULIG evolutionary state) must be those that have the greatest far- infrared component to their SEDs. Selection of such “infrared-excess” QSOs should therefore select the most ULIG-like systems.
We report the results of an imaging survey at B, I, H, and K′ of a complete sample of low redshift (z 0.16) QSOs selected from the Palomar-Green Bright Quasar Survey (Schmidt & Green 1983) on the basis of having an infrared-excess greater than the least IR-excess “warm” ULIGs and which therefore, within the context of the evolutionary scenario, should be the youngest examples of QSOs. Their morphologies, luminosities, and colors are compared to those of the ULIGs (Papers I—III), and the implications for the ULIG-QSO evolutionary scenario are discussed.
2 Data
2.1 Sample Selection
The sample is drawn from all Palomar-Green ( PG; Schmidt & Green 1983) Bright Quasar Sample QSOs with redshifts z0.16, thus placing them in the same space volume as the “cool” and “warm” ULIG samples examined in Papers I & III. This is important because the interpretation of galaxy morphology often depends on the achieved physical spatial resolution. For example, the large “knots” in NGC 4038/9 (The Antennae Galaxy) seen from the ground are revealed by HST to be composed of smaller subclumps of star forming clusters (Whitmore & Schwiezer 1995). By examining a sample with the same techniques used in Paper III and at the same distance, the morphologies of the host galaxies are likely to be interpreted in a similar fashion. Additionally, the low redshift of the sample has the obvious advantage that as the closest examples of their population they are the most amenable to detailed study.
As described above, in order to find transition objects which bridge the gap between “warm” ULIGs and the general QSO population an infrared selection criterion was imposed. The ratio Lir/LBBB222(8—1000 was computed using the flux in all four IRAS bands according to the prescription given in Perault (1987). LBBB was computed from the “Big Blue Bump” luminosity at 3200–8400Å and the photometry of Sanders et al. (1989) was used to find QSOs with “excess” far-IR emission. The quantities Lir and LBBB were computed from the data given by Sanders et al. (1989). The warm ULIG with the lowest such value is 3C273, which has Lir/L 0.46. Only PG QSOs with Lir/L 0.46 were selected. The distributions of Lir/LBBB for the QSO sample and the ULIG samples are not the same, nor could they be, given that ULIGs by definition almost always have very high Lir/LBBB. Instead, they have the same lower bound. This criterion was only used to search for “red” QSOs which might have significant dust content and hence be more evolved versions of ULIGs. All three samples do have the same redshift distribution (Paper III).
Ideally, the QSOs would also have the same distribution of bolometric luminosities as ULIGs since it is hypothesized that the infrared luminosity in ULIGs is QSO- driven. In practice this is difficult to achieve. Besides being well- studied, the PG QSO sample was the only one at the time of this project with well-characterized far-IR emission. The PG BQS has too few objects meeting both our redshift and infrared color criterion to allow the construction of a meaningfully large sample with the same bolometric luminosity distribution as the ULIGs. Future studies could avoid this problem by using other infrared QSO surveys, such as those undertaken by ISO (Hooper et al. 1999) or SIRTF. Therefore, the QSO sample was selected instead to meet the same minimum bolometric luminosity criterion for ULIGs (LL⊙). The bolometric luminosity was determined in two ways. First, Lbol was estimated from Lbol = 16.5 where LB is the luminosity at B-band, which is the average bolometric correction found for PG QSOs by Sanders et al. (1989), although more recent estimates of this correction factor indicate a value of 11.7. Under the former definition the luminosity Lbol=1012 L⊙corresponds to MB=-22.18. Papers identifying ULIGs have principally used a different cosmology than Schmidt & Green (e.g. H0=75 km s-1 Mpc -1 vs. 50 km s-1 Mpc -1), adjusting for this implies that QSOs have M -23, similar to the definition found in that paper. Second, where possible Lbol was determined directly from the data of Sanders et al. (1989). Since Lbol for UGC 5101 is slightly below 1012L⊙, the range in bolometric luminosities was allowed to drop to Log Lbol=11.92. Two objects in our sample (PG 1126-041 and PG 1229+204) were included because of this.
There are 17 infrared-excess PG QSOs, out of a total of 36 candidates meeting the redshift and bolometric luminosity criterion. However, 3 of these (I Zw 1, Mrk 1014, and 3c273) are also “warm” ULIGs and have already been discussed in detail in Papers I and II. One additional object was observed (PG 1119+120). Although originally in our sample, a re-evaluation of its bolometric luminosity showed that it fell substantially short of our luminosity criterion, even though it has historically been considered a QSO (Neugebauer & Matthews 1999, Rowan- Robinson 1995). The data for this object are presented, but not used in the following discussion. Table 1 presents the complete sample list, along with measured values of Lir/LBBB and Lbol. Note that the table presents new values for these quantities derived from the new photometry presented in this paper and our current understanding of the relationship between bolometric luminosity and the luminosity at specific wavelengths, not the photometry originally used to select the sample.
2.2 Observations and Reduction
The optical data were taken at the f/31 focus of the University of Hawaii 2.2m telescope using a fast tip/tilt guider in the manner described in Papers II & III. B & I-band data were acquired using the Tektronix 2048 and Orbit 2048 cameras between May 1996 and December 1997. In most cases this was by direct imaging at the f/31 Cassegrain focus. The data were binned on chip 2x2, with pixel scales of 0.14 and 0.09″, respectively. In a few cases the data were obtained by reimaging the f/31 beam at f/10 through the HARIS spectrograph using the Orbit 2048 camera with a pixel scale of 0.14″. While the fast tip/tilt guider does not appreciably correct atmospheric seeing at optical wavelengths, it can eliminate common-mode vibrations such as wind shake which contribute appreciably to image degradation. Typical spatial resolutions varied between 0.4—0.9″at I-band, and with B-band being substantially worse by as much as factor of 2. Total exposure times varied between 12 and 54 minutes per filter per target. Individual exposure times were short enough to prevent saturation of the QSO nucleus. In some cases the Cassegrain focus was rotated in order to improve offset guidestar acquisition, in which case additional flat-field images were taken at the appropriate rotations.
The optical data reduction involved several steps. First, the CCD bias pattern was removed by subtracting from each image a high S/N median bias frame constructed from sequences of 20-30 bias frames at the beginning and end of each night. Pixel-to-pixel response variations were corrected by dividing each image by a high S/N flat produced by making dithered observations of the twilight sky in each filter. Typical twilight exposures were 2-3 seconds each; short enough to avoid getting detectable flux from field stars, yet long enough to avoid flat-field errors introduced by the radial shutter used at the UH 2.2m. Estimated S/N for the flats (based on Poisson statistics and the gain of the CCD) was between 250-500. Neither CCD showed any evidence of measurable dark current, based on an examination of long closed shutter exposures. The images were corrected to normal orientation by transposition and rotation using the ROTATE task in IRAF based on the known field rotation of the Cassegrain focus of the UH 2.2m, which is accurate to better than 1 degree. The CCD overscan regions were trimmed using IMCOPY. The images were then aligned using IMALIGN task, which uses a marginal centroiding routine that calculates a best fit solution to a number of (user-supplied) reference stars in the field. Typical alignment errors were estimated (on the basis of the fit) to be about 0.25 pixels. The data were typically sampled at 5 pixels FWHM for a point source so alignment errors are unlikely to be important. The images were then averaged using an algorithm that rejects pixels inconsistent with the known noise properties of the CCD thus rejecting cosmic rays. The shifted images were combined onto a larger image than the original data frames thereby increasing the total field of view due to the dithering process. This was valuable in order to increase the availability of PSF stars since the camera field of view was much larger than the measurable extent of any of the galaxies.
The near-infrared H & K′ data were acquired between August 1996 and January 1998 with the QUIRC 10242 HgCdTe camera (Hodapp et al. 1996) at the UH 2.2m using the f/31 Cassegrain focus and the tip/tilt guider. At this focus the plate scale is 0.06 ″pixel-1. The K′ filter was chosen due to its lower thermal background and hence greater sensitivity (Wainscoat & Cowie 1992). Throughout this paper we exclusively refer to K′ . Comparison to work by other authors is made using the conversion of Wainscoat & Cowie (1992) from UH K′ to CIT K. In all cases exposure times were short enough (60–240 seconds) to prevent saturation of the QSO nucleus, thus allowing PSF subtraction during post-processing. Typical achieved spatial resolution using tip/tilt was 0.25—0.5″. Total exposure times varied from 9 to 45 minutes per filter. Details of the new observations presented in this paper are given in Table 1. Readers should note that the tabulated values of Lir/LBBB reflect updated values based on the new photometry presented here, and not those used for the initial sample selection. These new values reflect changes primarily in the optical properties of the QSOs and also a refined model for the QSO SED, and mostly affect PG 0007+106 and PG 1351+640.
The near-infrared data were reduced in the same manner as that described in Paper II. The data was initially sky-subtracted using consecutive, dithered frames; because the QUIRC field of view is so large (32″), it was possible to dither the target on-chip, thereby increasing telescope efficiency by a factor of 2. Responsivity variations were removed using median flats constructed from images of the illuminated dome interior. Each image was masked by hand to exclude bad pixels and regions contaminated by negative emission introduced by the sky subtraction. Images were aligned using the method described above for the optical data. Images were scaled according to their exposure times and then, in order to account for any variable sky background, an offset was subtracted from each image based on the background actually measured in that frame. The images were then combined by medianing using IMCOMBINE and rejecting pixels outside the linear repsonse of the array.
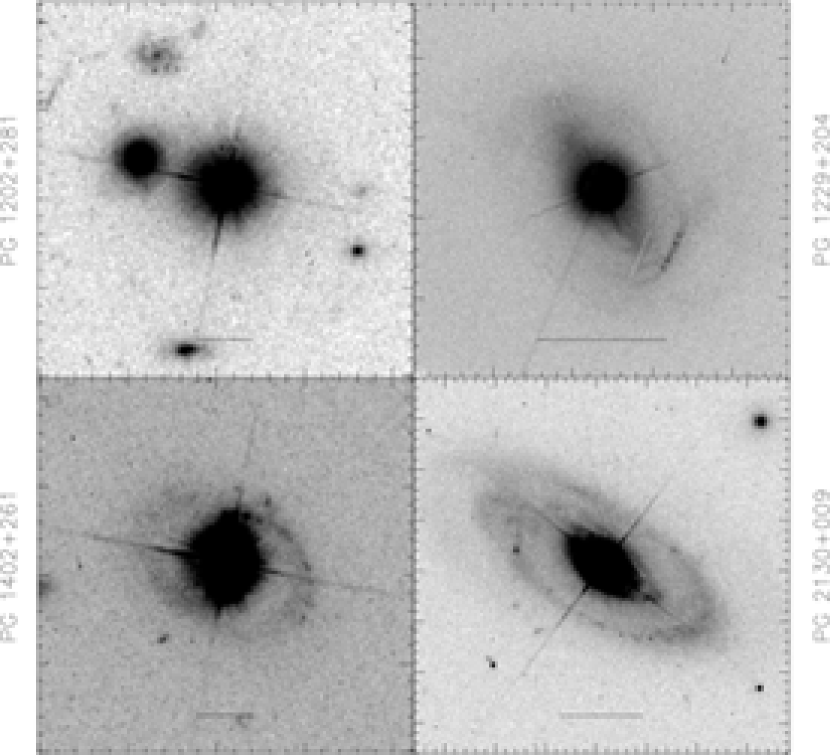
One QSO, PG 1202+281, could not be observed as there were no guide stars sufficiently bright (m 13) and nearby ( radial distance 5′) to enable the use of the tip/tilt guider. This QSO was, however, observed by HST/WFPC2. Several other QSOs (PG 1229+204, PG 1402+261, and PG 2130+099) have also been observed with HST/WFPC2 as part of other observing programs (Hutchings & Morris 1995, Bahcall et al. 1997), and were available from the STScI data archive. The WFPC2 images were taken through the F606W and F702W filters, which correspond roughly to V and R- band and are therefore not directly comparable to our data. They are, however, valuable for interpreting morphology that is only marginally resolved from the ground. This data was reduced in the same manner as described by Surace et al. (1998); i.e., by shifting and rotating according to the astrometric solution provided by STScI, and combined using the GCOMBINE task in IRAF/STSDAS, with cosmic ray-rejection. Residual glitches were interpolated by hand using IMEDIT. The three QSOs which are also warm ULIGs (I Zw 1, Mrk 1014, and 3c273) have also been observed with HST (Paper I, Bahcall et al. 1995); since these data are similarly analyzed elsewhere in the literature, they are not presented here.
The ground-based data were flux calibrated using observations of Landolt (1983, 1992) optical standards and Elias (1982) infrared standard stars. In most cases the nights were photometric with 0.05. For data taken on non-photometric nights, the data were calibrated using large fixed-aperture photometry already in the literature for the targets. Specifically, the near-infrared data for PG 0007+106 and PG 1001+054 were calibrated using the photometry given by Neugebauer et al. (1987) and the magnitude zeropoints contained therein. Optical data for PG 1119+120, PG 1440+356, PG 1613+290, and PG 2130+099 were calibrated using the photometry of Neugebauer et al. (1987) and the magnitude zeropoints of Bessel (1979). Photometric calibration errors are 0.03 magnitudes.
The point-spread-function (PSF) was calibrated from stars in the final combined science images using DAOPHOT as described in Paper II. The stars were identified, scaled, shifted, and combined using a sigma-clipping algorithm and weighted according to total stellar flux, thus creating as high a S/N PSF image as possible. In those few cases where no stars were found in the science images, the PSF was estimated by using the closest temporally adjacent PSF. Since the tip/tilt guiding has little effect on atmospheric distortions at short wavelengths, this works well for optical data. Similarly, since the seeing remains stable on timescales of many minutes, this is also effective in the near-infrared.
The integrated photometry was derived by measuring the total flux of the QSO/host system in an aperture large enough to encompass the optical extent of the galaxy at a flux level below 1 . Measurement errors from this technique are small and are dominated by the photometric calibration errors. The host galaxy luminosity was then derived by subtracting the contribution of the QSO nucleus and any high surface brightness features (e.g., star forming knots). As in Paper II, the luminosity of the QSO nucleus was determined in two ways: measuring the flux in a fixed 2.5 kpc radius aperture and then correcting this with an aperture correction derived from the observed PSF, and also by subtracting the observed PSF scaled to the nuclear luminosity such that a smooth host galaxy flux distribution without holes resulted. Generally, these results were the same to within 10%. This is not surprising since the surface brightness of the QSO nucleus is much higher than that of the underlying galaxy and small aperture photometry will mostly be sensitive to the QSO nucleus since the underlying host contributes only a small fraction of the total flux inside the aperture. The uncertainties in the host and nuclear luminosities are dominated by the measurement process and are 0.12 magnitudes.
Isophotal profiles were determined using the IRAF.STSDAS routine ELLIPSE. This routine builds elliptical isophotal models using an iterative technique. For the radial profiles the center and position angle were held fixed. For a discussion of how these profiles were computed when searching for bars, see §3.1.1.
3 Results
3.1 Morphology
3.1.1 Large-Scale Features
Host galaxies (as evidenced by extended emission beyond that expected for a point source) were detected around every QSO observed. Figure 1 presents the large-scale morphology of the IR-excess QSOs (except I Zw 1, Mrk 1014, PG 1202+281, and 3c273) at all four observed wavelengths. In each case the images have been stretched in an attempt to emphasize the faint structure in the host galaxies. Figure 2 presents near-truecolor images for every QSO including I Zw 1 and Mrk 1014 for completeness but excluding PG 1202+281 and 3c273 (we have no multicolor optical data for these two objects). These images are the most intuitive to understand and hence the most instructive for the following discussion (Surace et al. 2000a). Figure 3 presents HST data for several objects in our sample, and is useful for comparison with Figure 1.
These figures are provided as JPGs.

Radial profiles are presented in Figure 4. These profiles are the mean surface brightness at a given radius at H-band. Many studies of galaxy types have employed radial profile fitting, but at optical wavelengths. This is problematic for examining QSO hosts due to contamination of the radial profile by the nuclear PSF. Therefore, we present radial profiles at H-band, where the spatial resolution is typically 3 higher than at B-band. Most of the galaxies are extended with radii of 8—15 kpc. No attempt is made to classify the host galaxies as strictly spiral or elliptical-like based solely on their radial profiles. The interpretation of radial profiles is fairly ambiguous when only the outer profile is well-defined (Surace & Sanders 2000). The differences between the de Vaucoleurs profile and the exponential disk profile are most unambiguous at small radii. However, the surface brightness distribution at small radii is dominated by the QSO nucleus, and incomplete knowledge of the PSF prevents the recovery of sufficient information about the host at these radii. Also, the merger scenario that is examined here is believed to transform spiral galaxies into post-merger systems that strongly resemble ellipticals, and hence transition objects could appear similar to either type, or neither. Instead, we consider the operative definition that elliptical galaxies have predominantly smooth surface brightness distributions. High surface brightness, high spatial frequency non-radially symmetric structure (such as spiral arms) are the surest sign that a host is not an elliptical galaxy. Other approaches which derive models from the data which can then be classified neccessarily ignore the presence of complex two- dimensional structure, which is the spatial component of greatest interest to us. It is unclear whether our profiles resemble more closely disks or a de Vaucoleur’s profile. In any case, since H- band is dominated by the old stellar population, it is likely that any spiral profiles are strongly influenced by the presence of central bulges, further blurring interpretation.
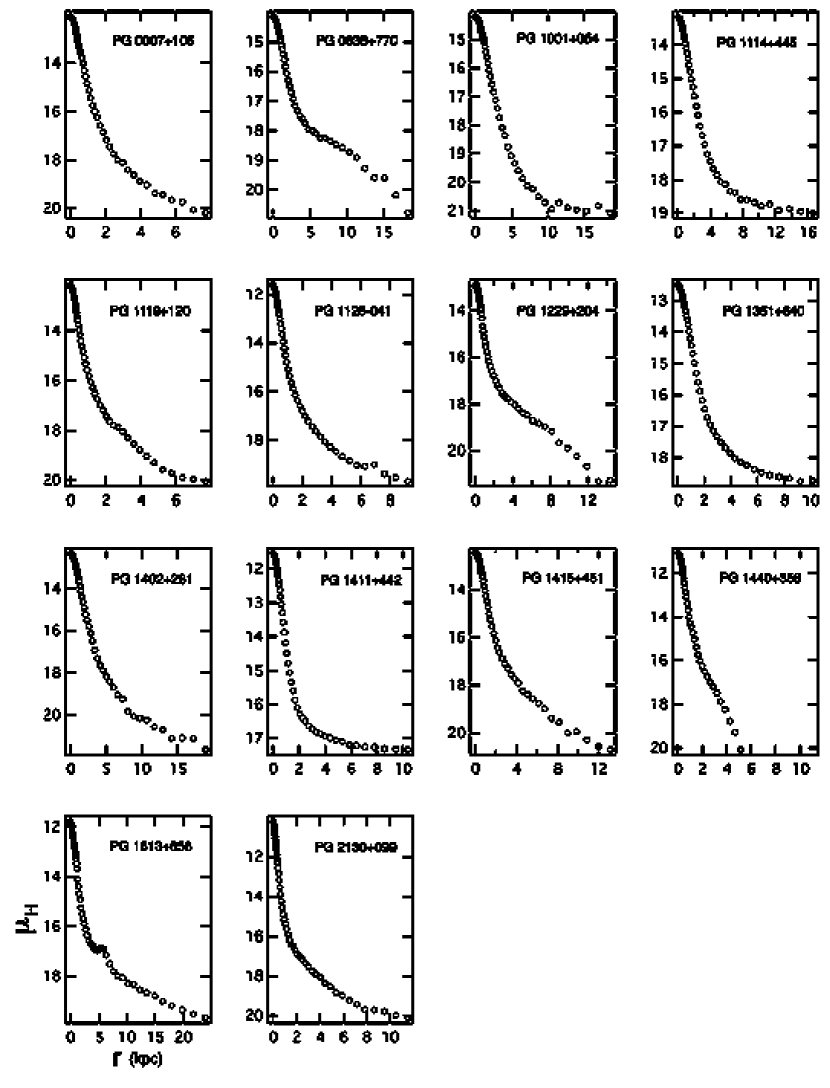
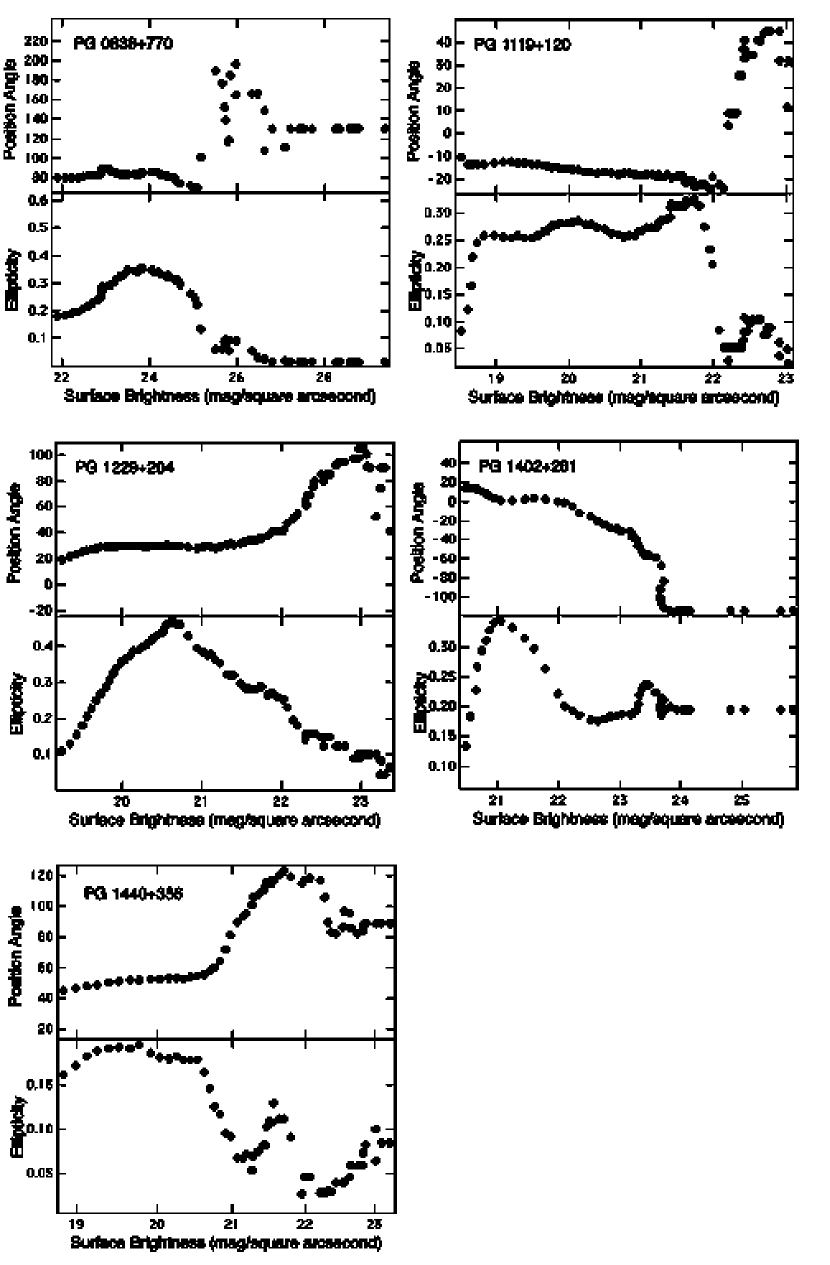
Of the 17 QSOs, 8 are in spiral-like galaxies based on the presence of spiral arms or rings and bars. Four of these hosts have weak nuclear bars whose major axes have radii ranging from 5 to 11 kpc. The presence of bars (beyond qualitative morphology) was determined using the criteria of Knapen et al. (2000). A galaxy is considered barred if it has a significant rise in ellipticity, followed by a corresponding decrease, or a change in semi-major axis position angle of greater than 75°. Figure 5 shows the radial profiles of the four QSO hosts, as well as PG 1119+120, that meet these criteria and which do not have obvious tidal tails consistent with the galaxy being a major merger. The ellipticity of the inner isophotes relative to the nearly radial symmetric outer isophotes is most clearly seen in Figure 1. The bars have mean projected peak ellipticities of 0.36, where the ellipticity is defined as
| (1) |
where b and a are the semi-minor and semi-major axes, respectively. The deprojected mean peak ellipticity is 0.43.
Two galaxies are known to be ellipticals: 3c273 and PG 1202+281 (Bahcall et al. 1997). McLeod et al. (1994b) claim a detection for a host galaxy in the latter but give no information on spatial structure. The remainder (PG 1001+054, PG 1351+640, & PG 1415+451) are indeterminate and lack any obvious structure in their extended emission. These three indeterminate cases also have very high nuclear luminosity fractions, thus making them hard to classify. An additional four host galaxies (PG 0007+106, PG 0157+001, PG 1411+442, and PG 1613+658) have prominent tidal tails and arms and are unmistakably recent merger systems. Thus, at least 24% (4/17) of the far- infrared excess PG QSOs occur in merger systems. Moreover, Hutchings et al. (1992,1994,1995) classified PG 1229+204 as a merger involving a small companion resulting in the observed bar and ring structures. Hutchings & Neff (1992) also propose that PG 2130+099 may also be in a post- interaction state, although it is not clear if it’s disturbed morphology necessarily implies merger activity. Our morphologies generally agree well with existing published data (Hutchings & Neff 1992, Dunlop et al. 1993, McLeod et al. 1994ab) .
3.1.2 Star-Forming Knots
Compact high surface brightness emission regions are detected in 35% (6/17) of the QSO hosts. In particular, “knots”333“knots” are defined as closed isophotes less than 1 arcsecond in radius and 3 above the surrounding emission. of star formation like those found in the ULIGs (Surace et al. 1998,1999) are detected in PG0007+106, I Zw 1, Mrk 1014, PG 1229+204, PG 1411+442 and PG 1613+658.
Figure 6 shows the small-scale structure, enhanced by a variety of techniques. The optical data for I Zw 1 and Mrk 1014 appear in Figure 2, while the near-infrared data appear in Paper II. In most cases the observed PSF had insufficient S/N to be used for a high quality point source subtraction and so a noiseless model of the QSO nucleus was used instead. In Figure 6 radial profile models have been fit to the QSO nuclei using the ELLIPSE and BMODEL routines in IRAF/STSDAS. The models were forced to be circular, with centers fixed on the QSO nuclei. They were then subtracted from the raw data, leaving only the non-radially symmetric component of the QSO host galaxy behind. In several cases a modified version of this technique was used. Radial profile models were fit using the JIP imaging package in a manner similar to that above; only in this case the fitting region for the radial models was restricted to specific position angles, allowing exclusion of obvious structure such as stars. This results in a more accurate model which has less tendency to oversubtract from the host galaxy. Even with this technique, structure within a radius of 1–2″(2–4 kpc) of the nucleus generally cannot be recovered at optical wavelengths due to confusion with subtraction artifacts arising due to pixel aliasing. While the observed spatial resolution is generally mugh higher in the infrared, the host galaxies have much less structure at these wavelengths.
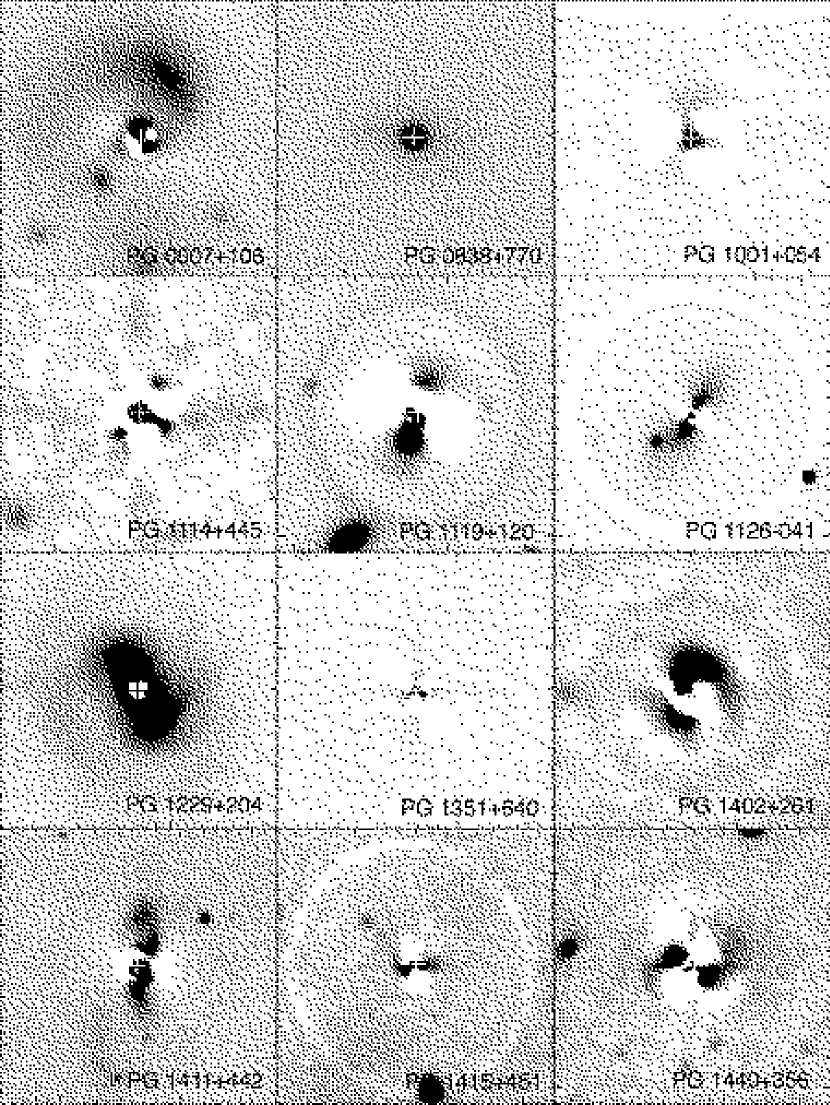
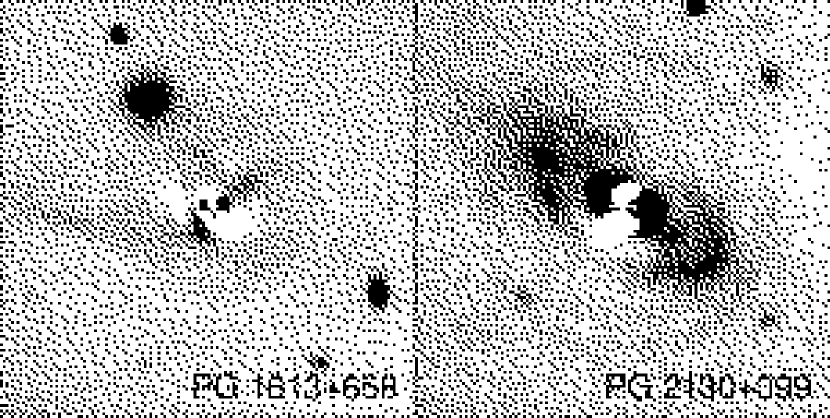
The nuclear subtracted image of PG 0007+106 clearly shows an arc or tidal tail similar to that in Mrk 231. The structure in PG 1119+120 is clearly seen in Figure 1. The nuclear-subtracted image of PG 1229+204 shows the galactic bar, as well as the condensations both in the bar and near its ends. The data for PG 1411+442 show a north-south structure extending on both sides of the nucleus. Since the northern extension seems to be the base of the tidal tail, it is possible the southern structure is actually the base of a fainter counter-tail. There are many bright condensations or knots in the northern tail itself. Additionally, there is a bright knot-like (or possibly jet-like) feature to the southwest. The image of PG 1613+658 shows the long tidal tail to the east and what appears to be a counter-tail extending west. To the northeast is the bright nuclear knot described by Hutchings & Neff (1992). Additionally, there is a less luminous high surface brightness region to the southwest. Finally, the image of PG 2310+099 clearly shows the spiral structure apparent in the much higher resolution HST image.
3.2 Luminosities
Table 2 lists BIHK′ integrated photometry for all of the QSOs as well as nuclear and host galaxy luminosities and nuclear fractions.
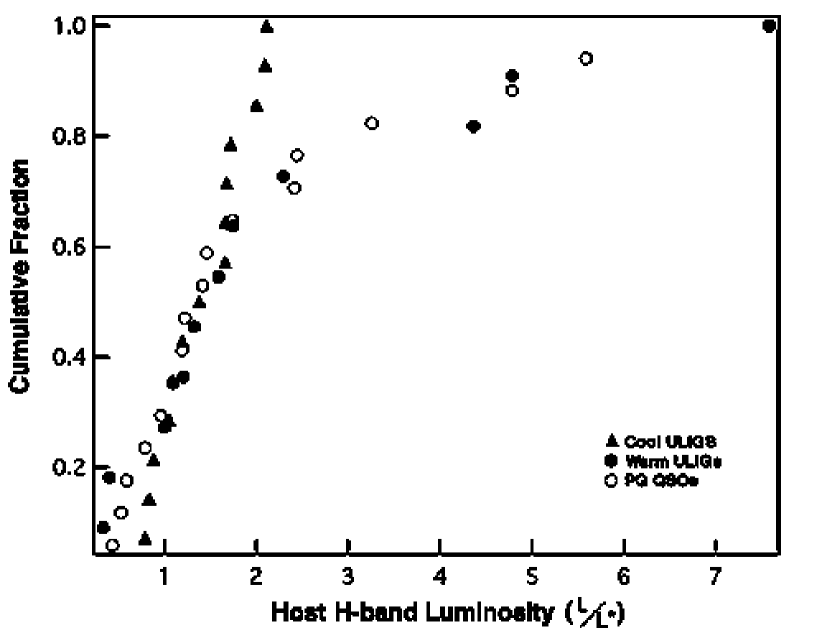
The observed underlying host galaxies (including I Zw 1, Mrk 1014, and 3c273) span a range in absolute magnitude from MH=23.2 (PG 1001+054) to MH=26.1 (3c273), with a mean value of MH=24.50.8 and a median of MH=24.4. The H-band luminosities range from 0.5 to 7.5 L∗444M = -23.9 (Surace et al. 2000). Throughout this paper quoted values are for H , with a median of 1.4 L∗ and a mean of 2.3 L∗. The cumulative distribution of the host galaxy H-band magnitudes is shown in Figure 7.
The fraction of the total system luminosity at a given wavelength originating in the QSO nucleus is given in Table 3. The average nuclear fraction is (BIHK′ )=(0.79, 0.67, 0.60, 0.71)(0.08, 0.16, 0.15, 0.10). As expected from previous studies (Sanders et al. 1989, McLeod & Rieke 1995), the minimum nuclear fraction occurs near 1 m, which is a result of the relative SEDs of QSOs and galaxies. There is a considerable range in nuclear fractions: the QSO nucleus at H-band accounts for anywhere from 36% to 85% of the total H-band luminosity. On average, though, the QSO nucleus and the underlying host galaxy are roughly similar in total magnitude at H. At shorter wavelengths such as B, the QSO nucleus is roughly 4 times more luminous than the host.
3.3 Colors
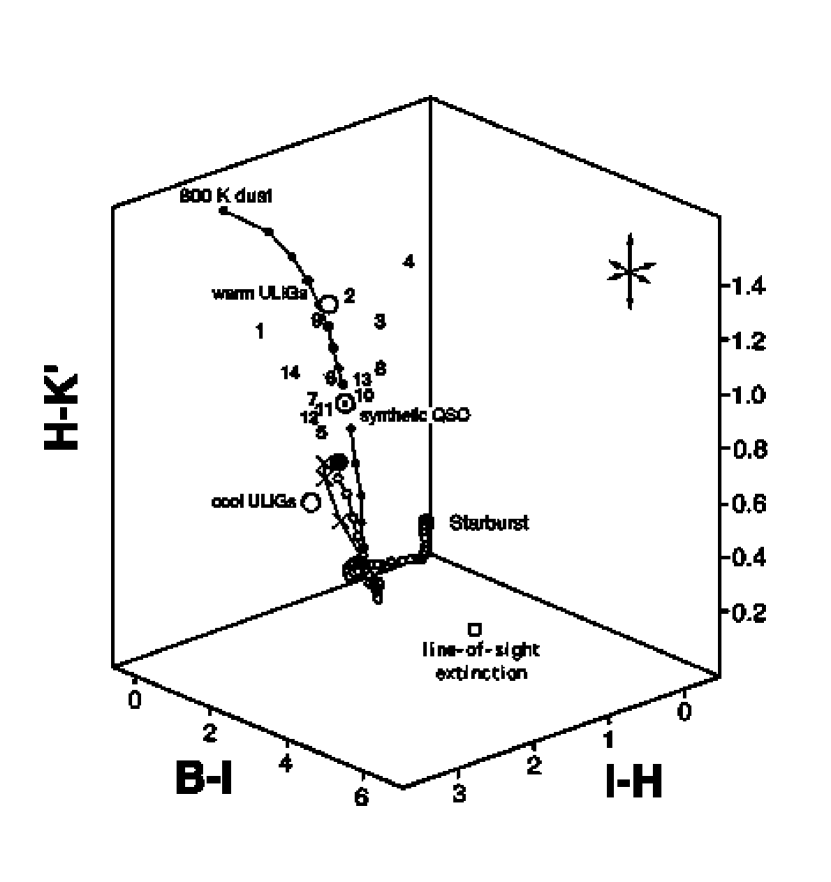
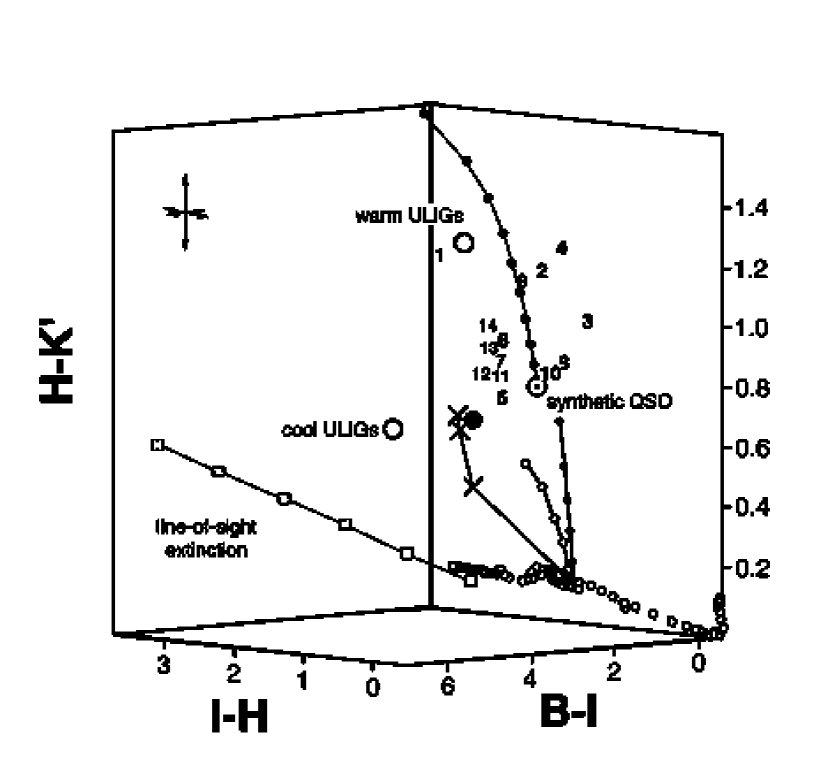
Optical/near-infrared colors were derived for the QSO nuclei. Figures 8 and 9 illustrate the (BI, IH, HK′ ) colors of the QSO nuclei, using the two rotations of the optical/near-infrared color cube introduced in Papers II & III. The figures depict in this three-color basis the colors of an instantaneous starburst taken from Bruzual & Charlot (1993; BC95), as well as the effects of a variety of reddening and emission mechanisms: thermal dust emission, a mixed dust and star distribution, and free-free emission. Also shown are the colors of a synthetic optical QSO developed by Surace et al. (1999) based on the properties of the PG sample as a whole, and the effects of reddening it via inclusion of a hot thermal dust emission component. The colors of “warm” ULIGs are shown with an open circle. The mean QSO nuclear colors are (BI,IH,HK′ ) = (0.99, 1.56, 0.96)(0.23, 0.52, 0.17).
Table 4 presents photometry derived for the star-forming knots and other structures seen in some of the QSO hosts. As in Papers I, II, & III, the photometry was compared to the stellar synthesis models of BC95. A model for the stellar (photosphere) colors from an instantaneous starburst with upper and lower mass cutoffs of 125 and 0.1M⊙ , respectively, was used. The ages derived from the colors are difficult to constrain, however, primarily due to a lack of sensitivity in the near-infrared - the detection limits are too high. In most cases the constraints that can be made indicate young ages for most of the knots ( less than 108 years). The arc in PG 0007+106, while apparently bluer than it’s surroundings, is unconstrained due to a lack of a clear near-infrared detection. The nuclear knot in PG 1119+120 is very red (H- K = 1.25), with a considerable K′ excess compared to stellar colors (H-K=0.2) The knot in the spiral structure of PG 1119+120 appears quite blue and the upper limit at H implies an age of less than 10 Myrs. Generally, the upper limits at H can constrain the stellar population to young ages below 10-100 Myrs (Surace et al. 2000a) Similarly, the knots in PG 1229+204 are similarly blue and have ages of less than 100 Myrs old. The knots in PG 1411+442 are ill- constrained due to large measured uncertainties, but they are also less than 100 Myrs. The nuclear knot (3) has colors similar to many of the star-forming knots seen in the ULIGs (Surace et al. 2000). Finally, the nuclear knot in PG 1613+658 is most prominent at H-band. While actually quite red optically (B-I3.1), its near-infrared colors are typical of stellar colors (H-K′ =0.24).
The colors of the host galaxies themselves as determined from the global and nuclear photometry are poorly determined. This is primarily because the nuclei dominate the luminosity, particularly at very long ( 2) and short ( 0.5 ) wavelengths. Since the average QSO nucleus is anywhere from 1.5 to 4 times more luminous than the host at B, relatively small errors in the determination of the QSO nuclear luminosity result in disproportionately large uncertainties in the QSO host luminosity. The mean colors of the QSO sample host galaxies (excluding the 3 ULIGs which are also QSOs) so derived are (BI,IH,HK′ ) = (1.66, 1.86, 0.65)(0.79, 0.65, 0.36) and are marked with a large solid circle in Figure 8 & 9.
4 Discussion
4.1 Morphology
The host morphologies are surprisingly diverse. Adopting the criteria for radio “loudness” of P watts Hz-1 (Woltjer 1990) and the radio fluxes of Kellerman et al. (1994), we find that all of our sample QSOs are radio-quiet except for 3c273. Although PG 0007+106 also meets this definition it has alternately been classified as both radio-quiet and radio- intermediate, and appears to have a high level of variability (Falcke et al. 1996, Dunlop et al. 1993). The one bona fide radio-loud object, 3c273, is known to have an elliptical host. Fully 50% of the radio-quiet QSOs in our sample occur in spiral-like galaxies and at least 75% occur in clearly non-elliptical hosts, which supports earlier claims that radio-quiet QSOs occur most often in spirals and contradicts some recent claims that elliptical hosts are more predominant (McLure et al. 1999). However, this result may be a selection effect: our QSO sample was specifically chosen to be infrared biased. It is known that infrared-selected samples of galaxies are biased strongly against ellipticals; they are vastly under-represented in IRAS surveys, presumably due to a lack of dust (Sulentic 1988, Surace 1998). Furthermore, this may also result from morphological type being a function of luminosity (Dunlop 2001). McLure et al. (1999) find that nearly all of the QSOs they observed lie in elliptical-type hosts. However, those QSOs had M -23.1 (adjusted for cosmology), which is more luminous than the majority of our sample (where we have estimated MR by interpolation between B and H-band). The low redshift of the IR-excess sample results in a bias towards lower luminosity QSOs, which form a continuous luminosity distribution with Seyfert galaxies. Our fraction of morphological types is extremely similar to that found for Seyfert galaxies. MacKenty (1990) found that half of all Seyferts were in spiral galaxies, and that half of these are barred. A similar result was found by McLeod & Rieke (1995).
Four of the eight spiral hosts are clearly barred, as is a fifth object, also a spiral, which is slightly too faint to be in the sample. The thick bars may have been detected previously and been thought to be elliptical hosts; deeper imaging reveals spiral arms and rings attached to them. The fraction of barred systems (50% 4/8) is higher (by roughly a factor of 2) than that usually found for intermediate-type field spirals and early-type spirals found in the field or in groups (Elmegreen et al. 1990), and is similar to the result found by Hutchings & Neff (1992). However, other observations in the near-infrared (Eskridge et al. 2000) have found a much higher fraction of bars ( 60%) which were hidden at optical wavelengths. This would indicate that the QSO host galaxy bar fraction is typical of the spiral galaxy population. However, their mean peak ellipticity is fairly low (0.36), and for each system the typical ellipticity of the bar is somewhat lower (0.2—0.4), making these “weak” bars. This is consistent with other studies (Shlosman et al. 2000) which have found that Seyfert galaxies have a higher weak bar fraction than non-active galaxies.
Many authors have invoked galaxy mergers as a possible mechanism for fueling QSOs, and four of the IR-excess QSOs occur in a major merger system. This is similar to the 15% interaction fraction found by Bahcall et al (1997). None of the barred host galaxies is also one of the four merger systems with obvious tidal tails. It is possible, however, that the barred systems also result from mergers. Laine & Heller (1999) have shown that the merger of a spiral galaxy and a much smaller companion can produce a barred morphology similar to that seen in the IR-excess PG QSOs. However, these “minor” mergers are qualitatively different from the “major” mergers implicated in ULIGs which involve similarly massive galaxies. Counting the 4 barred spirals and the 4 merger systems, interactions of some kind may be implicated in as many as 47% of the QSOs. While this merger fraction is high, it does not approach the value of nearly 100% observed in ULIGs.
Four of the galaxies with star-forming knots are also those that show evidence for merger activity; the fifth is also postulated to be a merger remnant (Hutchings & Neff 1992). This is consistent with the appearance of massive star formation in mergers in general, and specifically with those found in ULIGs. These features are not as numerous as those found in ULIGs, despite the images being of similar sensitivity. Again, this is consistent with the notion of fading in the stellar knots.
It is worth noting that eight of these IR-excess QSOs have been detected in the millimeter CO (1-0) emission line (e.g. Evans et al. 2001), indicating that their host galaxies are rich in molecular gas. This further strengthens the connection with the ULIGs, which are all known to be molecular gas rich. Two of the QSOs (PG 1351+640 and PG 1415+451), for which no host galaxy classification could be made, are rich in molecular gas and are thus likely to be located in spiral galaxies or on-going mergers.
Finally, it is also worth noting that there is a strong morphological selection bias built into the Palomar-Green Survey. In particular, the survey states that a QSO “ …should have a dominant starlike appearance on blue prints of the 48 inch (1.2 m) Schmidt Sky Atlas…” (Schmidt & Green 1983). This criterion was then used to distinguish between QSOs and Seyfert galaxies. Objects which might have shown broad lines but had particularly luminous host galaxies were thus discarded as Seyfert 1s. This morphological criterion was then further used to create the M- luminosity criterion used to define QSOs, as most of the objects below this criterion showed evidence for nebulosity, but those above did not. However, this criterion is flawed; numerous studies have shown that typically the QSO nucleus and its host galaxy are of comparable luminosity (McLeod et al. 1994ab), although this is wavelength dependent. Therefore, distant objects measured through large apertures might meet the luminosity criterion due to the presence of their host galaxies. Additionally, lower redshift objects whose nuclei might meet the luminosity criterion but whose host galaxies are also very bright and/or extended will be rejected. In short, the PG BQS is biased against QSOs with luminous extended hosts at low redshifts. This morphological bias is likely to skew the results of this study towards finding systems with low luminosity hosts and towards hosts with few recognizable features. Other studies (Goldschmidt et al. 1992, Kohler et al. 1997) have also indicated quantitatively that the BQS is incomplete and heavily biased. In particular, it seems to be incomplete by at least a factor of 2 for low redshift, low luminosity QSOs (z 0.3; 23 24.1). Any results found here regarding the fractions of QSOs with luminous, extended (and possibly with interacting morphologies) hosts are thus likely to be underestimates of the true fraction. On the other hand, Kohler et al. (1997) also finds that the space density of high luminosity QSOs has been severely underestimated in the BQS. Finally, under the unified model of AGN (which attributes the different species of AGN to different viewing angles towards a central engine) there should exist “Type II” QSOs whose geometry is such that the QSO nucleus is hidden from view by the obscuring dust torus, and evidence has been found for a sizable population of red QSOs entirely missed by optical QSO surveys (Webster et al. 1995). The results presented here, particularly in regards to what fraction of the QSO population resides in what kind of host galaxy, should therefore be interpreted strictly in the light of our sample selection criteria. The question of their relevance to the general QSO population, whatever that might be, may have to wait until a better understanding of the space density of physical objects called “QSOs” is achieved.
4.2 Luminosities
Our H-band luminosities are almost identical to the result found by McLeod and Rieke (1994a,b), who found a mean MH=24.3 for all PG QSOs with z 0.3. McLeod & Rieke split their data into two samples, a high luminosity sample (M23.2; Mcleod & Rieke 1994b) and a low luminosity sample ( M23.2; Mcleod & Rieke 1994a). These samples had mean H-band luminosities of MH=24.7 and 24, respectively, and they postulated that this implied that high luminosity QSOs were found in high luminosity hosts (McLeod & Rieke 1994b). It was fair for them to compare the H-band nuclear luminosity to the B-band total integrated luminosity since the B-band luminosity is dominated by the QSO nucleus (see below) and to first order may be taken as indicative of the QSO nuclear luminosity. Unsurprisingly, our data show a strong correlation between B- band nuclear and total luminosity. We do not, however, actually see a correlation between MB and MH in our data, nor is there is any significant correlation between the H-band luminosity of the host galaxy and either the total or nuclear H-band luminosity. Similarly, there is no statistically significant correlation between nuclear and host luminosity in B or I-band. However, we note our small sample size vs. that of McLeod et al. (1995b; 14 vs. 50) which may prevent such a correlation being observed. Even in the data of McLeod et al. (1995b), the effect is sufficiently weak that it requires binning all of the luminosities into just two groups to be detected. There is a statistically significant correlation between K- band luminosities of the host and nuclei at better than the 0.995 level. This may support the notion that more luminous QSOs are found in more luminous host galaxies. This correlation may break down at short wavelengths due to contamination of the host galaxy light by emission from star formation, contamination by the QSO nucleus due to the increasingly poor spatial resolution at short wavelengths, and extinction by dust which is greater at shorter wavelengths. A similar, albeit weaker, result was found by Taylor et al. (1996).
The QSO host galaxies have a median H-band luminosity similar to that of ULIGs (Paper II, III), but have a mean luminosity and span a total range more like that of warm ULIGs (Paper II). Figure 7 shows the H-band host luminosity cumulative distribution functions (CDFs) of the three samples. All of the light attributable to QSO nuclei, putative AGN, and clustered star formation has been subtracted from the total integrated emission; the residual should only be emission from old starlight. As expected from their similar median values, all three samples have nearly identical distribution functions below the 80% number fraction. Both the infrared-excess QSOs and the warm ULIGs have identical distribution functions, suggesting that the same underlying population of galaxy luminosities and hence galaxies make up the hosts. While to some extent this is due to the overlap (16% of QSOs, 25% warm ULIGs) between the two samples, removal of the overlap objects leaves the two CDFs similar. As was noted in Paper III, the cool ULIG sample seems to have a dearth of the very highest luminosity hosts, and as a result it’s CDF deviates from the other two. There are several interpretations: first, and most importantly, the deviation is not statistically significant. Kolomogorov- Smirnov statistics indicate that we can reject the null hypothesis that the cool ULIG sample is drawn from the same underlying population as the warm ULIG and QSO samples at only the 50% level, mostly due to the small number statistics involved. Second, the warm ULIG and infrared-excess QSO samples are truly complete, i.e. they contain every object meeting the selection criteria, while the cool ULIG sample is only statistically complete, as it was drawn from a much larger sample of objects meeting the selection criteria. As a result, it consists of only about 30% of the entire cool ULIG population. While the warm ULIG and QSO samples necessarily contain any existing systems with high luminosity hosts, there is a small likelihood that the cool ULIG subsample will fail to contain any such systems. On the other hand, the cool sample was selected randomly to have the same redshift distribution as the other two samples. Forcing selection of high redshift systems should have biased the cool galaxy CDF towards higher luminosity hosts, if any correlation at all exists between H-band luminosity and Lbol. If this difference in CDFs is actually real, i.e., there is a difference in the populations of the host galaxies, then the distributions of host luminosities are consistent with the infrared-excess QSOs having evolved from warm ULIGs, but that only 80% of the warm ULIG/QSO populations could have evolved from an earlier cool ULIG state. The remaining warm ULIGs and QSOs either arose from a different process, by nature of their massive hosts never passed through a cool ULIG state, or that any such cool state was comparatively short-lived. Multiple evolutionary paths for ULIGs have been postulated previously (e.g. Farrah et al. 2001).
Of the 4 QSO hosts with direct evidence for merger activity, 3 have the highest H-band luminosities in the sample (L; PG 0007+106, Mrk 1014, and PG 1613+658) while the fourth (PG 1411+442) is more nearly 1.3 L∗. This is consistent with their interpretation as mergers of two galaxies. The 5 systems that have barred morphologies that may be consistent with minor merger have a mean H-band luminosity of 1.2 L∗.
4.3 Colors
The derived nuclear colors are similar to those found by Elvis et al. (1994) for UVSX (ultraviolet-soft x-ray) QSOs and support the known large observed scatter in QSO colors. All of the nuclei have (HK′ ) colors redder than those of both our modeled synthetic QSO and those derived observationally from the UVSX sample. This reddening is not consistent with any appreciable (1 AV) foreground dust screen; instead, it is most consistent with varying small contributions (10–20%) at K′ from hot (600–1000 K) dust, whose presence has previously been inferred in these objects (Sanders et al. 1989 and references therein). This reddening at K′ is less extreme than that found in the warm ULIG nuclei, and they are therefore found between the regions in the 3-color diagram occupied by optical QSOs and the warm ULIGs. Since the IR-excess QSOs have colors intermediate between the “warm” AGN- like ULIGs and the larger population of optically selected QSOs, possibly because a smaller fraction of the luminosity at K′ originates in hot dust and any foreground reddening screen is much thinner, this is consistent with the idea that the IR-excess QSOs are transition objects and that as they age much of the dust in the vicinity of the active nucleus is dissipated or destroyed.
An alternate explanation for the near-IR excess could be that of a scattering dust geometry which reddens the observed QSO light. Scattering is greatest at shorter wavelengths, and decreases the effective extinction. However, an examination of Figure 7 shows that the reddening of the IR-excess QSOs is almost entirely due to an excess of K′ emission. The reddening law required to produce this would have to be nearly flat (wavelength-independent) at optical wavelengths. In particular, our observations could be reproduced if E(B-I) E(I-H) 0.2 for AV=1. This is a (B-I) color excess roughly four times less than that of the line-of-sight extinction law. This is also smaller by a factor of several than that derived by Calzetti (1997) for starburst galaxies, in which scattering is believed to be important, or modeled by Witt et al. (1992) for various realistic dust geometries with a central source.
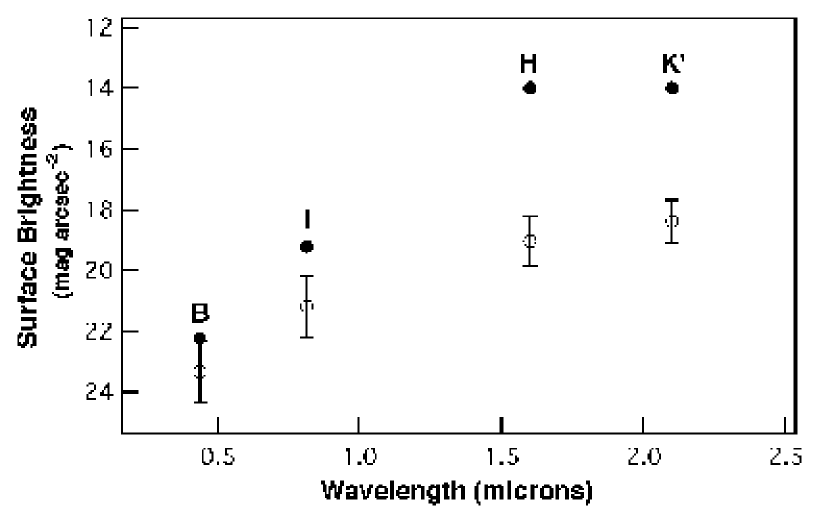
The host galaxy colors are redder at K′ than expected for a stellar population with a Salpeter IMF. This same result was found previously by Surace et al. (1998) for the three warm ULIGs that are also PG QSOs. This may be a result of residual QSO light (which is much redder in the near-infrared than starlight) contaminating the colors of the hosts. The surface brightnesses were measured at the apparent half- radius point in the host galaxies (these mean surface brightnesses appear in Figure 10). The colors derived are (BI,IH,HK′ ) = (2.16, 2.14, 0.65). This is still a considerable (HK′ ) excess, considering that these values were measured far enough from the nucleus that residual nuclear contamination should be quite small. On the other hand, these colors are also very similar to those observed in the central regions of the cool ULIGs, and may represent a near-infrared excess due to recent star-formation activity (Paper III). McLeod & Rieke (1994a) find a similarly high value of HK when comparing their results to those of Dunlop et al. (1993). They note, however, that typical K-corrections to normal galaxy colors may result in HK0.45 (their sample being similar in redshift to ours). If this were combined with modest reddening ( AV = 1 magnitude ) and hot dust emission, the observed colors could be accounted for, considering the uncertainties introduced by the host/nucleus decomposition.
5 Conclusions
1. Host galaxies were detected in all 16 observed infrared-excess PG QSOs. The one QSO not observed (PG 1202+281) was already known to have an elliptical host. In many cases these galaxies had observable 2-dimensional structure. At least 47% (8/17) have features indicative of spiral structure, 50% (4/8) of which have weak nuclear bars. Twenty-four percent (4/17) are clearly on-going major merger systems, and galaxy interactions may be implicated in as many as 50% of all the QSO systems.
2. The underlying host galaxies have H-band luminosities, which are believed to be indicative of the size of the underlying old stellar population, ranging from 0.5 L∗ to 7.5 L∗, with a mean of 2.3 L∗. These luminosities are similar to those of ULIGs, although the “cool” ULIGs with no clear evidence for AGN activity seem to lack the most massive hosts exhibited by “warm” ULIGs and QSOs.
3. The QSO nuclei and their host galaxies are similar in total luminosity at H-band, but this ratio increases to an average of 4:1 at B.
4. The QSO nuclei have near-infrared excesses relative to other optically selected QSO samples. This may be the result of hot dust emission. The host galaxies also have considerable near-infrared excesses. This may be the result of recent star-formation or dust. Derived ages based on the colors of the observed host galaxy features are typically less than 100 Myrs.
5. Contrary to many expectations, QSO host galaxies at low redshift are easiest to detect at optical and not near-infrared wavelengths. This is due primarily to the low background emission of the sky at optical wavelengths coupled with the large projected size of the extended hosts.
Appendix A Notes on Individual Objects
The following are descriptive notes explaining various features of the individual QSO hosts. These features are most easily seen in the near-truecolor images of Figure 2.
PG 0007+106 = Mrk 1051 = III Zw 2 — a single tidal arm or arc extends 22 kpc to the north. This arm has several knots of star formation in its far end. Another galaxy is seen directly to the south. Although there is no apparent connecting structure between the two, there does seem to be some extended low surface brightness emission surrounding all of the galaxies in the field, suggesting that perhaps there are multiple interactions.
PG 0050+124 = I Zw 1 — this is also a “warm” ULIG and is discussed in more detail in Papers I & II. It has two asymmetric spiral arms, both of which have knots of star formation. The galaxy disk is 30 kpc in diameter.
PG 0157+001 = Mrk 1014 — this QSO is also a “warm” ULIG and is discussed in detail in Papers I & II. The host galaxy is dominated by a tidal arm extending to the NE.
PG 0838+770 — a nuclear bar 22 kpc in projected length runs E-W through the host galaxy. Knots are seen near each end of the bar. A single spiral arm extends clockwise from each end of the bar. The galaxy itself is elongated perpendicular to the axis of the bar, although this may be a projection effect.
PG 1001+054 — small and uniform, with no distinguishable features.
PG 1114+445 — the host galaxy is diffuse and uniform, but shows some evidence to the south of having a small, tight spiral arm, suggesting that this is a face-on disk galaxy.
PG 1119+120 — a very red compact emission source lies inside the host galaxy envelope to the NW; with high spatial resolution it appears tangentially elongated. The host galaxy consists of a tilted central elliptical condensation which may be a 15 kpc long bar, with an apparent disk 28 kpc in diameter aligned perpendicular to it. There are at least 5 additional smaller galaxies located within a projected distance of 25″ of the QSO.
PG 1126041 = Mrk 1298 — an elongated, elliptical host approximately 30 kpc in diameter. There are projections from the nucleus parallel to the long axis of the host which suggest that this may be a bar structure.
PG 1202+281 = GQ Comae — we were unable to observe this QSO due to the sensitivity limitations of our fast tip/tilt guider. However, Bahcall et al. (1997) have observed this system with HST/WFPC2 and find that the host galaxy appears to be a small elliptical E1 elliptical galaxy.
PG 1229+204 = Mrk 771 = TON 1542 — a nuclear bar 14 kpc in projected length runs NE-SW through this host. A very blue, linear chain of star-forming knots extends nearly perpendicular to the bar axis at one end. Hutchings et al. (1992, 1994, 1995) claim that this is due to tidal disruption with a small companion; however, it seems more likely that these knots are associated with the bar itself, considering that there appears to be a similar blue region visible on the opposite end of the bar (Figure 2).
PG 1351+640 — no features are discernible in the ground-based images.
PG 1402+261 — Bahcall et al. (1997) describes this as an SBb(r) spiral galaxy. The HST/WFPC2 images show a clear bar with very open arms extending from their ends, a morphology common to several other QSO hosts (e.g., PG 0838+770, PG 1119+120). The ground-based images are just capable of showing this structure.
PG 1411+442 — a tidal loop 88 kpc long extends to the north, then wraps around to the east and extends south. In the model-subtracted image a counter-tail is seen extending south and curving to the west. In the near- infrared, a linear structure is seen extending to the SW from the nucleus which may be a jet. This same jet-like feature can be seen in the optical images after subtraction of a radial model.
PG 1415+451 — no distinguishable features.
PG 1440+356 = Mrk 478 — the galaxy nucleus is elongated NE-SW, and the body of the galaxy is elongated perpendicular to this, a morphology common to many other QSO hosts. There is some faint evidence of shells or arms.
PG 1613+658 — first described in detail by Hutchings & Neff (1992). A very obvious tidal tail extends 88 kpc to the east. In the near-infrared a second bright peak appears 2.4″ to the NW and is most easily seen at H. There is a companion galaxy nearby; it is unclear if it has anything to do with the QSO host since there is no detection of emission linking the two. There is at least one other small galaxy nearby (33″ to the SW).
PG 2130+099 = UGC 11763 = Mrk 1513 = II Zw 136 — this appears to be a spiral galaxy 30 kpc in diameter and inclined 60° from face-on. The HST images reveal the spiral structure in the host which resembles two concentric rings in the ground-based data. There is an odd asymmetry in the NE part of the host, lending to its overall peculiar appearance.
Appendix B Detectability of QSO Hosts
It is commonly held that near-infrared observations are optimal for detecting QSO hosts (McLeod et al. 1995, Dunlop et al. 1993). This is motivated by the comparative SEDs of spiral galaxies and QSO nuclei; the peak of the galaxy SED is very near the minimum of the QSO SED, and therefore H-band observations yield the highest possible contrast between the galaxy host and the QSO nucleus. This was based on the assumption that the greatest difficulty in detecting QSO hosts was trying to differentiate the extended, low-surface brightness galaxy emission from the wings of the PSF of the extremely bright point-like nucleus.
However, these observations show that it is easier to detect QSO hosts at shorter wavelengths like B and I-band. Both our observations and those of others (Hutchings & Neff 1992, Hutchings & Morris 1995) indicate that typical QSO hosts are similar in gross properties to most galaxies. At redshifts of z0.16, a typical host galaxy 30 kpc in diameter is likely to be 5–10″ in radius. This is sufficiently large that at a stable site like Mauna Kea under good conditions (0.5″ FWHM at 5000 Å or 0.3″ at 1.6m) the wings of the PSF do not extend measurably to such large radii. Therefore, at low redshift (z 0.4) the limiting factor in QSO host galaxy detection is background noise (both instrumental and poisson noise from background sky emission). Modern near-infrared and optical instruments are background-limited at the depths required for host detection. The 2 magnitude increase in host galaxy surface brightness between I-band to H-band cannot offset the 5 magnitude decrease in sky brightness under a dark sky (this increases to 8 magnitudes between B to H). Space-based observations, which have smaller sky backgrounds, would not be so affected; and hence the increase in host luminosity at near-infrared wavelengths would then increase detectability. Although the decrease in spatial resolution at long wavelengths with instruments like NICMOS would in theory decrease detectability versus optical instruments like WFPC2, as noted above the very large spatial scales of the QSO hosts at low redshift effectively renders this point moot. Only at higher redshifts (z 0.5) would this become important.
Another reason for the increase in detectability lies in the relative morphology of galaxies at long and short wavelengths. At near-infrared wavelengths galaxies are relatively smooth, reflecting the distribution of old stars. At short wavelengths galaxies show much more complex morphologies due to emission from young stars and differential extinction by dust. Features such as spiral arms are more easily detected at short wavelengths, and therefore QSO host galaxies are more recognizable in filters such as B and I. At near-infrared wavelengths the smooth distribution of old stellar light in the host galaxies is more difficult to detect due to confusion with flat- fielding errors, the wings of the QSO nuclear PSF, etc., while at short wavelengths the high spatial frequency features are more easily separated from large-scale extended background variations.
References
- (1)
- (2) Bahcall, J.N., Kirhakos, S., Saxe, D.H., & Schneider, D.P. 1997, ApJ, 479, 642
- (3) Bahcall, J.N., Kirhakos, S., & Schneider, D.P. 1995, ApJ, 450, 486
- (4) Barnes, J. & Hernquist, L. 1996, ApJ, 471, 115
- (5) Bessell, M.S. 1979, PASP, 91, 589
- (6) Canada-France-Hawaii Telescope Observer’s Manual, 1990, 5-2
- (7) Dunlop, J.S., Taylor, G.L., Hughes, D.H., & Robson, E.I., 1993, MNRAS, 264, 455
- (8) Dunlop, J.S., 2001, to appear in the proceedings of ”QSO Hosts and their Environments”, Granada, January, 2001
- (9) Elias, J.H., Frogel, J.A., Matthews, K., & Neugebauer, G., 1982, AJ, 87, 1029
- (10) Elmegreen, D.M., Elmegreen, B.G., & Bellin, A. 1990, 364, 415
- (11) Elvis, M. et al. 1994, ApJS, 95, 1
- (12) Evans, A.S., Frayer, D.T., Surace, J.A., & Sanders, D.B., 2001, AJ, 119, 536
- (13) Eskridge, P. B., Frogel, J.A., Pogge, R.W. et al. 2000, AJ, 119, 536
- (14) Falcke, H., Sherwood, W., & Patnaik, A., 1996, ApJ, 471, 106
- (15) Farrah, D., Rowan-Robinson, M., Oliver, S., et al. 2001, MNRAS, 326, 1333
- (16) Goldschmidt, P., Miller, L. La Franca, F., & Cristiani, S., 1992, MNRAS, 256, 65P
- (17) Heckman, T., Armus, L., & Miley, G, 1990, ApJS, 74, 833
- (18) Hodapp, K.W., Hora, J.L., Hall, D.N., Cowie, L.L. et al. 1996, New Astronomy, 1, 176
- (19) Hooper, E., Wilkes, B., McLeod, K., Elvis, M., Impey, C.., Lonsdale, C., Malkan, M. and McDowell, J. 1999, ESA SP-427, 427,893
- (20) Hutchings, J.B., Holtzman, J., Sparks, W.B., Morris, S.C., et al. 1994, ApJ, 429, L1
- (21) Hutchings, J.B. & Morris, S.C. 1995, AJ, 109, 1541
- (22) Hutchings, J.B. & Neff, S.G. 1992, AJ, 104, 1
- (23) Kellerman, K.I., Sramek, R.A., Schmidt, M., Green, R.F., & Shaffer, D.B. 1994, AJ, 108, 1163
- (24) Knapen, J.H., Shlosman, I., & Pletier, R.F., 2000, ApJ, 529, 93
- (25) Kohler, T., Groote, D., Reimers, D., & Wisotzki, L. 1997, å, 325, 502
- (26) Laine, S. & Heller, C.H. 1999, MNRAS, 308, 557
- (27) Landolt, A., 1983, AJ, 88, 439
- (28) Landolt, A., 1992, AJ, 104,340
- (29) MacKenty, J.W., 1990, ApJS, 72, 231
- (30) McLeod, K.K. & Rieke, G.H. 1994a, ApJ, 420, 58
- (31) McLeod, K.K. & Rieke, G.H. 1994b, ApJ, 431, 137
- (32) McLeod, K.K. & Rieke, G.H. 1995, ApJ, 454, L77
- (33) McLure, R.J., Kukula, M.J., Dunlop, J.S., Baum, S.A., O’Dea, C.P., & Hughes, D.H., 1999, MNRAS, 308, 377
- (34) Murphy, T., Armus, L., Matthews, K., et al. 1996, AJ, 111,1025
- (35) Neugebauer, G., Green, R.F., Matthews, K., Schmidt, M., Soifer, B.T., & Bennett, J. 1987, ApJS, 63, 615
- (36) Neugebauer, G., & Matthews, K. 1999, AJ, 118, 35
- (37) Perault, M., 1987, Ph.D. thesis, Univ. Paris
- (38) Rowan-Robinson, M. 1995, MNRAS, 272,737
- (39) Sanders , D.B., Phinney, E.S.,,Neugebauer, G., Soifer, B.T., & Matthews, K. 1989, ApJ, 347, 29
- (40) Sanders, D.B., Soifer, B.T., Elias, J.H., Madore, B.F., Matthews, K., Neugebauer, G., & Scoville, N.Z. 1988a, ApJ, 325, 74
- (41) Sanders, D. B., Soifer, B. T., Elias, J. H., Neugebauer, G., & Matthews, K. 1988b, ApJ, 328, L35
- (42) Schmidt, M, & Green, R.F. 1983, ApJ, 269, 352
- (43) Scoville, N. Z. et al. 2000, AJ, 119, 991
- (44) Shlosman, I., Peletier, R. F., & Knapen, J. H. 2000, ApJ, 535, L83
- (45) Soifer, B. T. et al. 2000, AJ, 119, 509
- (46) Stockton, A., & MacKenty, J.W., 1987, ApJ, 316, 584
- (47) Sulentic, J. 1989, AJ, 98, 2066
- (48) Surace, J.A., Sanders, D.B., Vacca, W.D., Veilleux, S., & Mazzarella, J.M., 1998, ApJ, 492, 116 (Paper I)
- (49) Surace, J.A., & Sanders, D.B., 1999, ApJ, 512, 162 (Paper II)
- (50) Surace, J.A., Sanders, D.B., & Evans, A.S., 2000a, ApJ, 529, 170 (Paper III)
- (51) Surace, J.A., Sanders, D.B., 2000b, AJ, 120, 604 (Paper IV)
- (52) Taylor, G.L., Dunlop, J.S., Hughes, D.H., & Robson, E.I., 1996, MNRAS, 283, 930
- (53) Toomre, A., & Toomre, J. 1972, ApJ, 178, 623
- (54) Veilleux, S., Kim, D.-C., & Sanders, D. B. 1999, ApJ, 522, 113
- (55) Wainscoat, R.J. & Cowie, L.L. 1992, AJ, 103, 332
- (56) Webster, R.L., Francis, P.J., Peterson, B.A., Drinkwater, M.J., & Masci, F.J., 1995, Nature, 375, 469
- (57) Whitmore, B. C. & Schweizer, F. 1995, AJ, 109, 960
- (58) Witt, A. N., Thronson, H. A., & Capuano, J. M. 1992, ApJ, 393, 611
- (59) Woltjer, L. 1990, in Active Galactic Nuclei (Springer-Verlag: Heidelberg), 1
- (60)
| Name | RA | DEC | z | Lir/LblueaaReflects new photometry presented in this work. Sample selection was based on the photometry of Sanders et al. (1989) and Sanders et al. (1988b). | Log LbolaaReflects new photometry presented in this work. Sample selection was based on the photometry of Sanders et al. (1989) and Sanders et al. (1988b). | Inst.bbQ = UH2.2m f/31 QUIRC, T = UH2.2m f/31 Tektronix 2048, H = UH2.2m f/31 Orbit reimaged at f/10 through HARIS spectrograph, O = UH2.2m f/31 Orbit, W = HST/WFPC2 | Exposure Times (sec) | |||
|---|---|---|---|---|---|---|---|---|---|---|
| (J2000.0) | L⊙ | B | I | H | K′ | |||||
| PG 0007+106 (III Zw 2) | 00:10:31.0 | 10:58:29.5 | 0.089 | 0.36 | 12.23 | QT | 2280 | 2520 | 1980 | 1980 |
| PG 0050+124 (I Zw 1)ccAlso an ULIG. Data is presented in Surace et al. (1998) and Surace & Sanders (1999). | 00:53:34.9 | 12:41:36.2 | 0.061 | 0.92 | 12.32 | |||||
| PG 0157+001 (Mrk 1014)ccAlso an ULIG. Data is presented in Surace et al. (1998) and Surace & Sanders (1999). | 01:59:50.1 | 00:23:41.5 | 0.163 | 1.86 | 12.68 | |||||
| PG 0838+770 (VII Zw 244) | 08:44:45.6 | 76:53:09.4 | 0.131 | 0.63 | 12.04 | QT | 1920 | 2520 | 2520 | 1800 |
| PG 1001+054 | 10:04:20.1 | 05:13:00.5 | 0.161 | 0.49 | 12.05 | QT | 2680 | 840 | 2160 | 2040 |
| PG 1114+445 | 11:17:06.4 | 44:13:32.6 | 0.144 | 0.98 | 12.15 | QO | 1440 | 1080 | 540 | 720 |
| PG 1119+120 (Mrk 734)ddFalls outside the QSO luminosity definition. | 11:21:47.1 | 11:44:18.3 | 0.050 | 1.00 | 11.48 | QT | 1080 | 1860 | 1680 | 1440 |
| PG 1126041 (Mrk 1298) | 11:29:16.7 | 04:24:07.6 | 0.060 | 0.50 | 11.95 | QT | 2340 | 1860 | 900 | 1080 |
| PG 1202+281 (GQ Comae) | 12:04:42.2 | 27:54:11.4 | 0.165 | 1.05 | 12.11 | W | ||||
| PG 1226+023 (3C 273)ccAlso an ULIG. Data is presented in Surace et al. (1998) and Surace & Sanders (1999). | 12:29:06.7 | 02:03:08.6 | 0.158 | 0.46 | 13.55 | |||||
| PG 1229+204 (Mrk 771) | 12:32:03.6 | 20:09:29.2 | 0.064 | 0.87 | 11.69 | QH | 1200 | 960 | 2040 | 1440 |
| PG 1351+640 | 13:53:15.8 | 63:45:44.8 | 0.088 | 0.40 | 12.39 | QT | 2280 | 1800 | 1440 | 1560 |
| PG 1402+261 (Ton 182) | 14:05:16.2 | 25:55:33.7 | 0.164 | 0.49 | 12.37 | WQT | 3240 | 1800 | 2400 | 1200 |
| PG 1411+442 | 14:13:48.4 | 44:00:13.6 | 0.090 | 0.58 | 12.00 | QO | 1440 | 1200 | 1200 | 2220 |
| PG 1415+451 | 14:17:00.6 | 44:56:06.4 | 0.114 | 0.80 | 11.86 | QH | 1200 | 1440 | 2280 | 2400 |
| PG 1440+356 (Mrk 478) | 14:42:07.5 | 35:26:22.9 | 0.079 | 0.87 | 11.97 | QT | 1500 | 1680 | 1500 | 1920 |
| PG 1613+658 (Mrk 876) | 16:13:57.2 | 65:43:09.6 | 0.129 | 1.58 | 12.23 | QT | 900 | 720 | 2100 | 2700 |
| PG 2130+099 (Mrk 1513) | 21:32:27.8 | 10:08:19.5 | 0.062 | 0.50 | 11.99 | WQT | 2340 | 1260 | 2640 | 2400 |
| Name | Structureaa Observed host galaxy structure: TT=tidal tails, S=spiral structure, ?=indeterminate with no observed structure, E=known elliptical galaxy, B=bar. | Mbb Uncertainties in total system measurements are 0.05 magnitudes, and for nuclear and host galaxy measurements are 0.12 magnitudes.B | mB | mI | mH | m | ||||
|---|---|---|---|---|---|---|---|---|---|---|
| Int.ccIntegrated (total) and nuclear luminosity. Total luminosity measured within the observed I-band extent, and nuclear luminosity measured via point source fitting as described in the text. | Nuc. | Int. | Nuc. | Int. | Nuc. | Int. | Nuc. | |||
| PG 0007+106 | TT | 22.0 | 15.77 | 16.2 | 14.30 | 15.1 | 11.81 | 12.5 | 10.78 | 11.3 |
| PG 0050+124ddAlso an ULIG. Data is presented in Surace et al. (1998) and S urace & Sanders (1999). | S | |||||||||
| PG 0157+001ddAlso an ULIG. Data is presented in Surace et al. (1998) and S urace & Sanders (1999). | TT | |||||||||
| PG 0838+770 | SB | 22.4 | 16.28 | 16.6 | 15.12 | 15.7 | 13.32 | 14.4 | 12.66 | 13.3 |
| PG 1001+054 | ? | 23.0 | 16.15 | 16.2 | 15.50 | 15.6 | 14.48 | 14.8 | 13.41 | 13.8 |
| PG 1114+445 | S | 22.8 | 16.06 | 16.2 | 14.78 | 14.9 | 13.34 | 14.2 | 12.32 | 12.9 |
| PG 1119+120eeFalls outside the QSO luminosity definition. | SB | 21.4 | 15.09 | 15.3 | 13.55 | 14.3 | 12.19 | 12.6 | 11.63 | 11.8 |
| PG 1126041 | S | 22.0 | 14.92 | 15.1 | 13.53 | 14.0 | 11.92 | 12.3 | 11.12 | 11.3 |
| PG 1202+281 | E | |||||||||
| PG 1226+023ddAlso an ULIG. Data is presented in Surace et al. (1998) and S urace & Sanders (1999). | E | |||||||||
| PG 1229+204 | SB | 21.5 | 15.55 | 16.0 | 13.96 | 15.1 | 12.33 | 13.2 | 11.72 | 12.4 |
| PG 1351+640 | ? | 23.1 | 14.63 | 14.8 | 13.65 | 13.9 | 12.74 | 13.0 | 11.89 | 12.1 |
| PG 1402+261 | SB | 23.7 | 15.51 | 15.8 | 14.98 | 15.1 | 13.22 | 13.4 | 12.07 | 12.3 |
| PG 1411+442 | TT | 23.0 | 14.79 | 15.1 | 13.88 | 14.1 | 12.42 | 12.9 | 11.67 | 12.1 |
| PG 1415+451 | ? | 22.5 | 15.90 | 16.2 | 14.70 | 15.2 | 12.98 | 13.4 | 12.14 | 12.6 |
| PG 1440+356 | SB | 22.4 | 15.15 | 15.3 | 13.77 | 14.1 | 11.83 | 12.2 | 11.08 | 11.4 |
| PG 1613+658 | TT | 23.0 | 15.67 | 16.1 | 13.98 | 14.5 | 12.19 | 13.0 | 11.44 | 12.1 |
| PG 2130+099 | S | 22.4 | 14.56 | 14.8 | 13.48 | 14.0 | 11.63 | 12.0 | 10.78 | 11.0 |
| Name | B | I | H | K′ |
|---|---|---|---|---|
| PG 0007+106 | 0.67 | 0.47 | 0.52 | 0.61 |
| PG 0838+770 | 0.77 | 0.57 | 0.36 | 0.58 |
| PG 1001+054 | 0.97 | 0.93 | 0.74 | 0.70 |
| PG 1114+445 | 0.90 | 0.88 | 0.46 | 0.58 |
| PG 1119+120 | 0.80 | 0.49 | 0.71 | 0.83 |
| PG 1126041 | 0.82 | 0.65 | 0.39 | 0.82 |
| PG 1202+281 | ||||
| PG 1229+204 | 0.64 | 0.36 | 0.44 | |
| PG 1351+640 | 0.84 | 0.78 | 0.79 | 0.81 |
| PG 1402+261 | 0.78 | 0.92 | 0.85 | 0.82 |
| PG 1411+442 | 0.78 | 0.80 | 0.65 | 0.68 |
| PG 1415+451 | 0.73 | 0.65 | 0.69 | 0.68 |
| PG 1440+356 | 0.88 | 0.71 | 0.72 | 0.77 |
| PG 1613+658 | 0.70 | 0.60 | 0.46 | 0.53 |
| PG 2130+099 | 0.83 | 0.61 | 0.72 | 0.79 |
| Name | RAaa offsets given relative to the QSO nucleus. | Dec | Aperturebb aperture radius in arcseconds. | mB | mI | mH | m |
|---|---|---|---|---|---|---|---|
| arcseconds | |||||||
| PG 0007+106 arc | 2.8 | 6.4 | 5.0 | 20.80 | 18.37 | 15.80 | 17.60 |
| PG 1119+120 knot 1 | 0.7 | 2.8 | 1.0 | 19.10 | 16.93 | 16.64 | 15.39 |
| PG 1119+120 knot 2 | 9.5 | 1.0 | 1.0 | 22.30 | 21.25 | 20.70 | 20.70 |
| PG 1229+240 SW knots | -4.1 | -4.1 | 0.9 | 20.78 | 19.37 | 18.80 | 18.80 |
| PG 1411+442 knot 1 | 3.5 | 18.6 | 1.0 | 23.53 | 20.70 | 20.70 | 20.20 |
| PG 1411+442 knot 2 | 0.2 | 8.3 | 1.0 | 22.07 | 20.13 | 20.00 | 20.10 |
| PG 1411+442 knot 3 | 1.1 | 1.7 | 1.0 | 20.18 | 18.91 | 16.35 | 15.88 |
| PG 1613+658 knot | 2.4 | 0.7 | 1.0 | 22.80 | 19.74 | 15.95 | 15.71 |