900 KS EXPOSURE OF NGC 3783 WITH CHANDRA/HETGS:
NO ACCRETION DISK LINES
Abstract
We present preliminary results from a 900 ks exposure of NGC 3783 with the Chandra/HETGS. This is the best combination of signal-to-noise and resolution ever obtained for an Active Galactic Nucleus (AGN). We resolve the narrow Fe K line to have FWHM of km s-1 which, under the simple assumption of virialized system, suggest that this narrow line is emitted between the broad line region and the narrow line region. We do not detect any broad component for the Fe K line though such component was observed in previous ASCA observations of this object. Our results suggest an evolution in the broad Fe K line that took place from the observations in 1996 to the observations in 2000/2001.
The high resolution X-ray spectrum of NGC 3783 shows more than a hundred absorption lines and several dozen emission lines from the H-like and He-like ions of N, O, Ne, Mg, Al, Si, and S as well as from Fe xvii to Fe xxiv L-shell transitions. All these features can be modeled by a multi-component, outflowing, photoionized absorber. There is no evidence (or need in the model) for soft X-ray emission lines from a relativistic accretion disk as have been proposed to be seen in a few other AGNs.
1 Introduction
NGC 3783 is a bright Seyfert 1 galaxy in which its X-ray spectrum shows some of the strongest absorption features around 0.7–1.5 keV. Studies by ROSAT [1] and ASCA (e.g., [2] and references therein) have shown that the 2–10 keV continuum is fitted by a power law with photon index –1.8, the 2–10 keV flux varies in the range – ergs cm-2 s-1, and its mean X-ray luminosity is ergs s-1 (for km s-1 Mpc-1 and ). The absorption features are attributed to O vii and O viii edges and their models indicate a column density of ionized gas of cm-2.
On 2000 January 21 NGC 3783 was observed with the High-Energy Transmission Grating Spectrometer (HETGS) on the Chandra X-ray Observatory with the Advanced CCD Imaging Spectrometer (ACIS) as the detector. This spectrum shows several dozen absorption lines and a few emission lines from the H-like and He-like ions of O, Ne, Mg, Si, and S as well as from Fe xvii–Fe xxiii L-shell transitions. The absorption lines are blueshifted relative to the systemic velocity by km s-1 while the emission lines are consistent with being at the systemic velocity [3, 4]. High-resolution UV spectra of NGC 3783 taken with HST show intrinsic absorption features due to C iv, N v and H i (e.g., [5] and references therein). Currently there are three known absorption systems in the UV at radial velocities of 560, 720, and 1400 km s-1 (blueshifted) relative to the optical redshift. The strength of the absorption in the UV and in the X-ray bands, is found to be variable over time scales of months to years.
The above characteristics have made NGC 3783 to be a perfect target for an intensive study of the ionized gas in its nuclear environment. This multiwavelength monitoring study was carried out during 2001 February–June by Chandra/HETGS, RXTE, HST/STIS, FUSE, and a ground based observatory. The Chandra/HETGS observations consist of five observations each of 170 ks and adding the initial 56 ks the total exposure time (ONTIME) is 900.1 ks (total of good time interval corrected for detector dead time is 888.7 ks). In this contribution we will present the mean 900 ks Chandra/HETGS X-ray spectrum of NGC 3783. We will focus on the Fe K region where a broad line, modeled as an emission line from accretion disk, was detected in ASCA observations from 1996. The detailed Chandra/HETGS spectra and analysis will be presented in Kaspi et al., in preparation (mean X-ray spectrum), I. M. George et al., in preparation (X-ray variability), and H. Netzer et al., in preparation (X-ray spectra models). HST/STIS and FUSE observations will be presented in Crenshaw et al., in preparation, and Gabel et al., in preparation, respectively.
2 900 ks mean X-ray spectrum
All Chandra/HETGS observations were reduced uniformly and in the standard way using the Chandra Interactive Analysis of Observations (CIAO) software (Version 2.1.2), and its Calibration Database (Version 2.6). The mean 900 ks spectrum is shown in Fig. 1. About 150 line features can be identified in the spectrum; many of these are blends of several lines. We identify absorption lines from H-like and He-like ions of N, O, Ne, Mg, Al, Si, and S as well as absorption from lower-ionization ions such as Si vii–Si xii and S xii–S xiv. There are also many absorption lines from iron ions; L-shell and M-shell lines of Fe xvii–Fe xxiv as well as probable resonance lines of Fe xxv. Absorptions by C, Ar, and Ca are hinted, although these are not significant.
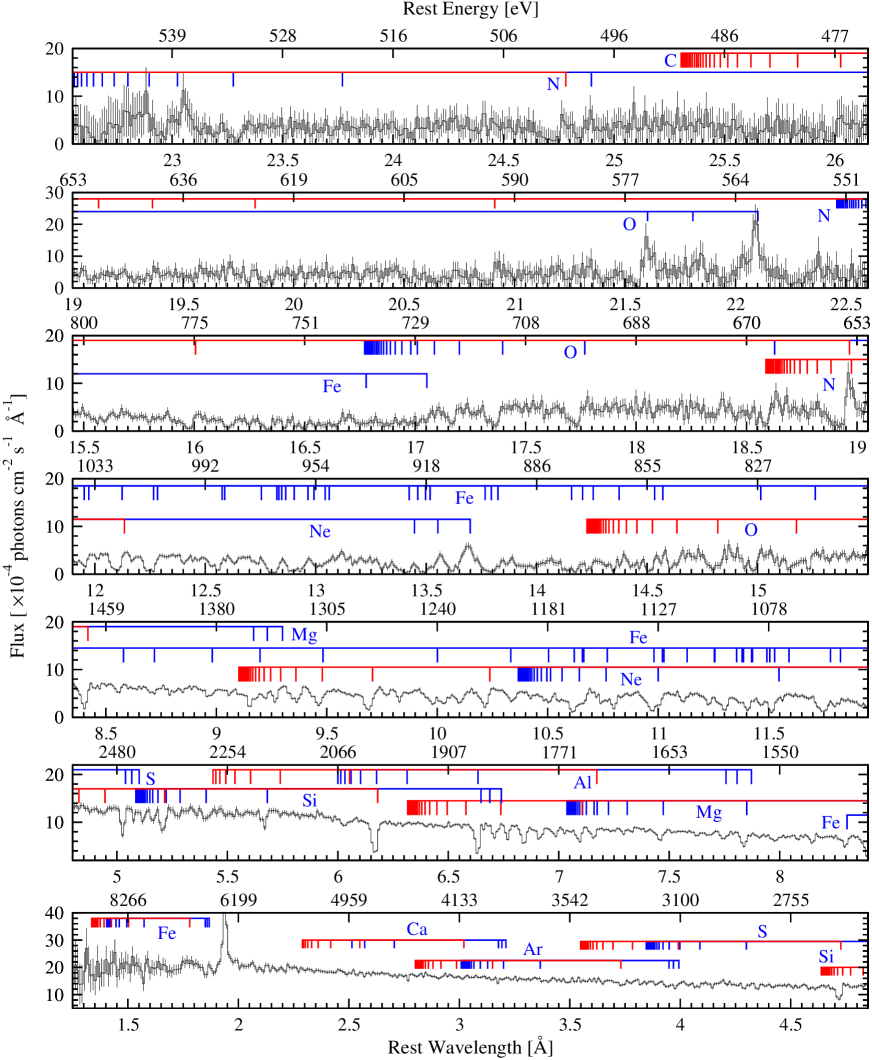
Focusing on the topic of this meeting, there are two regions were emission lines from accretion onto black holes are expected: the Fe K line at 6.4 keV which will be discussed in the next section, and the soft X-ray emission lines from a relativistic accretion disk recently suggested to be present in the narrow line Seyfert 1 galaxies MCG 6-30-15 and Mrk 766 using XMM-Newton observations [6]. These are Ly lines from O viii, N vii, and C vi which are broadened by relativistic effects in the accretion disk and appear in the spectrum as broad saw-toothed features around 17–35 Å. When binning the 900 ks X-ray spectrum of NGC 3783 to XMM/RGS resolution, it has adequate signal-to-noise ratio up to about 27 Å. Examination of this part of the spectrum reveals no such features as identified in MCG 6-30-15 and Mrk 766. Preliminary model for the data, based on the multi-component, outflowing, photoionized absorber model presented in [4], fits the 900 ks spectrum over the whole 0.5–10 keV band, with no need to invoke the relativistic accretion disk lines.
3 The Fe K line region
The high-resolution X-ray spectrum of NGC 3783 shows a prominent narrow Fe K emission line. A Gaussian fitted to the 0.0025 Å binned spectrum (Fig. 2b) gives a central wavelength of Å ( eV) which is consistent with the Fe K line from Fe i to Fe xi. Interestingly, the Fe K line in Fig. 2b shows two peaks (though these are not significantly resolved) which are consistent with the two expected Fe K lines for Fe i, K at 1.936 Å (6403.84 eV) and K at 1.940 Å (6390.84 eV), with a branching ratio of 2:1. We fitted the HEG spectrum with two Gaussians fixed at the wavelengths of Fe K lines and with the same branching ratio. We find the FWHM of the Gaussians to be mÅ and, when taking into account the instrumental FWHM of 12 mÅ, we get a true FWHM of mÅ. This FWHM corresponds to km s-1 at the wavelength of the Fe K line (fitting the data with only one Gaussian yields a consistent result, km s-1).
If we assume the very simple assumption that the gas around the central mass is moving as a virialized system than there is a simple anticorrelation of the line width with the radial location of its origin. Since the Broad lines in NGC 3783 has line widths of order 4000 km s-1 and the Narrow lines has line widths of order 500 km s-1, the resolved line width of the narrow Fe K line suggests an origin in between the BLR and the NLR. Within the frame of AGNs’ unified models this is consistent with an emission from the torus. Indeed, the Fe K narrow line equivalent width ( mÅ = eV) and flux () are consistent with models predicting emission from the torus (e.g., [7]).
The narrow Fe K line seems to have a red wing extending to Å ( keV). We tentatively identify this red wing as the “Compton shoulder” produced by Compton scattering in optically-thick cold matter which can be identified with the obscuring torus. The shoulder extends from 6.2 to 6.4 keV, has a total flux of , and its EW is mÅ. These numbers are in agreement with previous models and observations of such a shoulder (e.g., [8]).
We have looked for a broad component for the Fe K line by fitting an absorbed power-law continuum to the energy range 2.5–10 keV (excluding the 5–7 keV range and several narrow absorption lines) and modeling the Fe K line with a narrow Gaussian plus a “disk-line” component for a Schwarzschild black hole [9]. This procedure is described in detail in [4]. We do not find a broad component in the 900 ks Chandra/HETGS spectrum (see Fig. 3) and we are only able to place an upper limit on its intensity to be (EW eV).

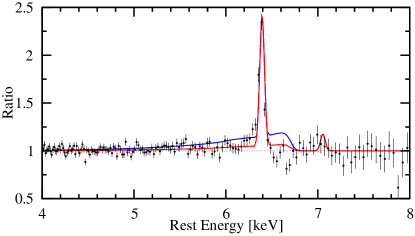
In ASCA observations carried out in 1996 the Fe K line is modeled with a broad component with an intensity of and a narrow component with an intensity of [2, 4]. While the narrow component flux is consistent with the current measurement, the upper limit we set for the broad component indicates that its flux decreased by a factor of at least three between the 1996 observations and the 2000/2001 observations. Other line models, which are still need to be constrained, will be presented in Kaspi et al., in preparation.
References
- [1] Turner, T. J., Nandra, K., George, I. M. et al. 1993, ApJ, 419, 127.
- [2] George, I. M., Turner, T. J., Mushotzky, R. et al. 1998, ApJ, 503, 174.
- [3] Kaspi, S., Brandt, W. N., Netzer, H. et al. 2000, ApJ, 535, L17.
- [4] Kaspi, S., Brandt, W. N., Netzer, H. et al. 2001, ApJ, 554, 216.
- [5] Kraemer, S. B., Crenshaw, D. M., & Gabel, J. R. 2001, ApJ, 557, 30.
- [6] Branduardi-Raymont, G., Sako, M., Kahn, S. M. et al. 2001, A&A, 365, L140.
- [7] Krolik, J. H., Madau, P., & Zycki, P. T. 1994, ApJ, 420, L57.
- [8] Iwasawa, K., Fabian, A. C., & Matt, G. 1997, MNRAS, 289, 443.
- [9] Fabian, A. C., Rees, M. J., Stella, L. et al. 1989, MNRAS, 238, 729.
ACKNOWLEDGEMENTS
We gratefully acknowledge the financial support of CXC grant GO1-2103, and NASA LTSA grant NAG 5-8107.