Infrared Spectroscopy of Atomic Lines in Gaseous Nebulae 1
Abstract
Spectroscopy in the infrared provides a means to assess important properties of the plasma in gaseous nebulae. We present some of our own work that illustrates the need for interactions between the themes of this conference – astronomical data, atomic data, and plasma simulations. We undertook Infrared Space Observatory (ISO) observations with the intent of better understanding the effects of density variations in nebulae, particularly planetary nebulae (PNs), by determining average electron densities from the flux ratios of several fine-structure, IR emission lines. Instead, we are able to ascertain only minor density information because of several instances of the observed line flux ratios being out of range of the theoretical predictions using current atomic data. In these cases, the ISO data cannot presently be used to derive electron density, but rather provide direction for needed improvements in the atomic collision strengths.
We have detected an unidentified (uid) strong emission line in an ISO/SWS spectrum of the Orion Nebula. The line has a rest wavelength 2.893500.00003 m. A long-slit UKIRT observation confirms the presence of this line and shows that the emission is spatially extended and appears to be coincident with the brightest part of the ionized region. We do not detect the uid line in our SWS02 spectra of any of the several bright PNs which we observed for a comparable time. The need for basic atomic data, in this case wavelengths to aid species identification, is paramount for future progress.
We look toward the future with a brief synopsis of upcoming or planned IR missions that promise a significant spectroscopic bearing. The missions (and their instruments) discussed are SIRTF, SOFIA, and HERSCHEL (upcoming) and NGST, GSMT, and SAFIR (planned).
1. Introduction
Most observational tests of the chemical evolution of the universe rest on emission line objects; these define the endpoints of stellar evolution and probe the current state of the interstellar medium. Gaseous nebulae are laboratories for understanding physical processes in all emission-line sources, and probes for stellar, galactic, and primordial nucleosynthesis.
There is a fundamental issue that continues to be problematic – the discrepancy between heavy element abundances inferred from emission lines that are collisionally excited compared with those due to recombination/cascading, the so-called “recombination lines”. Studies of planetary nebulae (PNs) contrasting recombination and collisional abundances (Liu et al. 1995, Kwitter & Henry 1998) often find differences exceeding a factor of two. In an extensive study of NGC 6153, Liu et al. (2000) found that C++/H+, N++/H+, O++/H+, and Ne++/H+ ratios derived from optical recombination lines are all a factor of 10 higher than the corresponding values deduced from collisionally-excited lines. Abundances determined from these two methods disagree by a factor larger than the spread of abundances used to determine such fundamental quantities as Galactic abundance gradients (e.g., Shaver et al. 1983; Simpson et al. 1995; Henry & Worthey 1999).
Most of the efforts to explain the abundance puzzle between collisional and recombination values have attempted to do so by examining electron temperature () variations in the plasma. This is often done, using the formalism of Peimbert (1967), in terms of the mean-square variation () of . The inferred metallicity obtained by using the usual (optical/UV) forbidden lines is very sensitive to (exponential) and . On the other hand, recombination lines are rather insensitive to and . Agreement close to the higher recombination value can be forced in the derived abundance by attributing the difference to (solving for) . For instance, consider the case of the PN NGC 7009, which has stood near the center of the abundances controversy. Liu et al. (1995) found that the recombination C, N, and O abundances are a factor of 5 larger than the corresponding collisional abundances. By invoking 0.1 for oxygen in NGC 7009, agreement can be forced in the derived abundance close to the higher recombination value – a value more than 2.5 times larger than the solar O/H of 7.4110-4 (Grevesse & Sauval 1998). Such a large is not at all predicted by current theory/models (e.g., Kingdon & Ferland 1998).
For NGC 7009, Rubin et al. (2000) produced a map on a pixel scale of 0.1′′ from the flux ratio of [O iii] 4363/5007 using a set of HST/WFPC2 images that included narrow-band filters F437N and F502N to assess these line fluxes. Their analysis of in the plane of the sky indicates very small values, 0.01, throughout the nebula. It seems clear that something more than variations alone is necessary to explain the abundance dilemma.
We have been addressing other ingredients that may affect the determination of elemental abundances from observations. Perhaps the most important of these is density variations. While variations are expected theoretically to be fairly small in PNs and H ii regions, variations in electron density () are almost certainly very large. High values (106 cm-3) are inferred in the cometary knots of the Helix nebula (e.g., Walsh & Meaburn 1993; Burkert & O’Dell 1998) and around proplyds in Orion (e.g., Henney & O’Dell 1999 and references therein). Gas at = 106 cm-3 will produce 106 times as much emission as the same volume of “normal” nebular gas at = 103 cm-3 for recombination lines and collisionally-excited lines that are not suffering collisional deexcitation – when (the critical density).
Several well known line ratios of collisionally-excited lines serve as diagnostics of , probing different ionization conditions and different density regimes. Because various collisionally-excited lines undergo collisional deexcitation at different values, the derivation of an average for a given line ratio depends on the specific (and ) dependence of the respective volume emissivities. In general, different average values are obtained for various line pairs due to different contributions to the observed intensities from the volume observed. Very substantial biases in the inference of abundances from collisionally-excited lines may then result (Rubin 1989; Viegas & Clegg 1994; Liu et al. 2000).
2. The Promise of the Infrared for Density Diagnostics
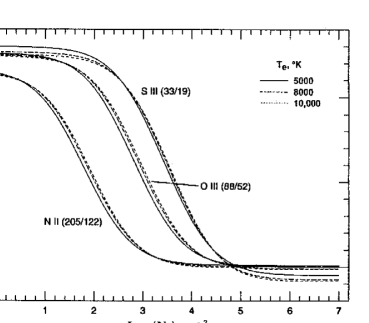
Measurement of the two J = 1 IR fine-structure transitions for species with a ground state provides a diagnostic for . The ratio of their fluxes is a sensitive indicator of (over some range in ) that generally is not significantly affected by or extinction. For example, the flux ratios [O iii] 52/88 m, [S iii] 19/33 m, and [N ii] 122/205 m provide [O iii], [S iii], and [N ii], respectively, as shown in Figure 1 (Rubin et al. 1994).
There is only a weak dependence on as illustrated for each species by the three curves for = 5000, 8000, and 10000 K. For conditions prevalent in many PNs and H ii regions, these lines readily show the effect of collisional deexcitation because some of the plasma may exceed their respective -values. We are able to use only two of the above diagnostics because ISO did not observe the 205 m line.
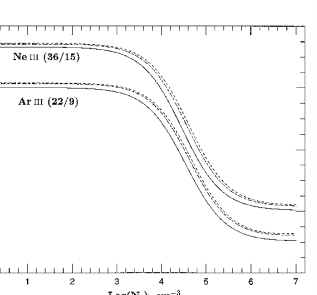
With ISO, there are now at least three important additional IR line ratios available – [Ne iii] 36.0/15.5, [Ne v] 14.3/24.3, and [Ar iii] 21.8/8.99 m – for studies of structure and variations. This is because ISO was able to observe the [Ne iii] 15.5 m, [Ne v] 14.3 m, and [Ar iii] 21.8 m lines, which suffer very seriously from the atmosphere even for airborne astronomy, e.g., for the Kuiper Airborne Observatory (KAO) or SOFIA. (Observations of these lines with the IRAS LRS were sparse and of dubious quality.) These three ratios are sensitive indicators of higher density material than are the other three ratios mentioned earlier. Two of these ratios – [Ne iii] 36/15 m and [Ar iii] 22/9 m – are displayed in Figure 2.
The ratios are similar in that they are most discriminant in the range 3.8 log 5.4. We will use two more -diagnostic line ratios [Mg v] 13.5/5.61 m and [Ar v] 13.1/7.9 m. These will be used to probe the higher ionization gas. Although usually weaker than the lines mentioned earlier, all are expected to be seen in a large number of high ionization PNs. The hope for the ISO IR data is that these numerous “new” diagnostics, in combination with the diagnostics available from the optical/UV, will permit a viable tomographic analysis of the structure in PNs.
3. ISO Observations and Results for the Density Analysis
Under our GO programs, we observed the PNs NGC 2022, NGC 6210, NGC 6818, and IC 2165 with the ISO Short Wavelength Spectrometer (SWS). Our observations with SWS were made in SWS02 mode, which provides higher spectral resolution than SWS01 mode. One of our goals was to derive from several diagnostic line pairs in order to address density variations within these objects. As described above, we aimed to obtain values from the following six flux ratios: [S iii] (18.7/33.5), [Ar iii] (8.99/21.8), [Ne iii] (15.5/36.0), [Ar v] (7.90/13.1), [Ne v] (14.3/24.3), and [Mg v] (5.61/13.5m). Because the ISO/SWS aperture size depends on wavelength, the above line fluxes are not always directly comparable. For the lines discussed here, the sizes were: 14′′ 20′′ for the 5.61, 7.90, & 8.99 m lines; 14′′ 27′′ for the 13.1 – 24.3 m lines; and 20′′ 33′′ for the 33.5 & 36.0 m lines. Table 1 provides a summary of which lines were observed in the various sources.
![[Uncaptioned image]](/html/astro-ph/0109398/assets/x3.png)
The position angles (PA) of the long-axis of the various apertures were 183.17, 13.27, 349.07, and 193.71o for NGC 2022, NGC 6210, NGC 6818, and IC 2165, respectively, and rough estimates of the respective source “diameters” are 19′′, 16.2′′, 20′′, and 9′′. However, there is certainly emission well beyond these “diameters” in the case of NGC 6210 – see an overlay(http://www-space.arc.nasa.gov/rubin/turtle.html) of our ISO apertures on HST/WFPC2 images taken by us under GO-6792 – and NGC 6818 –(http://www-space.arc.nasa.gov/rubin/zorro.html) other WFPC2 images under GO-6792. The best object for our analysis in this sense is IC 2165, which is smaller than the smallest aperture. For the other PNs, the use of line flux ratios may still be valid as long as the specific ionic emitting zone is circumscribed by the smaller of the two apertures. Of the six line sets, only the [Ne v] pair of lines (14.3, 24.3) was observed with the same aperture size.

Figures 3 and 4 are ISO SWS02 spectra of the [Ne v] 14.32 and 24.32 m lines in NGC 6818. The aperture used for each was 14′′ 27′′. The data are fit very well by a Gaussian profile. Data processing was performed using the ISO Spectral Analysis Package (ISAP). NGC 6818 is not fully enclosed by a 14′′ 27′′ aperture. However, the same portion of the nebula is observed in both of these lines. Because the high ionization Ne+4 zone is much more concentrated toward the central star than the entire ionized (H ii) region is, it is highly probable that the total Ne+4 zone is enclosed within the observed aperture.
Figure 5 shows the theoretical flux ratio F(14.3)/F(24.3) vs. (cm-3), using effective collision strengths from Lennon & Burke (1994). Throughout this paper, we shorten effective collision strength () to collision strength (CS). Our ISO data with regard to this ionic species are most interesting. In the subsections to follow, we present the SWS data and discuss the six ionic species in order of lowest to highest degree of ionization as indicated by the range in ionization potential (I.P.) over which the species exist.
3.1. S iii
Observations were made of both the [S iii] 18.7 and 33.5 m lines in all four of our program PNs. The line profiles were fit with the line-fitting routine in ISAP,


which provides the line flux and uncertainty. We fit the data points with a Gaussian and a linear baseline such as shown in Figs. 3 and 4 for the [Ne v] data. In general, the data were fit well by this method. Table 2 presents the measured fluxes and uncertainties. These uncertainties do not include systematic errors. The last column has the derived from the flux ratio assuming a of 10,000 K. It is likely that only the for IC 2165 is valid. Because of the extended [S iii] emission and the mismatch of aperture sizes, the F(18.7)/F(33.5) ratio is likely a lower limit and the entry a lower limit for the other objects.
In the lower part of Table 2, we provide the theoretical F(18.7)/F(33.5) ratio in the low- limit; there, the smallest value of the ratio obtains. The transitions are shown in a term diagram (not to scale) with -values for levels 2 and 3 given for = 10,000 K.
![[Uncaptioned image]](/html/astro-ph/0109398/assets/x7.png)
3.2. Ar iii
Observations were made of the [Ar iii] 8.99 and 21.8 m lines in NGC 6210 and NGC 6818. Table 3 presents the measured fluxes for these data. The comments regarding line fitting, etc., and the tabular entries that accompanied Table 2 apply here and for the ionic species to follow. In the lower part of the Table, we have the theoretical F(21.8)/F(8.99) ratio in the low- limit, where the highest value of the ratio obtains. For NGC 6210, the observed ratio is close to the low- asymptotic limit, where the ratio is insensitive to and thus not useful for deriving . For this and other such instances, “near low limit” is entered in the -column of the Table. For NGC 6818, the observed ratio exceeds the low- limit for any reasonable . Because the [Ar iii] emission is likely more extended than the smaller 14′′ 20′′ aperture used for the 8.99 m line, the F(21.8)/F(8.99) ratio is likely an upper limit and thus any inference that the observed ratio is out of the theoretical bounds is uncertain. We enter “XXX low ?” in the Table.
![[Uncaptioned image]](/html/astro-ph/0109398/assets/x8.png)
3.3. Ne iii
Observations were made of the [Ne iii] 15.5 and 36.0 m lines in IC 2165, NGC 6210, and NGC 6818. Table 4 presents the measured fluxes for these data as well as the theoretical F(36.0)/F(15.5) ratio in the low- limit, where the highest value of the ratio obtains. For all the sources, the observed ratio exceeds the low- limit. However because the [Ne iii] emission for NGC 6210 and NGC 6818 may be more extended than the smaller 14′′ 27′′ aperture used for the 15.5 m line, the F(36.0)/F(15.5) ratio is likely an upper limit and again has an uncertain (XXX low ?) conclusion. On the other hand, for IC 2165, we are dealing with integrated fluxes and conclude robustly that the observed ratio is out of the theoretical bounds and enter “XXX low” in the Table. The theoretical ratio in the low- limit is set by the effective collision strengths. We suggest the data for IC 2165 are pointing to a need to reexamine the CS, particularly those between the fine-structure levels.
![[Uncaptioned image]](/html/astro-ph/0109398/assets/x9.png)
3.4. Ar v
Observations were made of the [Ar v] 7.90 and 13.1 m lines in IC 2165 and NGC 6818. Table 5 presents the measured fluxes for these data as well as the theoretical F(7.90)/F(13.1) ratio in the low- limit, where the lowest value of the ratio obtains. For both PNs, the observed ratio is near the low- limit. Here, even in the case of NGC 6818, it is likely that the Ar+4 zone is much more centrally concentrated than the size of the H+ zone; but if the [Ar v] 7.90 emission were more extended than the smaller 14′′ 20′′ used, then the F(7.90)/F(13.1) ratio would be a lower limit.
![[Uncaptioned image]](/html/astro-ph/0109398/assets/x10.png)
![[Uncaptioned image]](/html/astro-ph/0109398/assets/x11.png)
3.5. Ne v
Observations were made of the [Ne v] 14.3 and 24.3 m lines in IC 2165, NGC 2022, and NGC 6818 (see Figs. 3 & 4). Table 6 has the measured fluxes for these data as well as the theoretical F(14.3)/F(24.3) ratio in the low- limit, where the lowest value of the ratio obtains. For NGC 6818, the observed ratio is well below the low- theoretical limit for any reasonable ; for NGC 2022, the observed ratio is also out of bounds. For IC 2165, we derive = 1310 (if = 10,000 K) and 1950 cm-3 (if = 15,000 K) from Fig. 5 (see Table 6). Compared to -values derived for IC 2165 by Stanghellini & Kaler (1989), albeit for other ions, the values here are very low.
We are aware of three other measurements of from the [Ne v] ratio using ISO data. For the Seyfert galaxy NGC 4151, Alexander et al. (1999) found an observed ratio that is close to the low- limit For the PNs NGC 7027 and NGC 6302, van Hoof et al. (2000), found of 26,900 and 12,300 cm-3 using 20,000 K. Compared to -values derived from optical data for these PNs for other ions (Stanghellini & Kaler 1989), the IR values are lower. The fact that these previously published [Ne v] ratios and our new IC 2165 result yield generally lower -values than other methods tends to lend support to our conclusion that the low- theoretical limit may need re-examination per our XXX low results. Just because the NGC 7027, NGC 6302, and IC 2165 data lead to “legal, in-theoretical-bounds values” does not mean the inferred s are correct and does not rule out the possibility that the collision strengths between the levels may need revision.
3.6. Mg v
Observations were made of the [Mg v] 5.61 and 13.5 m lines in IC 2165. Table 7 presents the measured fluxes as well as the theoretical F(13.5)/F(5.61) ratio in the low- limit, where the highest value of the ratio obtains. Again, the observed ratio is out of the theoretical bounds.
![[Uncaptioned image]](/html/astro-ph/0109398/assets/x12.png)
4. Observations of a Strong Unidentified IR Emission Line
We have detected an unidentified (uid) strong emission line in an ISO SWS02 spectrum of the Orion Nebula that was obtained for our Guest Investigator program on 1997 October 12 (UT), see Figure 6. The 14′′20′′ aperture was centered at , = , –05o23′415) (equinox J2000). This position is the center of position 1SW, 18.5′′ S and 26.2′′ W of 1Ori C, observed with HST (see Rubin et al. 1997). The orientation of the long axis of the aperture was at PA 190.28o, determined by the time of the actual observation. With a correction for Vhelio = 17 km s-1 from emission lines arising in the main ionization zone (O’Dell et al. 1993), the line has a rest wavelength 2.893500.00003 m (3456.02 cm-1); it is a factor of 3.6 weaker than the nearby, H i 11–5 line (2.8728 m). The average surface brightness in this aperture was 3.9E-18 W m-2arcsec-2.


We do not detect the uid line in our SWS02 spectra of any of the five bright PNs, which we observed for a comparable time. These are the PNs discussed earlier plus NGC 7009 (the Saturn Nebula). We have also examined many of the ISO archival spectra taken by others of the Orion Nebula as well as several other PNs. We find no indication of the uid line in the PNs examined, which included NGC 7027, NGC 6543, the low ionization PNs IC 418 and BD +30 3639, as well as the bright H ii region M 17. Unlike our 1SW position (well in the heart of the ionized region), most of the other ISO Orion spectra were taken at positions where molecular/ photodissociation (PDR)/neutral species would be expected to dominate. There is some indication of the uid line in the following two archival spectra:
an SWS01 low-resolution scan of “Orion Bar d2” (PI Drapatz) , =, –05o25′401 (J2000), taken 1997 October 11. The exposure was 1912 sec. with a 20′′33′′ aperture. The long axis of the aperture was at PA = 189.87o. We measure a line flux of 3.25E-190.75E-19 W cm-2.
an SWS06 scan of “Orion-BN” (PI Cernicharo) , = ,–05o22′236, taken 1997 October 12 (UT). The exposure was 7598 sec. with a 20′′27′′ aperture. The long axis of the aperture was at PA = 190.36o. We measure a line flux of 4.11E-201.22E-20 W cm-2.
Spectra of Orion taken at the United Kingdom Infrared Telescope (UKIRT) confirm the presence of this strong uid line. A long-slit observation (80′′1′′) centered at 1SW and pointing through 1Ori C shows that the emission is spatially extended and appears to be coincident with the brightest part of the H ii region. The highest surface brightness occurs at 1SW: 1.2E-17 W m-2arcsec-2 (20%) with FWHM = 24 km s-1 (resolved). Figure 7 shows a spectrum at this location for which the wavelength scale has not been corrected for the Doppler velocity of the source. When the correction is made, the rest wavelength is 2.8935 m. A second observation was made with the slit passing through the proplyd P159-350 (O’Dell & Wen 1994) and pointing toward 1Ori C. This spectrum also shows extended emission in the uid line with no significant enhancement of the line at the proplyd location. Because P159-350 has at least as high as 105 cm-3 as measured by the [C iii] 1909/1907 flux ratio from GO-7514 HST STIS program (PI Rubin) (Henney & O’Dell 1999), it is a likely indication that the uid line emissivity is not strongly enhanced at higher electron density, which may indicate the line is collisionally excited and not a recombination line.
We checked against lists of wavelengths of atomic ions and molecules. For this, the atomic line list provided at www.pa.uky.edu/peter/atomic by Peter van Hoof was a particularly useful resource. There were two ionic lines that were very close to the uid wavelength and that were “reasonable” candidates. The first (best) candidate is: [Cr iii] 2.893490.00020 m ( ) arising from 20851.87 cm-1 (2.6 eV) above ground (Ekberg 1997). Chromium has a solar number abundance log [Cr/H] + 12 = 5.67 (Grevesse & Sauval 1998). The I.P. range for Cr++ is 16.49 – 30.96 eV, which would make Cr++ one of the dominant Cr species in Orion although the fraction of Cr+3 may be higher. However, we do not believe that this [Cr iii] line is a likely identification because there are other [Cr iii] lines for which we have upper limits. These are [Cr iii] 2.778300.00020 m ( ) arising 20995.16 cm-1 above ground; 2.885600.00022 m ( ); and 2.915640.00020 m ( ) arising 20702.45 cm-1 above ground. There was no hint of these lines in various SWS02 bandpasses that we observed covering these 3 other transitions. From the similarity of the levels within the multiplet and J of 0 or -1, it is difficult to understand how the 2.89349 line would be so strong and all the others absent.
The second close coincidence is an [Fe v] line at 2.89340.00075 m ( ) arising from 30430.10 cm-1 above ground. Fe v is isoelectronic with Cr iii. The I.P. range for Fe+4 is 54.8 – 75.0 eV, which is higher than the He++ limit of 54.4 eV. There is a stringent upper limit on the ionizing flux greater than 54.4 eV in Orion by virtue of deep spectroscopy that set a “record” limit on the flux ratio He ii 4686/H 710-5 (Baldwin et al. 2000). Thus, there should be negligible Fe v in Orion.
Our assessment of what ionization range might produce the uid line is that it is likely from a species having a production I.P. between 13.6 and 54.4 eV because it is not seen in the PNs we examined. However the uid line is also not detected in the H ii region M 17 or the low-ionization PNs IC 418 and BD +30 3639. In Orion, the uid line is much stronger in the ionized region and only marginally present (if present at all) in the PDR/molecular/neutral zones. The fact that it is found in only the Orion Nebula reminds one of the uniqueness of proplyds to Orion (at least before they were found in some other nebulae).
There is a reward offered for the correct identification of this uid line. The details were presented at the meeting and will be provided to anyone interested by writing to the first author.
5. Upcoming and Planned IR Missions
In this section, we discuss planned IR spectroscopic capability with a major emphasis on NASA and ESA projects. There are some comparisons with the past projects/missions such as KAO, IRAS, and ISO. With one exception, we do not cover ground-based observatories but do remind the reader of excellent spectroscopic capabilities to be afforded by these facilities (e.g., Gemini North/South, Keck, and the VLTs).
5.1. Space Infrared Telescope Facility (SIRTF)
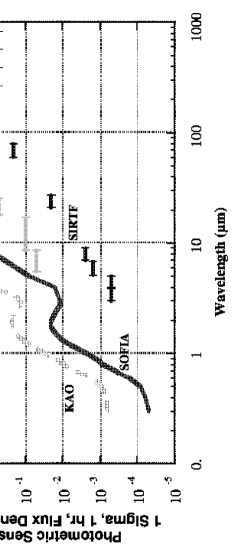
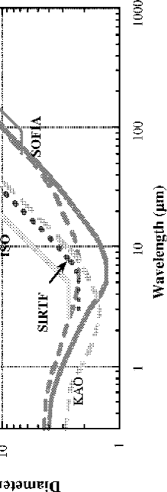
This is a NASA space observatory with an 0.85-m telescope. It will have three cryogenically-cooled instruments. The launch date is expected in July 2002 with a goal of a lifetime in excess of 5 years. SIRTF will be in an Earth-trailing, heliocentric orbit. The main spectroscopic instrument is the Infrared Spectrograph (IRS) (PI Jim Houck). There will be 4 separate modules that cover 5.3 – 40 m at resolution (R) from 60 – 120 (low-R mode) and a higher resolution (R = 600) capability from 10 – 37 m. It will provide a major advance in photometric sensitivity as can be seen in Figure 8 which shows comparisons with KAO, IRAS, ISO, and SOFIA. The angular resolution will be an improvement over ISO but somewhat less than the KAO as is seen in Figure 9. The URL http://sirtf.caltech.edu provides further details.
5.2. Stratospheric Observatory for Infrared Astronomy (SOFIA)
This is a joint project of NASA and the German aerospace center DLR. SOFIA will be the successor to the KAO. The facility is a modified Boeing 747SP airplane with a 2.5-meter telescope. First light is expected in late 2004, with general observing commencing in 2005. The planned lifetime is 20 years and the home base is Moffett Field at the NASA/Ames Research Center.
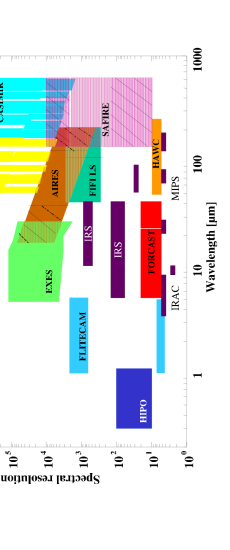
The photometric sensitivity is shown in Figure 8 in comparison with other missions. The angular resolution will be a substantial improvement, especially if the goal (solid curve) is attained (see Figure 9). The complement of First Light Instruments now being built are all listed below, but we describe here only those with medium to high spectral resolution capability. Figure 10 shows the instrument coverage, along with those of SIRTF, in R– space.
CAMERAS: There are 3 facility instruments – HAWC (PI Harper), FORCAST (PI Herter), and FLITECAM (PI McLean). FLITECAM will provide moderate resolution spectroscopy (R 1000 – 2000) from 1 – 5.5 m.
IMAGING PHOTOMETER: There is one Principal Investigator (PI) instrument, HIPO (PI Dunham).
SPECTROGRAPHS: There are one facility instrument, (1) below, and five PI instruments (2)–(6) below –
(1) the Airborne Infrared Echelle Spectrometer (AIRES) (PI Erickson) with ultimate design goals from 17 – 210 m with R 10,000 (higher at 17 m).
(2) the CAltech Submillimeter and far-Infrared MIxing Receiver (CASIMIR) (PI Zmuidzinas) that is a heterodyne receiver which will operate from 250 – 600 m with high spectral resolution.
(3) the Echelon Cross Echelle Spectrometer (EXES) (PI Lacy) – a grating spectrograph that will operate from 5 – 28 m with high (R 105), medium (R 104), and low (R 3000) spectral resolution.
(4) the Field Imaging Far-Infrared Line Spectrometer (FIFI LS) (PI Poglitsch). This will cover from 45 – 210 m with R 1700.
(5) the German Receiver for Astronomy at Terahertz Frequencies (GREAT) (PI Guesten). This is also a heterodyne receiver and will operate from 75 – 250 m with high R.
(6) the Submillimeter And Far InfraRed Experiment (SAFIRE) (PI Moseley). This is an imaging Fabry-Perot bolometer array spectrometer which will operate from 145 – 655 m with an ultimate goal of reaching R = 10,000.
Further details are available via the SOFIA web site athttp://sofia.arc.nasa.gov/
5.3. Herschel Space Observatory (HERSCHEL)
Formerly called FIRST, this is an ESA “Cornerstone Mission” with substantial NASA participation. It consists of a 3.5-m diameter telescope radiatively cooled to 80 K with coverage in the 60 – 670 m range. After launch, expected to be in 2007, it will be positioned to orbit around the Earth-Sun L2 Lagrangian point (located 1.5106 km in the anti-Sun direction from Earth). It is planned to operate for at least three years. There will be three instruments in the helium cooled focal plane: (1) SPIRE, a long-wavelength (200 – 670 m) camera and low-resolution spectrometer; (2) PACS, a short-wavelength (60 – 210 m) camera and low-resolution spectrometer (R1700); and (3) HIFI, a high-resolution (heterodyne) spectrometer (R similar to CASIMIR), that will have contiguous coverage from 240 – 625 m (480 – 1250 GHz) plus a channel from 157 – 213 m (1410 –1910 GHz). NASA is contributing detectors and components for two of the instruments and plans to support US science participation through a US Herschel Science Center at the Infrared Processing and Analysis Center (IPAC). For more detailed information see http://sci.esa.int/home/herschel/
5.4. Planned IR Missions and the US Decadal Report 2001–2010
Recently the latest US Astronomy Decadal Report was published entitled “Astronomy and Astrophysics in the New Millennium” (National Research Council, NRC 2001). This often is referred to as the McKee/Taylor Report after the co-chairs of the Astronomy and Astrophysics Survey Committee. The Report can be accessed on-line at www.nap.edu/books/0309070317/html. Among other things, the report prioritized equipment initiatives (combining ground and space). Before continuing, we note that the committee reaffirmed the recommendations of the prior Survey Committee (NRC, 1991) and endorsed the completion of SIRTF and SOFIA as well as other projects (NRC, 2001, p. 24).
The highest priority of the Major new initiatives is the Next Generation Space Telescope (NGST) (NRC 2001, p. 37). Below we briefly discuss NGST, as well as two other recommendations with major IR spectroscopic promise – the #2 and #7 ranked Major initiatives, the Giant Segmented Mirror Telescope (GSMT) and the Single Aperture Far Infrared (SAFIR) Observatory, respectively.
NGST will be a segmented, filled-aperture 6-m class telescope with a large sunscreen. It will be in an orbit 106 km from Earth to achieve very cold operating temperatures. The goal is for NGST to cover the range 0.6 – 27 m. It is expected to be a factor of 104 – 100 more sensitive than SIRTF (from 4 – 20 m). Spectral resolution is expected to be as high as 5000.
GSMT will be a ground-based, 30-m class telescope. Through adaptive optics, it will have diffraction-limited imaging in atmospheric windows from 1 – 25 m. The full wavelength goal is 0.3 – 25 m. Spectral resolution is expected to be as high as R = 105. Unlike the space observatories planned, it will have the capability of adding new instruments.
SAFIR will be an 8-m class, passively cooled space telescope that is planning to cover the spectrum from 30 – 300 m. It is anticipated to provide 2 to 10 times the spatial resolution of SIRTF, SOFIA, or Herschel. Even more dramatic will be SAFIR’s increase in sensitivity compared with these upcoming missions, reaching several orders of magnitude depending on wavelength (see Fig. 3.2 on p. 103 of NRC 2001). Spectral resolution is expected to be as high as 1000.
6. Summary and Conclusions
With regard to our efforts to derive electron densities, there are several instances of the observed line flux ratio being clearly out of range of the theoretical predictions using current atomic data. This is most dramatically illustrated with the [Ne v] (14.3/24.3) flux ratio for NGC 6818. These are both strong lines observed with signal-to-noise ratios better than 100. The observed flux ratio is 0.707, which is significantly less than the predicted ratio using collision strengths from Lennon & Burke (1994). Because the line ratio near the low- limit depends on collision strengths and not the transition probabilities (A-values), this result may point toward a need to reexamine the collision strengths.
A very rapid benefit of the type of interaction the Conference was to promote occurred in this case. Two participants, Nigel Badnell and Keith Berrington, had made new computations for the Ne v effective collision strengths, including the relevant transitions. The former work had just been published (Griffin & Badnell 2000). Their paper provides the most detailed calculations to date. Their recommended values for each transition are the last entries in their Table 5. In the low- limit, F(14.3)/F(24.3) should scale as (C13/(C12 + C13))(24.3175/14.3217), where C12 = () and C13 = () . The s are the energy level differences and is the Boltzmann constant. For = 10,000 K, this gives a flux ratio 0.8090, while our detailed solution for the 5 lowest levels yields 0.8097. Although not material for this calculation, we did include () (transition between lowest levels 4 and 5) that had been omitted in their publication. The missing entry is 0.545 at 10,000 K (Badnell, private communication). We use the most accurate wavelengths for the two [Ne v] IR lines measured from high spectral resolution ISO observations of a PN (Feuchtgruber et al. 1997) to provide energy levels 2 and 3 in our code. Their paper is a fine example of how astrophysical measurements can actually do better than any laboratory measurement or quantal calculations to determine fundamental atomic data.
The result of using the Griffin & Badnell (2000) s is gratifying, bringing closer agreement with the observations (see Table 6) although the NGC 6818 observed ratio is still smaller than the low- limit for 10,000 K or any reasonable (using adjacent 6,300 and 25,100 K entries in their table 5).
We use CS’s for S iii, Ar iii, and Ar v from Galavis et al. (1995); for Ne iii and Mg v from Butler & Zeippen (1994). As a result of this Conference, we learned of the new calculations of Ne iii CS’s (McLaughlin & Bell 2000). When we use these instead of Butler & Zeippen values, we find that the F(36.0)/F(15.5) ratio in the low- limit, for = 10,000 K, is increased slightly to 0.090. This makes the discrepancy with the observed ratios only slightly less (see Table 4).
Recently Dinerstein (2001) identified two long-standing cases of IR uid lines – at 2.199 and 2.287 m. These were seen in the spectra of PNs (e.g., Geballe, Burton, & Isaacman 1991 and references therein). She identified the former as [Kr iii] –, and the latter as [Se iv] –. The identification of such heavy elements in the IR suggests that there is much future work to be done in the Conference “fields of endeavor”. To extract astrophysical knowledge, e.g., nebular elemental abundances of such species, it will be necessary to observe/identify spectral lines, add to the atomic database for many more heavy elements, and add their treatment to photoionization codes. In addition, there can be expanded diagnostic capability by enlarging the number of ionic species observed that have ground states.
As this work shows, progress in the future will also depend very much on the ability to obtain co-spatial observations of the line pairs in the IR used as an diagnostic. Thus it is important that future astronomical facilities be able to do this and maintain a level of flux calibration sufficient for analyses of electron density, such as we had hoped to perform.
Acknowledgments.
This research was supported by NASA through data analysis grants to the ISO General Observer program and by AURA/STScI grant related to GO-6792. We thank Robin Ellis for help with the ISO data processing and Jackie Davidson for assistance with Figures 8–10. We made use of Richard Shaw’s program at http://ra.stsci.edu/nebular/ionic.html for several of the ions. The atomic line list at www.pa.uky.edu/peter/atomic by Peter van Hoof was also used. RHR acknowledges NASA/Ames Research Center cooperative agreement NCC2-9018 with Orion Enterprises and thanks Scott McNealy for providing a Sun workstation.
References
Alexander, T., et al. 1999, ApJ, 512, 204
Baldwin, J.A., et al. 2000, ApJS, 129, 229
Burkert, A., & O’Dell, C.R. 1998, ApJ, 503, 792
Butler, K., & Zeippen, C.J. 1994, A&AS, 108, 1
Dinerstein, H.L. 2001, ApJ, 550, L223
Ekberg, J.O. 1997, Physica Scripta, 56, 141
Feuchtgruber, H., et al. 1997, ApJ, 487, 962
Galavis, M.E., Mendoza, C., & Zeippen, C.J. 1995, A&AS, 111, 347
Geballe, T.R., Burton, M.G., & Isaacman, R. 1991, MNRAS, 253, 75
Grevesse, N., & Sauval, A.J. 1998, Space Science Reviews, 85, 161
Griffin, D.C., & Badnell, N.R. 2000, J.Phys.B., 33, 4389
Henney, W.J., & O’Dell, C.R. 1999, AJ, 118, 2350
Henry, R.B.C., & Worthey, G. 1999, PASP, 111, 919
Kingdon, J.B., & Ferland, G.J. 1998, ApJ, 506, 323
Kwitter, K.B., & Henry, R.B.C. 1998, ApJ, 493, 247
Lennon, D.J., & Burke, V.M. 1994, A&AS, 103, 273
Liu, X., Storey, P.J., Barlow, M.J., & Clegg, R.E.S. 1995, MNRAS, 272, 369
Liu, X., Storey, P.J., Barlow, M.J., Danziger, I.J., Cohen, M., & Bryce, M. 2000, MNRAS, 312, 585
McLaughlin, B.M., & Bell, K.L. 2000, J.Phys.B., 33, 597
National Research Council (NRC). 1991, “The Decade of Discovery in Astronomy and Astrophysics”, National Academy Press, Washington, D.C.
National Research Council (NRC). 2001, “Astronomy and Astrophysics in the New Millennium”, National Academy Press, Washington, D.C.
O’Dell, C.R., Valk, J.H., Wen, Z., & Meyer, D.M. 1993, ApJ, 403, 678
O’Dell, C.R., & Wen, Z. 1994, ApJ, 436, 194
Peimbert, M. 1967, ApJ, 150, 825
Rubin, R.H. 1989, ApJS, 69, 897
Rubin, R.H., et al. 2000, BAAS, 32, 1398
Rubin, R.H., et al. 1997, ApJ, 474, L131
Rubin, R.H., Simpson, J.P., Lord, S.D., Colgan, S.W.J., Erickson, E.F., & Haas, M.R. 1994, ApJ, 420, 772
Shaver, P.A., McGee, R.X., Newton, L.M., Danks, A.C., & Pottasch, S.R. 1983, MNRAS, 204, 53
Simpson, J.P., Colgan, S.W.J., Rubin, R.H., Erickson, E.F., & Haas, M.R. 1995, ApJ, 444, 721
Stanghellini, L. & Kaler, J.B. 1989, ApJ, 343, 811
van Hoof, P.A.M., Beintema, D.A., Verner, D.A., & Ferland, G.J. 2000, A&A, 354, L41
Viegas, S.M., & Clegg, R.E.S. 1994, MNRAS, 271, 993
Walsh, J.R., & Meaburn, J. 1993, Messenger, 73, 35