A POSSIBLE X-RAY PERIODICITY AT SEVERAL TENS HOURS OF A ULTRA-LUMINOUS COMPACT X-RAY SOURCE IN IC 342
Abstract
A long (155 hours) ASCA observation was performed of two ultra luminous compact X-ray sources, Source 1 and Source 2, in the spiral galaxy IC 342. While Source 1 that was in a hard spectral state varied little, Source 2 that was in its soft spectral state varied significantly on a time scale of about one day. The rms variation amplitude amounts to 5% in the 2–10 keV band, but is less than 4% in 0.7–2 keV. The variation involves statistically significant changes in the parameters describing multi-color disk blackbody emission from this source. The variation is possibly periodic, with a period of either hours or hours. Both are consistent with the orbital period of a semi-detached binary formed by a black hole and a main-sequence star of several tens solar masses. These results reinforce the interpretation of these X-ray objects in terms of accreting massive stellar black holes.
1 Introduction
Ultra Luminous compact X-ray sources (ULXs; Makishima et al. 2000) are objects often seen in off-center regions of nearby spiral galaxies, and exhibit X-ray luminosities by far exceeding the Eddington limit for a neutron star (Fabbiano. 1989; Read et al. 1997; Lira et al. 2000; Roberts & Warwick 2000; Bauer et al. 2001; Fabbiano et al. 2001; Strickland et al. 2001). As reported by many ASCA observers (Colbert & Mushotzky 1999; Kotoku et al. 2000; Makishima et al. 2000 and references therein), the spectra of a majority of ULXs are well fitted by multi-color disk blackbody model (MCD model; Mitsuda et al. 1984; Makishima et al. 1986; Ebisawa et al. 1993). Further considering their high luminosities (), ULXs are hence inferred to be black-hole binaries (BHBs) of 10–100 (Makishima et al. 2000; Mizuno 2000; Kubota et al. 2001). A possible formation scenario of such massive () BHs has been proposed by Ebisuzaki et al. (2001). Alternatively, ULXs may be more ordinary BH (or even neutron star) binaries with mild X-ray beaming (King et al. 2001), although realistic X-ray beaming mechanisms are yet to be worked out.
Through two ASCA observations of the spiral galaxy IC 342, Kubota et al. (2001; hereafter Paper I) discovered that the two ULXs in it, called Source 1 and Source 2 (Fabbiano & Trinchieri 1987), make clear transitions between soft and hard spectral states. Since such a transition is characteristic of Galactic/Magellanic BHBs (e.g., Maejima et al. 1984; Zhang et al. 1997; Wilms et al. 2000), the BHB interpretation of ULXs has been much reinforced. A similar spectral transition was observed from M81 X-9 (La Parola et al. 2001), thought to be a ULX as well.
To conclusively establish the binary nature of ULXs, we in fact need one more step, i.e., to detect their binary periods. Although the standard optical technique (Gies & Bolton 1982; Cowley et al. 1983; for review Cowley et al. 1992) is currently unapplicable to ULXs due to the general lack of their optical identification, we may search their X-ray light curves for possible periodicity. According to the Roche-lobe formula (Eggleton 1983) for a semi-detached binary system and Kepler’s law, the density (g cm-3) of the mass-donating star filling its Roche-lobe is determined by the binary period (hour) as , if the mass-accreting star is more massive than the mass-donating star (Frank et al. 1992). For example, if a ULX indeed consists of a BH of together with a main-sequence companion, we expect hours, because the latter has typically a radius of 10 (i.e., ), although it may finally evolve to a much larger size (De Loore et al. 1978; Weiss 1994; Stothers & Chin 1999). Actually, in NGC 5204, a possible optical counterpart to a ULX has been discovered, and may be considered to be a supergiant O star (Roberts et al. 2001). If the companion mass is instead ( 4 radius), we expect hours. Thus, the orbital periods of such binary systems are expected in the range of several tens of hours.
When the first ASCA observation of IC 342 was conducted in 1993, a significant X-ray variation was detected from Source 1 on the time scale of 10 hours (Okada et al. 1998). However, the total span of that observation ( 22 hours) was too short to examine whether the variation is periodic or not. In this paper, we report timing results on the two ULXs in IC 342, Source 1 and Source 2, based on the one-week ASCA observation conducted in 2000. We have indeed obtained evidence for 31 or 41 hour periodicity from Source 2.
2 Observation and Data Reduction
The present ASCA observation of IC 342, the second one described in Paper I, was carried out from 2000 February 24 00:29 through March 1 21:09 (UT), for a total time span of 557 ks. After screening the data with the standard criteria, we obtained the net exposure of 262 ks with the GIS and 244 ks with the SIS. As already described in Paper I, this observation found Source 1 in the hard spectral state while Source 2 in the soft spectral state. Referring to the X-ray images (Paper I), we accumulated photons over circular regions of radius around the two sources.
3 Results
3.1 Power-density Spectra
Figure 1 shows the GIS and SIS two-band light curves obtained from the two sources. The photon arrival times have been converted to solar barycentric times. The background counts contained in the light curves were evaluated using an off-source region in the image for the GIS and other blank-sky observations for the SIS, respectively, because no off-source region is available in the SIS image. Thus, the background contributes to the light curves. Furthermore, the GIS background is stable within (rms, relative), implying that the background variation is below of the GIS signal counts. The variation of SIS background is known to be similar to that of the GIS. Thus, the background and its variation can be ignored in our subsequent timing study. In figure 1, we can clearly see significant variations on one day time scale in the high-energy light curves of Source 2, consistently with the GIS and SIS data. In contrast, the other light curves appear to be consistent with being constant. Actually, the value of reduced obtained by fitting a linear trend, indicated in Figure 1, is 2.9 and 2.3 for the GIS and SIS high-energy light curves of Source 2, respectively, while it is below 1.5 for the other light curves.
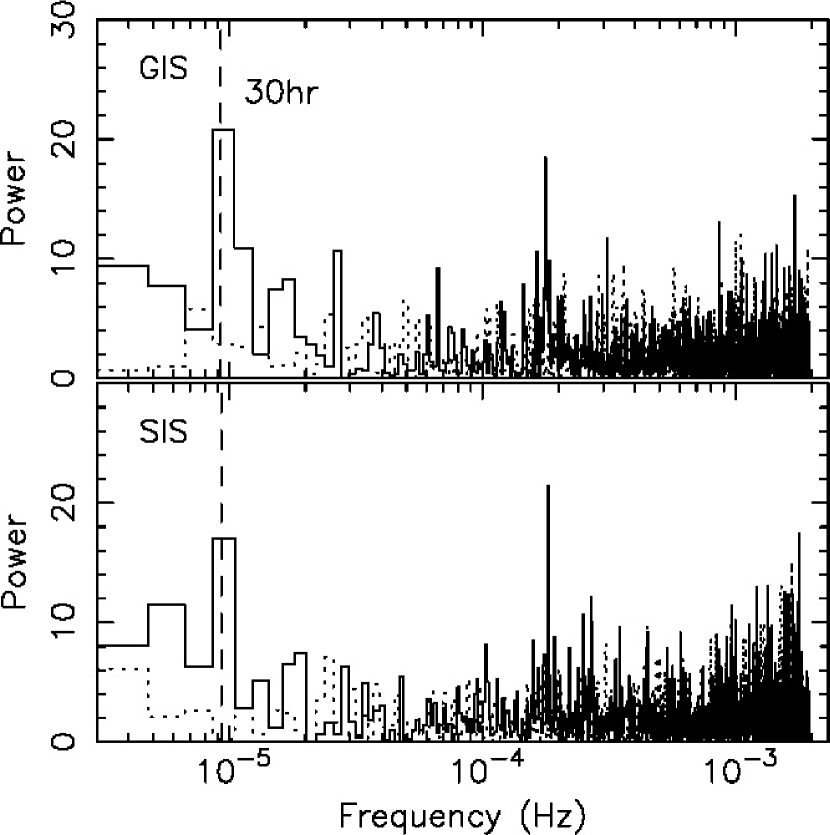
To examine the 2–10 keV GIS and SIS light curves of Source 2 for the periodic behavior, we re-calculated them with a finer bin width of 256 s, and embedded them into a time span of 524 ks = 146 h (2048 bins). We next subtracted the linear trend from the light curves and filled the data gaps with zeros. Using an FFT algorithm, we calculated power density spectra, separately for the two instruments, over a frequency range from Hz ( s ks hours) to Hz ( s). Figure 2 shows the power density spectra of the 2–10 keV GIS and SIS light curves of Source 2, together with that of Source 1 in the same energy band. We thus detect a strong power peak at Hz (period ks hours) from Source 2, both instruments showing consistent results. The chance probability to detect such a strong power below Hz with the two instruments, assuming that the source is varying randomly with the same rms amplitude as the actual data, is estimated by a Monte Carlo simulation to be . The Hz peak is absent in the 2–10 keV data of Source 1 (Figure 2), indicating that the peak is unrelated to background. In the 0.7–2 keV band, neither of the two sources exhibits the Hz peak. Another peak at Hz ( ks) corresponds to the orbital period of ASCA.
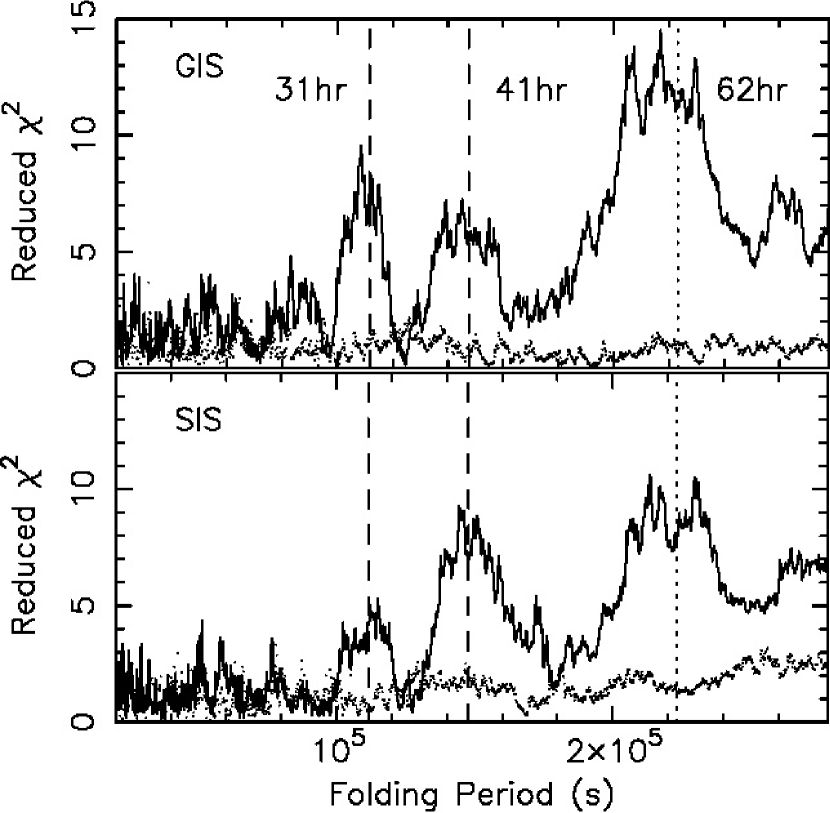
3.2 Epoch-folding analysis
In order to further examine the possible periodicity found in the power-density spectra, we performed standard epoch-folding analysis. That is, we folded the overall light curve (of either GIS or SIS) of Source 2 into 7 bins at various trial periods, and examined the obtained folded light curves against the hypothesis of “being constant” through -evaluation. Figure 3 shows the GIS and SIS periodograms of Source 2, thus calculated in the 2–10 keV band, together with that of Sources 1 obtained in the same way. In the periodograms of both instruments for Source 2, we observe clear peaks at periods of ks ( hours) and ks ( hours). The reduced values are (GIS) and (SIS) for the 31 hour period, and (GIS) and (SIS) for the 41 hour period; their significances are similarly high. These periods are not present in the 2–10 keV periodogram of Source 1 (Figure 3), or 0.7–2 keV periodogram of either source. The peak periods do not depend significantly on the number of bins used in the folding. The double period of 31 hours is also seen at hours. We do not find other significant peaks in the periodograms.
The 31 hour period of Source 2 means about 5 cycles across the total data span, and corresponds to the peak found at Hz in the power density spectra (Figure 2). The 41 hour period, in contrast, corresponds to about 3.8 overall cycles, and its counterpart (to be expected at Hz) is weakly visible in the power density spectra, especially in the SIS data.
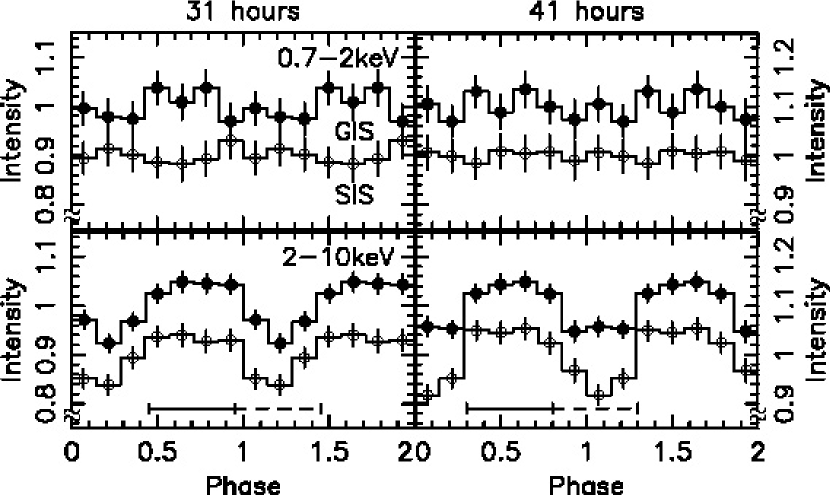
Figure 4 shows the GIS and SIS two-band folded light curves of Source 2, corresponding to the above two candidate periods (31 and 41 hours). Thus, a roughly sinusoidal modulation of 5% amplitude is seen in the high-energy band, whereas the modulation is insignificant in the low-energy band with an upper limit of 4.0% and 3.9% (rms) for the 31 hour and 41 hour periods, respectively. These properties do not differ by a large amount between the two candidate periods.
3.3 Phase-resolved spectra
To investigate spectral changes associated with these periods, we sorted the GIS spectra into two phases (bright and faint) of the modulation, as indicated in Figure 4, separately for the two possible periods. We did not analyze the SIS spectra, since the long-term CCD degradation has made its response uncertain. The obtained phase-resolved GIS spectra for the 31 hour period are presented in Figure 5, together with ratios to the MCD model that best fits the phase-averaged GIS spectrum (Paper I). Thus, the spectrum changes by %, with the change being larger in the harder band.
Similarly to Paper I, we fitted the two phase-resolved GIS spectra successfully with the MCD model. Because the insignificant modulation in lower energies means a constant absorption across the modulation phase, we fixed the absorbing column to cm-2 which was found through the phase-averaged spectral analysis (Paper I). The inset in Figure 5 shows the obtained confidence contours on the plane of the two MCD model parameters, disk temperature and normalization. Thus, the two confidence regions do not overlap with each other, implying that the periodic modulation involves statistically significant changes in the accretion disk condition (the temperature and/or the apparent radius). Although the linear trend shown in Figure 1 has a similar effect, it contributes little ( 1%) to this spectral modulation because the linear trend is averaged out by the folding process. Although Figure 5 refers to the 31 hour period, the 41 hour period yields very similar results.
4 Discussion
During the ASCA long-look observation of IC 342 conducted in 2000, Source 2, in its soft spectral state, varied clearly. The variation has a typical time scale of one day, is more prominent in higher energies, and can be understood as changes in the MCD temperature and/or normalization. These properties are reminiscent of the variation detected in the shorter ASCA observation in 1993 from Source 1, when it was in the high state (Okada et al. 1998). Mizuno (2000) and Mizuno et al. (2001) observed similar variation from several other ULXs in the spectral high state. Thus, a mild intensity variation may be a relatively common phenomenon among high-state ULXs.
Our timing analysis indicates that the Source 2 variation is possibly periodic, with a suggested period of either 31 hours or 41 hours. Of course, we cannot conclude for sure on the cyclic nature of the variation, nor can we distinguish between the two candidate periods, because the time span of the observation covers only 4–5 cycles of the suggested periods. Nevertheless, these values agree with what is expected for the orbital period of a semi-detached binary system consisting of a BH and a massive main-sequence star. Specifically, the vs relation described in § 1 yields a main-sequence star mass of 25 and 50 for 31 and 41 hours, respectively; a lower mass is indicated, if the mass-donating star is evolved and hence has a larger size. However, the BH mass remains rather unconstrained.
If the observed variability of Source 2 really reflects an orbital effect, the phase-dependent spectral changes may be caused, e.g., by an orbital modulation in the mass accreting rate, or eclipses of the inner disk. Actually, based on a 6.4-day observation with RXTE, Boyd et al. (2001) report on a clear high-energy X-ray modulation in LMC X-3 synchronized with its 1.7-day orbital period.
Recently, Bauer et al. (2001) detected a very clear 7.5-hour periodic X-ray variation from a ULX in the Circinus Galaxy. If the period is orbital in origin, the implied system has a few main-sequence star and a BH, assuming that its X-ray luminosity () is close to the Eddington limit without beaming. This source may be a scale-down version of Source 2 in IC 342.
In conclusion, the present results significantly reinforce the interpretation of ULXs as mass-accreting BH binaries.
References
- (1) Boyd, P. T., Smale, A. P., & Dolan, J. F. 2001, ApJ, 555, 822
- (2) Bauer, F. E., Brandt, W. N., Sambruna, R. M., Chartas, G., Garmire, G. P., Kaspi, S., & Netzer, H. 2001, AJ, 122, 182
- (3) Colbert, E. J. M., & Mushotzky, R. F. 1999, ApJ, 519, 89
- (4) Cowley, A. P. 1992, ARA&A, 30, 287
- (5) Cowley, A. P., Crampton, D., Hutchings, J. B., Remillard, R., & Penfold, J. E. 1983, ApJ, 272, 118
- (6) De Loore, C., De Greve, J. P., & Vanbeveren, D. 1978, A&AS, 34, 363
- (7) Ebisawa, K., Makino, F., Mitsuda, K., Belloni, T., Cowley, A., Schmidke, P., & Treves, A. 1993, ApJ, 403, 684
- (8) Ebisuzaki, T., et al. 2001 (astro-ph/0106252)
- (9) Eggleton, P. P. 1983, ApJ, 268, 368
- (10) Fabbiano, G. 1989, ARA&A, 27, 87
- (11) Fabbiano, G., & Trinchieri, G. 1987, ApJ, 315, 46
- (12) Fabbiano, G., Zezas, A., & Murray, S. S. 2001, ApJ, 554, 1035
- (13) Frank, J., King, A., & Raine, D. 1992, Cambridge University Press, Accretion Power in Astrophysics
- (14) Gies, D. R., & Bolton, C. T. 1982, ApJ, 260, 240
- (15) King, A. R., Davies, M. B., Ward, M. J., Fabbiano, G., & Elvis, M. 2001, ApJ, 552, 109
- (16) Kotoku, J., Mizuno, T., Kubota, A., & Makishima, K. 2000, PASJ, 52, 1081
- (17) Kubota, A., Mizuno, T., Makishima, K., Fukazawa, Y., Kotoku, J., Ohnishi, T., & Tashiro, M. 2001, ApJ, 547L, 119 (Paper I)
- (18) Lira, P., Lawrence, A., & Johnson, R. A. 2000, MNRAS, 319, 17
- (19) Maejima, Y., Makishima, K., Matsuoka, M., Ogawara, Y., Oda, M., Tawara, Y., & Doi, K. 1984, ApJ, 285, 712
- (20) Makishima, K., et al. 1986, ApJ, 308, 635
- (21) Makishima, K., et al. 2000, ApJ, 535, 632
- (22) Mitsuda, K., et al. 1984, PASJ, 36, 741
- (23) Mizuno, T. 2000, PhD Thesis, University of Tokyo
- (24) Mizuno, T., Kubota, A., & Makishima, K. 2001, ApJ, 554, 1282
- (25) Okada, K., Dotani, T., Makishima, K., Mitsuda, K., & Mihara, T. 1998, PASJ, 50, 25
- (26) La Parola, V., Peres, G., Fabbiano, G., Kim, D. W. & Bocchino, F. 2001, ApJ, 556, 47
- (27) Read, A. M., Ponman, T. J., & Strickland, D. K. 1997, MNRAS, 286, 626
- (28) Roberts, T. P., & Warwick, R. S. 2000, MNRAS, 315, 98
- (29) Roberts, T. P., Goad, M. R., Ward, M. J., Warwick, P. T. O., Lira, P., & Hands A. D. P. 2001, MNRAS, 325, 7
- (30) Stothers, R. B., & Chen, C. 1999, ApJ, 522, 960
- (31) Strickland, D. K., Colbert, E. J. M., & Heckman, T. M., 2001 (astro-ph/0107115)
- (32) Wilms, J., Nowak, M. A., Pottschmidt, K., Heindl, W. A., Dove, J. B., & Begelman, M. C. 2000, MNRAS, 320, 327
- (33) Weiss, A. 1994, A&A, 284, 138
- (34) Zhang, S. N., Cui, W., Harmon, B. A., Paciesas, W., Remillard, R. E., & van Paradijs, J. 1997, ApJ, 477, L95

f3.eps