The Chandra LETGS high resolution X-ray spectrum of the isolated neutron star RX J1856.5–3754
We present the Chandra LETGS X-ray spectrum of the nearby ( pc) neutron star RXJ1856.5–3754. Detailed spectral analysis of the combined X-ray and optical data rules out the nonmagnetic neutron star atmosphere models with hydrogen, helium, iron and solar compositions. We also conclude that strongly magnetized atmosphere models are unable to represent the data. The data can be explained with a two-component blackbody model. The harder component with temperature of eV and a radius km of the emitting region well fits the X-ray data and can be interpreted as radiation from a hot region on the star’s surface.
Key Words.:
Stars: atmospheres – stars: individual (RX J1856.5–3754): – stars: neutron – X-rays: stars1 The neutron star RXJ1856.5–3754
It was suggested by Walter et al. (Waletal96 (1996)) and supported by Neuhäuser et al (Neuetal97 (1997)) that RXJ1856.5–3754 (or RXJ1856 for short) is an isolated neutron star (NS). It has a strong and non-variable X-ray flux erg s-1 cm-2 and a soft spectrum with a blackbody temperature eV. Thousands of such NSs were expected in RASS (e. g., Colpi et al. Coletal93 (1993); Madau & Blaes MadBla94 (1994)), moving fast through the interstellar medium. Only a few such objects have been found, three of them show pulsations on time-scale of seconds (Haberl et al. Habetal97 (1997), Habetal99 (1999); Hambaryan et al. Hametal01 (2001)). Neuhäuser & Trümper (NeuTru99 (1999)) argued that the number of isolated NSs expected in RASS was overestimated mainly due to unrealistic velocity distributions.
Walter & Matthews (WalMat97 (1997)) and Neuhäuser et al. (Neuetal98 (1998)) found an optical counterpart for RXJ1856 with 26 mag. This and the large proper motion of mas yr-1 (Walter Wal01 (2001); Neuhäuser Neu01 (2001)) are additional arguments that it is indeed an isolated NS. Walter (Wal01 (2001)) also detected parallactic motion, determined the distance to the source pc and suggested that RXJ1856 could be the remnant of the original primary of the Oph system. This implies a NS age of yr.
First spectral modelling of RXJ1856 based on its ROSAT data was presented by Pavlov et al. (Pavetal96 (1996); hereafter P96), who showed that the optical/ flux predicted by NS atmosphere models depends drastically on the surface chemical composition. More recently Pons et al. (Ponetal02 (2002); hereafter P02) have analyzed combined optical and X-ray data and concluded that it may have either a Fe or Si-ash atmosphere. However, the inferred NS radius km and mass are not allowed for any plausible equation of state of the NS inner matter.
RXJ1856 was observed with the Low Energy Transmission Grating Spectrometer (LETGS; Brinkman et al. Brietal00 (2000)). First preliminary results were presented by Burwitz et al. (Buretal01 (2001)). Here we describe the LETGS data (§2), results of spectral (§3) and timing (§4) analysis and discuss implications on the nature of RXJ1856 (§5).
2 LETGS data extraction
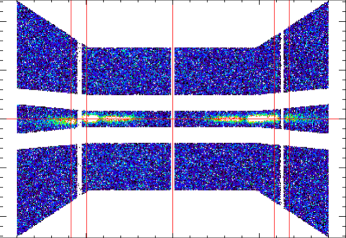
RXJ1856 was observed on March 10, 2000 with the standard LETGS (LETG + HRC-S) configuration in a 56.1 ks exposure. The LETGS spectrum of RXJ1856 was extracted from the level 1.5 event file. The only pulse-height filtering applied to the data was the removal of photons with a pulse-height amplitude equal to 255 as other pulse-height filters do not reduce the background level evenly for all energies. We used the extraction region recommended in the Proposers’ Observatory Guide111 http://asc.harvard.edu/udocs/docs/docs.html [POG]) for extracting the source spectrum (see Fig. 1). For the background, large regions above and below the source extraction area are selected. Towards longer wavelengths 48.4 Å the background regions become wider in order to maintain the constant ratio of areas between source and background spectral bins (here the ratio is equal to 6). The measured dispersed source count rate is 290 6 ks-1 in the 0.15–0.82 keV range (where the source spectrum prevails over the background). The extracted source spectrum (binned in 686 spectral bins) and the most up-to-date effective area tables for the 1st order (status of October 31, 2000)222http://asc.harvard.edu/cal/Links/Letg/User were used for spectral fits.
3 Spectral analysis
To search for spectral lines, we used the method applied by Pavlov et al. (Pavetal01 (2001)) to the dispersed LETGS data on the Vela pulsar. We first binned the extracted source-plus-background and background spectra in 0.02 Å bins. Then we grouped 10–20 sequent bins and estimated the deviation of source counts in each bin of a given group from the mean value in the group. This method revealed maximum deviation at a 2.9 level.
Since there exist the PSPC data ( counts collected in a 6.3 ks exposure), we first checked whether the LETGS and PSPC data yield consistent results in spectral fits. The blackbody fits showed that the allowed domains of the fitting parameters do not formally overlap with each other: eV, km ( pc) and (the uncertainties are given at a 3 level) with for the PSPC data, and eV, km and () for the LETGS data.
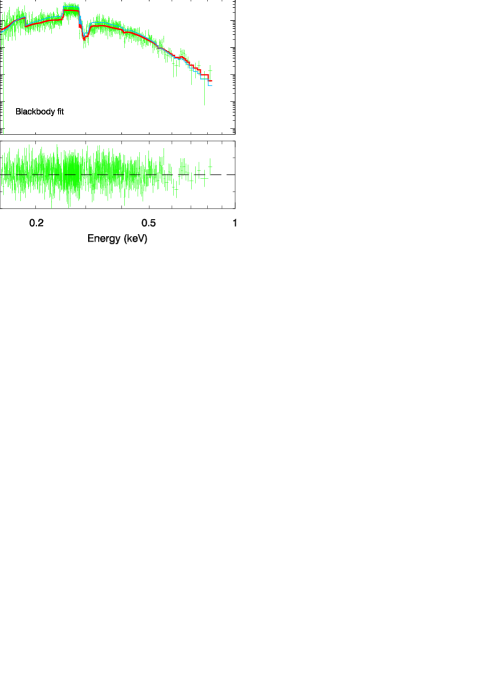
The difference between the blackbody models given by the two fits (see Fig. 2) is most likely attributed to uncertainties in the calibration of LETGS and PSPC.
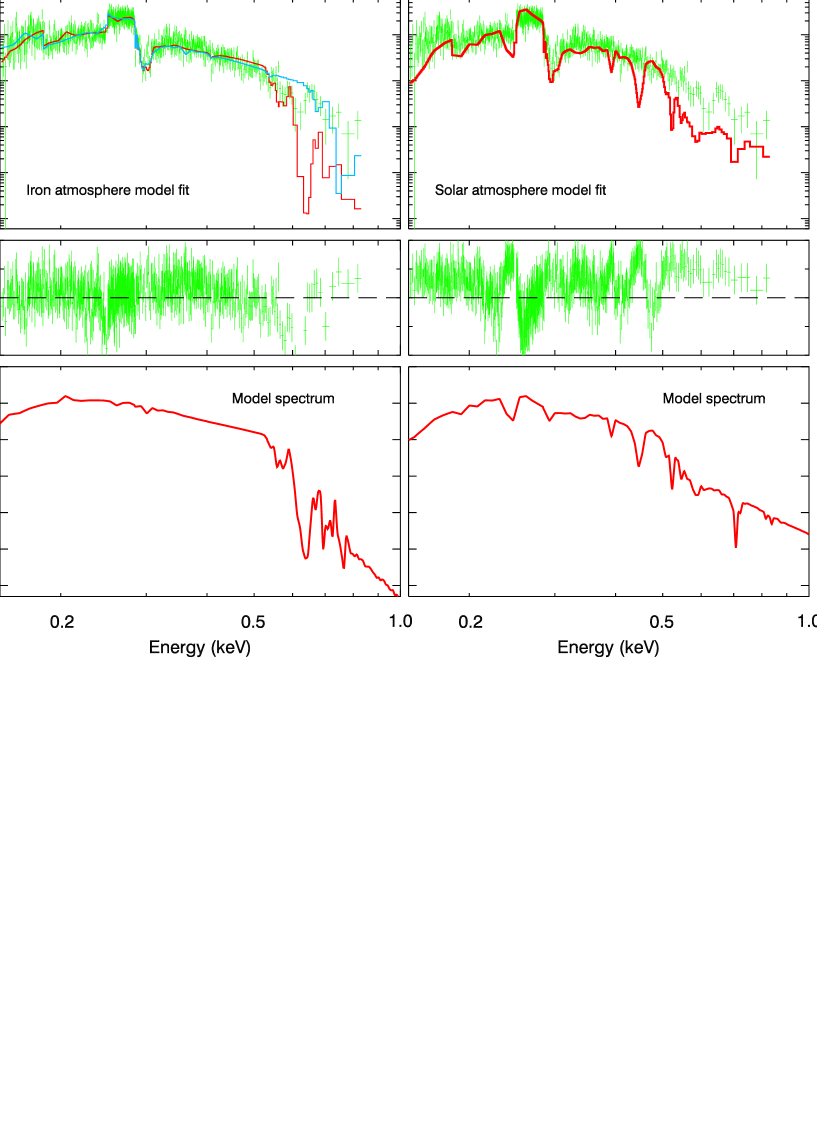
The next step in analysing the LETGS spectrum is to apply NS atmosphere models. The results of P96 and P02 showed that the light element, H and He, nonmagnetic atmosphere models can be firmly ruled out because the models (i) yield too small distances to RXJ1856, pc and (ii) overpredict the optical flux by a factor of 20–30. P02 found that heavier element atmosphere models can be reconciled with the PSPC and optical data at eV, km for pure Fe, and eV, km for Si-ash compositions, assuming the gravitational parameter ( is the Schwarzschild radius)333 For the atmosphere model fits we give parameters as measured at the NS surface, and . Varying resulted in negligible changes in the inferred model parameters unless the strong absorption line at (unredshifted) keV (due to absorption by Fe xviii ions) penetrates in lower (redshifted) energies keV and significantly affects the quality of the PSPC spectral fits. The effects of gravity on the emergent spectra are too small to affect the results of the spectral fits. The fit of the PSPC spectrum with Fe atmosphere models of Pavlov & Zavlin (PavZav00 (2000)) yields pc, eV at km and , that are well consistent with those obtained by P02. Although the LETGS spectrum revealed no statistically significant features, it is worthwhile trying the heavy element atmosphere models on these data. To fit the LETGS data, we fixed the distance at pc and obtained best fitting parameters , eV, km at (see red curves in the left panels of Fig. 3). The model fits well at (redshifted) keV where the atmosphere spectrum shows no strong spectral features. However, the situation is drastically different at the higher energies because of the strong absorption line at keV (see above) of a characteristic width eV and a weaker absorption complex at keV. We note that the LETGS spectrum shows a strong instrumental feature at keV (POG). Despite of a formally small value of obtained in this fit, the deviation between the model and LETGS spectra at keV are large enough to regard the fit as unacceptable. Increasing (i.e. reducing the redshift) does not improve the fit because the absorption lines remain within the observed energy range (see an example of the spectral fit at , km and in the upper left panel of Fig. 3 [blue curve]).
The same strong Fe features are expected to be present in the Si-ash model spectra as Fe composes 68% of the ash (P02). Therefore, the situation with the Si-ash model fit to the LETGS spectrum should be similar to the Fe case. We also applied atmosphere models with a solar composition containing 2% heavy elements (Grevesse & Noels GreNoe93 (1993)). The model spectra show numerous prominent spectral features (mainly due to absorption by Fe, C and O ions) in the whole observed energy range (see right panels in Fig. 3, and also Rajagopal & Romani [RajRom96 (1996)]) which are inconsistent with the LETGS data.
4 Timing analysis
For the timing analysis we used 11,606 counts extracted from a -radius circle centered at the zero-order image (we did not use the dispersed data as they are strongly contaminated by background). We had to restrict the search for a periodical signal at the (upper) frequency Hz because of the time-tag problem (see POG), unrecovered in this observation. As a result, the HRC timing accuracy in this observation was about 4–5 ms (vs. 16 s planned). We applied the standard (Rayleigh) test (Buccheri et al. Bucetal83 (1983)) as well as the method based on the Bayesian statistics (Gregory & Loredo GreLor96 (1996); Zavlin et al. Zavetal00 (2000); Hambaryan et al. Hametal01 (2001)). The frequency range Hz ( s) revealed no statistically significant signals (maximum significance is at a 2.1 level). Assuming a sinusoidal signal, we put an upper limit on its pulsed fraction.
5 Discussion and summary
The most striking result of our LETGS data analysis (extended to the optical range [P96; P02]) is the fact that a simple blackbody model yields a much better fit to the RXJ1856 spectrum than either light or heavy element nonmagnetic atmosphere models. Note that the heavy element models are inconsistent with the high-resolution LETG spectrum. On the other hand, nonmagnetic H/He models do not work either because they predict to high optical fluxes. A remedy may be provided if RXJ1856 has a strong magnetic field as indicated by a bow-shock nebula seen in Hα optical observations (van Kerkwijk & Kulkarni KerKul00 (2000)). Similar to the case with the nonmagnetic models, the magnetized H atmosphere fits result in a too small distance and a too high optical flux (P96). Magnetized Fe atmosphere spectra at eV (Rajagopal et al. Rajetal97 (1997)) reveal a lot of strong absorption features in the 0.1–1.0 keV range which should have been resolved with the LETGS spectral resolution. Hence, we conclude that the available NS atmosphere models cannot represent both the X-ray and optical data on RXJ1856.
Regardless of the chemical composition, radiation emitted from the surface of a magnetized NS should exhibit spectral lines of the electron (at keV) and proton (at eV) cyclotron resonances ( is the strength of magnetic field in units of G). The lack of significant features in the LETGS spectrum (0.15–0.82 keV) may appear to exclude the magnetic fields G and G. But we note that these restrictions on are not very stringent because these lines may be rather faint if the surface layers are only weakly ionized. Besides, nonuniformity of the magnetic field over the surface should lead to a strong smearing of the lines (Zavlin et al. Zav95 (1995)).
Remarkably, the X-ray spectrum of the other isolated NS, RX J0720.4–3125, obtained with XMM-Newton also shows no significant spectral features and is well fitted with a blackbody model of eV (Paerels et al. Paer01 (2001)).
P02 argued that a two-component blackbody model can be reconciled with both the optical and X-ray data on RXJ1856. In this model the hard component of eV is emitted from a fractional area on the NS surface and fits the X-ray data, whereas the soft component of eV represents radiation from the cool surface and matches the optical data. The required non-uniform distribution of the surface temperature may be due to the strong dependance of thermal conductivity of the NS crust on the magnetic field at G (Greenstein & Hartke GreHar83 (1983)). At temperatures eV and magnetic fields G hydrogen (if present on the surface) can be in form of polyatomic molecules and/or a condensed liquid (Lai & Salpeter LaiSal97 (1997)). Although, to our knowledge, no reliable calculations have been done, one may speculate that such a condensed matter surface emits radiation close to the blackbody spectrum at a temperature close to that of the surface, as suggested by Pavlov (P00 (2000))444http://online.itp.ucsb.edu/online/neustars00/pavlov. Then, the two-component blackbody interpretation may be considered as a simplified model of the thermal radiation from such a magnetized and relatively cool NS.
New important information for elucidating the nature of RXJ1856 is expected to come from the forthcoming 50 ks XMM-Newton and 450 ks Chandra observations. They will yield an order of magnitude more counts in the dispersed spectra than in the data presented above. This will allow one to take more advantage of the high spectral resolution. Additionally, the new data would enable an unambiguous detection of X-ray pulsations from the source even if the pulsed fraction is as low as 3%. Once the period is found in the new data, it could be traced back to the earlier ROSAT and Chandra data. This would give estimates on the period derivative and, as consequence, magnetic field and age of RXJ1856. The latter, compared with the estimate derived from the optical observations, would shed more light on the nature of this enigmatic source.
Acknowledgements.
We thank Fred Walter, George Pavlov and Frits Paerels for intensive discussions. This research was supported by Deutsches Zentrum für Luft- und Raumfahrt grant 50 OX 0001.References
- (1) Buccheri, R., Bennett, K., Bignami, G. F., et al., 1983, A&A 128, 245
- (2) Brinkman, A. C., Gunsing, C. J. T., Kaastra, J. S., et al., 2000, ApJ 530, L111
- (3) Burwitz, V., Dennerl, K., Haberl, F., et al. 2001, in X-ray Astronomy 2000, Giacconi R., Stella L., and Serio S. (eds.), ASP Conf. Ser. 234, in press
- (4) Colpi, M., Campana, S., Treves, A., 1993, A&A 278, 161
- (5) Gregory, P. C., Loredo, T. J., 1996, ApJ 473, 1059
- (6) Greenstein, G., Hartke, G. J., 1983, ApJ 271, 283
- (7) Grevesse, N., Noels, A., 1993, in Origin and Evolution of the Elements, Prantzos E., Vaugioni-Flam M. and Gasse M. (eds.), Cambridge Univ. Press, p. 14
- (8) Haberl, F., Motch, C., Buckley, D. A. H., Zickgraf, F.-J., Pietsch, W., 1997, A&A 326, 662
- (9) Haberl, F., Pietsch, W., Motch, C., 1999, A&A 351, L53
- (10) Hambaryan, V., Hasinger, G., Schwope, A., Schulz, N. S., 2001, A&A, submitted
- (11) van Kerkwijk, M., Kulkarni, S., 2000, ESO press release 19/00
- (12) Lai, D., Salpeter, E. E., 1997, ApJ 491, 270
- (13) Madau, P., Blaes, O., 1994, ApJ 423, 748
- (14) Neuhäuser, R., 2001, AN 322, 3
- (15) Neuhäuser, R. & Trümper, J., 1999, A&A 143, 151
- (16) Neuhäuser, R., Thomas, H.-C., Danner, R., Peschke, S., Walter, F. M., 1997, A&A 318, L43
- (17) Neuhäuser, R., Thomas, H.-C., Walter, F. M., 1998, The Messenger 92, 27
- (18) Paerels, F., Mori, K., Motch, C., et al., 2001, A&A 365, L298
- (19) Pavlov, G. G., 2000, Talk at the ITP/UCSB workshop “Spin and Magnetism of Young Neutron Stars”
- (20) Pavlov, G. G., Zavlin, V. E., 2000, in Highly Energetic Physical Processes and Mechanisms for Emission from Astrophysical Plasmas, IAU Symp., Martens P. C. H., Tsuruta S. and Weber M. A. (eds.), v. 195, p. 103
- (21) Pavlov, G. G., Zavlin, V. E., Trümper, J., Neuhäuser, R., 1996, ApJ 472, L33 (P96)
- (22) Pavlov, G. G., Zavlin, V. E., Sanwal, D., Burwitz, V., Garmire, G. P., 2001, ApJ 552, L129
- (23) Pons, J. A., Walter, F. M., Lattimer, J. M., Prakash, M., Neuhäuser, R., An, P., 2002, ApJ 564, in press (P02)
- (24) Rajagopal, M., Romani, R. W., 1996, ApJ 461, 327
- (25) Rajagopal, M., Romani, R. W., Miller, M. C., 1997, ApJ 479, 347
- (26) Walter, F. M., Matthews, L. D., 1997, Nature 389, 358
- (27) Walter, F. M., Wolk, S. J., Neuhäuser, R., 1996, Nature 379, 233
- (28) Walter, F. M., 2001, ApJ 549, 433
- (29) Zavlin, V. E., Pavlov, G. G., Shibanov, Yu. A., Ventura, J., 1995, A&A 297, 441
- (30) Zavlin, V. E., Pavlov, G. G., Sanwal, D., Trümper, J., 2000, ApJ 540, L25