Rapid X-ray flaring from the direction of the supermassive black hole at the Galactic Centre
F. K. Baganoff⋆, M. W. Bautz⋆, W. N. Brandt, G. Chartas, E. D. Feigelson, G. P. Garmire, Y. Maeda, M. Morris§, G. R. Ricker⋆, L. K. Townsley & F. Walter
⋆ Center for Space Research, Massachusetts Institute of
Technology, Cambridge, MA 02139-4307, USA
Department of Astronomy and Astrophysics, Pennsylvania
State University, University Park, PA 16802-6305, USA
Institute of Space and Astronautical Science, 3-1-1
Yoshinodai, Sagamihara, 229-8501, Japan
§Department of Physics and Astronomy, University of California
at Los Angeles, Los Angeles, CA 90095-1562, USA
Department of Astronomy, California Institute of
Technology, Pasadena, CA 91125, USA
Most galactic nuclei are now believed to harbour supermassive black holes1. Studies of stellar motions in the central few light-years of our Milky Way Galaxy indicate the presence of a dark object with a mass of solar masses (refs 2, 3). This object is spatially coincident with Sagittarius A∗ (Sgr A∗), the unique compact radio source located at the dynamical centre of our Galaxy. By analogy with distant quasars and nearby active galactic nuclei (AGN), Sgr A∗ is thought to be powered by the gravitational potential energy released by matter as it accretes onto a supermassive black hole4, 5. However, Sgr A∗ is much fainter than expected in all wavebands, especially in X-rays, casting some doubt on this model. Recently, we reported the first strong evidence of X-ray emission from Sgr A∗ (ref. 6). Here we report the discovery of rapid X-ray flaring from the direction of Sgr A∗. These data provide compelling evidence that the X-ray emission is coming from accretion onto a supermassive black hole at the Galactic Centre, and the nature of the variations provides strong constraints on the astrophysical processes near the event horizon of the black hole.
Our view of Sgr A∗ in the optical and ultraviolet wavebands is blocked by the large visual extinction, magnitudes7, caused by dust and gas along the line of sight. Sgr A∗ has not been detected in the infrared due to its faintness and to the bright infrared background from stars and clouds of dust8. Detection of X-rays from Sgr A∗ is therefore essential to constrain the spectrum at energies above the radio-to-submillimetre band and to test the supermassive-black-hole accretion-flow paradigm5.
We first observed the Galactic Centre on 21 September 1999 with the imaging array of the Advanced CCD Imaging Spectrometer (ACIS-I) aboard the Chandra X-ray Observatory9 and discovered an X-ray source coincident within () of the radio source6. The luminosity in 1999 was very weak, erg s-1 in the 2–10 keV band, after correction for the inferred neutral hydrogen absorption column cm-2. This is far fainter than previous X-ray observatories could detect6.
We observed the Galactic Centre a second time with Chandra/ACIS-I from 26 October 2000 22:29 through 27 October 2000 08:19 (UT), during which time we saw a source at the position of Sgr A∗ brighten dramatically for a period of ks. Figure 1 shows surface plots for both epochs of the 2–8 keV counts integrated over time from a region centred on the radio position of Sgr A∗. The modest peak of the integrated counts at Sgr A∗ in 1999 increased by a factor of in 2000, despite the 12% shorter exposure. The peak integrated counts of the fainter features in the field show no evidence of strong variability, demonstrating that the flaring at Sgr A∗ is intrinsic to the source.
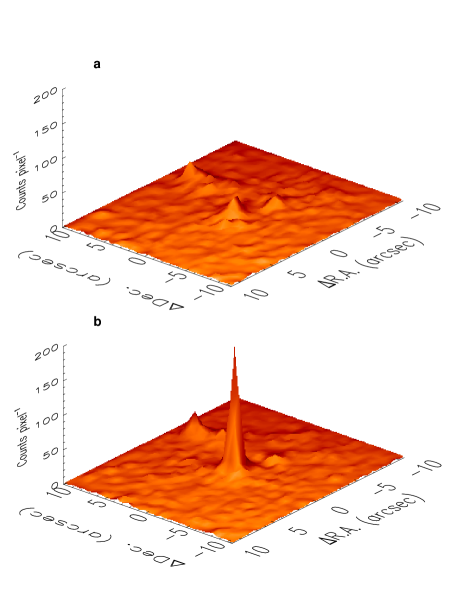
Figure 2 shows light curves of the photon arrival times from the direction of Sgr A∗ during the observation in 2000. Panels (a) and (b) show hard-band (4.5–8 keV) and soft-band (2–4.5 keV) light curves constructed from counts within an angular radius of 15 of Sgr A∗. Both bands exhibit roughly constant, low-level emission for the first ks, followed by an -ks period of enhanced emission beginning with a 500-s event ( significance using 150-s bins). At 20 ks, there occurs a large-relative-amplitude flare or flares lasting ks, and finally a return to the low state for the remaining ks. About 26 ks into the observation, the hard-band light curve drops abruptly by a factor of within a span of s and then partially recovers within a period of ks. The soft-band light curve shows a similar feature, but it appears to lag the hard-band event by a few hundred seconds and is less sharply defined.

The band-ratio time series in panel (c), defined as the ratio of hard-band counts to soft-band counts, suggests the spectrum hardened during the flare. The difference between the band ratio measured at the peak of the flare and the average of the band ratios during the quiescent periods at the beginning and end of the observation is (i.e., ). The peak-flare band ratio in panel (c) is affected to some extent by the effects of pile-up (see Figure 2 caption), which would tend to harden the spectrum; however, the band ratios in panel (d), which were computed using the non-piled-up data extracted from the wings of the point spread function, also show evidence for spectral hardening with significance. The sizes of dust-scattering halos in the Galactic Centre are typically (ref. 10), so dust-scattered X-rays from the source contribute a negligible fraction of the emission within the source extraction region that we used; hence it cannot account for the spectral variations. We therefore conclude that the spectral hardening during the flare is likely to be real.
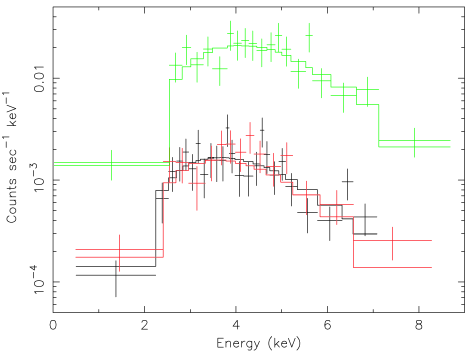
The quiescent-state spectra in 1999 and 2000 and the peak flaring-state spectrum in 2000 are shown in Figure 3. We fit each spectrum individually using a single power-law model with corrections for the effects of photoelectric absorption and dust scattering10. The best-fit values and 90% confidence limits for the parameters of each fit are presented in the first three lines of Table 1. The column densities for the three spectra are consistent, within the uncertainties, as are the photon indices of both quiescent-state spectra. Next, we fit a double power-law model to the three spectra simultaneously, using a single photon index for both quiescent spectra, a second photon index for the flaring spectrum, and a single column density for all three spectra. The best-fit models for each spectrum from the simultaneous fits are shown as solid lines in Figure 3; the parameter values are given in the last line of Table 1. Using these values, we derive an absorption-corrected 2–10 keV luminosity of erg s-1 for the quiescent-state emission and erg s-1 for the peak of the flaring-state emission, or times the quiescent-state luminosity. We note that previous X-ray observatories did not have the sensitivity to detect such a short-duration, low-luminosity flare in the Galactic Centre 6. The best-fit photon index () for the flaring-state spectrum is slightly flatter than, but consistent with, systems thought to contain supermassive black holes11.
| Spectrum | ||||
|---|---|---|---|---|
| 1999 Quiescent | 19/22 | |||
| 2000 Quiescent | 7.6/12 | |||
| 2000 Flaring | 12/17 | |||
| All | 45/55 |
Best-fit parameter values and 90% confidence intervals for power-law models, corrected for photoelectric absorption and dust scattering10. is the neutral hydrogen absorption column in units of H atoms cm-2. and are the photon-number indices of the quiescent-state and peak flaring-state spectra (). is the value of the fit statistic for the best-fit model and is the number of degrees of freedom in the fit. The parameter values for the spectrum marked “All” were derived by fitting an absorbed, dust-scattered, double power-law model to the three spectra simultaneosly (see text and Figure 3).
If we view the outburst as a single event, the few-hundred-second rise/fall timescales and the 10-ks duration are consistent with the light-crossing and dynamical timescales for the inner Schwarzchild radii () of the accretion flow around a black hole of solar masses; here is the radius of the black-hole event horizon (i.e., the boundary at which the escape velocity equals the speed of light), is the gravitational constant, is the mass of the black hole, and is the speed of light. While we cannot strictly rule out an unrelated contaminating source as the origin of the flare (e.g., an X-ray binary, for which little is known about such short-timescale, low-luminosity events as we have detected; W. Lewin, private communication), this explanation seems unlikely since the characteristic angular scales of the young and old stellar clusters around Sgr A∗ are 5–20′′ (ref. 7), whereas the flaring source lies within 1/3′′ of the radio position. These clusters contain up to a million-solar-masses worth of stars and stellar remnants2; hence it is rather improbable that there would be only one very unusual stellar X-ray source in the image and that it would be fortuitously superposed on Sgr A∗. Furthermore, it is not clear that X-ray binaries can be easily formed or long endure near Sgr A∗, given the high velocity dispersion and high spatial density of the stars in its deep gravitational potential well12, 6.
Strong, variable X-ray emission is a characteristic property of AGN; factors of –3 variations on timescales ranging from minutes to years are typical for radio-quiet AGN11. Moderate- to high-luminosity AGN (i.e., Seyfert galaxies and quasars) show a general trend of increasing variability with decreasing luminosity13. However, this trend does not extend to low-luminosity active galactic nuclei (LLAGN), which show little or no significant variability on timescales less than a day14. Assuming the X-ray flare is from Sgr A∗, it is remarkable that this source—generally thought to be the nearest and least luminous example of accretion onto a central supermassive black hole—has shown a factor of variation that is an order of magnitude more rapid than the fastest observed variation of similar relative amplitude by a radio-quiet AGN of any luminosity class15. We note that flares of similar luminosity would be undetectable by Chandra in the nucleus of even the nearest spiral galaxy, M31. LLAGN emit erg s-1 (ref. 14), so it should be kept in mind that the astrophysics of accretion onto even the LLAGN may differ substantially from that of Sgr A∗. This makes Sgr A∗ a uniquely valuable source for testing the theory of accretion onto supermassive black holes in galactic nuclei.
The faintness of Sgr A∗ at all wavelengths requires that the supermassive black hole be in an extremely quiet phase, either because the accretion rate is very low, or because the accretion flow is radiatively inefficient, or both5. A variety of theoretical scenarios, usually based on advective accretion models16, 17, 18, 19, jet-disk models20, or Bondi-Hoyle models21, 22, have developed this idea. An important prediction of the advective accretion models is that the X-ray spectrum in the Chandra energy band should be dominated by thermal bremsstrahlung emission from hot gas in the outer regions of the accretion flow (), but a region this large could not produce the rapid, large-relative-amplitude variations we have seen. Thus, the properties of the X-ray flare are inconsistent with the advective accretion flow models. The low luminosity and short timescales of this event are also inconsistent with tidal disruption of a star by a central supermassive black hole23.
In all models, the radio-to-submillimetre spectrum of Sgr A∗ is cyclo-synchrotron emission from a combination of sub-relativistic and relativistic electrons (and perhaps positrons) spiralling around magnetic field lines either in a jet or in a static region within the inner of the accretion flow. The electron Lorentz factor inferred from the radio spectrum of Sgr A∗ is . If the X-ray flare were produced via direct synchrotron emission, then the emitting electrons would need . For the 10–100 G magnetic field strengths predicted by the models, the cooling time of the particles would be –100 s. Thus, the -ks duration of the flare would require repeated injection of energy to the electrons. On the other hand, if the X-rays were produced via up-scattering of the submillimetre photons off of the relativistic electrons, a process called synchrotron self-Comptonization (SSC), then – would be required, and the cooling time would be of order hours, which is consistent with the duration of the flare. The rapid turn-off of the X-ray emission might then be attributed to the dilution of both photon and electron densities in an expanding plasma.
The X-ray spectra of radio-quiet quasars and AGN are thought to be produced by thermal Comptonization of infrared-to-ultraviolet seed photons from a cold, optically thick, geometrically thin accretion disk by hot electrons in a patchy corona above the disk24, 13. The X-ray spectra of these sources generally soften as they brighten15. In contrast, the extremely low luminosity of Sgr A∗ precludes the presence of a standard, optically thick accretion disk5; hence, the dominant source of seed photons would be the millimetre-to-submillimetre synchrotron photons.
The energy released by an instability in the mass accretion rate or by a magnetic reconnection event near the black hole would shock accelerate the electrons, causing the synchrotron spectrum to intensify and to extend farther into the submillimetre band. Consequently, the Compton up-scattered X-ray emission would harden as the X-ray intensity increased, exactly as observed. We note that the millimetre-band spectrum of Sgr A∗ has been observed to harden during one 3-week flare25 and one 3-day flare26, as would be required by the current SSC models for Sgr A∗ (refs 20, 22).
To test the SSC models, we measured the flux density of Sgr A∗ at a wavelength of 3 mm with the Millimeter Array at the Owens Valley Radio Observatory, simultaneous with part of the 2000 Chandra measurement. Unfortunately, the available observing window (20:10–02:30 UT) preceded the X-ray flare (04:03–06:50 UT) by a few hours. The observed flux density of Sgr A∗ was Jy, consistent with previously reported measures27, 28. Recently, a 106-day quasi-periodicity has been reported in the centimetre band from an analysis of 20 years of data taken with the Very Large Array (VLA)29. A weekly VLA monitoring program detected an % increase in the radio flux density of Sgr A∗ beginning around 24 October 2000 and peaking on 5 November 2000. This increase was seen at 2 cm, 1.3 cm, and 7 mm (R. McGary, J.-H. Zhao, W. M. Goss, and G. C. Bower, private communication). The timing of the X-ray flare and the rise in the radio flux density of Sgr A∗ suggests there is a connection between the two events, providing additional indirect support for the association of the X-ray flare with Sgr A∗ and further strengthening the case that it was produced via either the SSC or direct synchrotron processes. Definitive evidence for these ideas will require detection of correlated variations in the radio-to-submillimetre and X-ray wavebands through future coordinated monitoring projects.
References
- (1) Richstone, D. et al. Supermassive black holes and the evolution of galaxies. Nature 395, A14–19 (1998).
- (2) Genzel, R., Pichon, C., Eckart, A., Gerhard, O. E. & Ott, T. Stellar dynamics in the Galactic Centre: proper motions and anisotropy. Mon. Not. R. Astron. Soc. 317, 348-374 (2000).
- (3) Ghez, A. M., Morris, M., Becklin, E. E., Tanner, A., & Kremenek, T. The accelerations of stars orbiting the Milky Way’s central black hole. Nature 407, 349–351 (2000).
- (4) Lynden-Bell, D. & Rees, M. J. On quasars, dust and the Galactic Centre. Mon. Not. R. Astron. Soc. 152, 461–475 (1971).
- (5) Melia, F. & Falcke, H. The supermassive black hole at the Galactic Center. Annu. Rev. Astron. Astrophys. 39, (in the press).
- (6) Baganoff, F. K. et al. Chandra X-ray spectroscopic imaging of Sgr A∗ and the central parsec of the Galaxy. Astrophys. J. (submitted); also preprint astro-ph/0102151 at xxx.lanl.gov (2001).
- (7) Morris, M. & Serabyn, E. The galactic center environment. Annu. Rev. Astron. Astrophys. 34, 645–702 (1996).
- (8) Menten, K. M., Reid, M. J., Eckart, A. & Genzel, R. The position of Sagittarius A∗: accurate alignment of the radio and infrared reference frames at the Galactic Center. Astrophys. J. 475, L111–L114 (1997).
- (9) Weisskopf, M. C., O’Dell, S. L. & van Speybroeck, L. P. Advanced X-Ray Astrophysics Facility (AXAF). Proc. SPIE 2805, 2–7 (1996).
- (10) Predehl, P. & Schmitt, J. H. M. M. X-raying the interstellar medium: ROSAT observations of dust scattering halos. Astron. Astrophys. 293, 889–905 (1995).
- (11) Mushotzky, R. F., Done, C. & Pounds, K. A. X-ray spectra and time variability of active galactic nuclei. Annu. Rev. Astron. Astrophys. 31, 717-761 (1993).
- (12) Davies, M. B., Blackwell, R., Bailey, V. C. & Sigurdsson, S. The destructive effects of binary encounters on red giants in the Galactic Centre. Mon. Not. R. Astron. Soc. 301, 745–753 (1998).
- (13) Nandra, K., George, I. M., Mushotzky, R. F., Turner, T. J. & Yaqoob, T. ASCA observations of Seyfert 1 galaxies. I. data analysis, imaging, and timing. Astrophys. J. 476, 70–82 (1997).
- (14) Ptak, A., Yaqoob, T., Mushotzky, R., Serlemitsos, P. & Griffiths, R. X-ray variability as a probe of advection-dominated accretion in low-luminosity active galactic nuclei. Astrophys. J. 501, L37–L40 (1998).
- (15) Ulrich, M.-H., Maraschi, L. & Urry, C. M. Variability of active galactic nuclei. Annu. Rev. Astron. Astrophys. 35, 445–502 (1997).
- (16) Narayan, R., Mahadevan, R., Grindlay, J. E., Popham, R. G. & Gammie, C. Advection-dominated accretion model of Sagittarius A∗: evidence for a black hole at the Galactic center. Astrophys. J. 492, 554–568 (1998).
- (17) Quataert, E. & Narayan, R. Spectral models of advection-dominated accretion flows with winds. Astrophys. J. 520, 298-315 (1999).
- (18) Ball, G. H., Narayan, R. & Quataert, E. Spectral models of convection-dominated accretion flows. Astrophys. J. 552, 221–226 (2001).
- (19) Blandford, R. D. & Begelman, M. C. On the fate of gas accreting at a low rate on to a black hole. Mon. Not. R. Astron. Soc. 303, L1–L5 (1999).
- (20) Falcke, H. & Markoff, S. The jet model for Sgr A∗: radio and X-ray spectrum. Astron. Astrophys. 362, 113–118 (2000).
- (21) Melia, F. An accreting black hole model for Sagittarius A∗. II: A detailed study. Astrophys. J. 426, 577–585 (1994).
- (22) Melia, F., Liu, S. & Coker, R. A magnetic dynamo origin for the submillimeter excess in Sagittarius A∗. Astrophys. J. 553, 146–157 (2001).
- (23) Rees, M. J. Tidal disruption of stars by black holes of – solar masses in nearby galaxies. Nature 333, 523–528 (1988).
- (24) Haardt, F., Maraschi, L. & Ghisellini, G. X-ray variability and correlations in the two-phase disk-corona model for Seyfert galaxies. Astrophys. J. 476, 620–631 (1997).
- (25) Tsuboi, M., Miyazaki, A. & Tsutsumi, T. Flare of Sgr A∗ at short millimeter wavelengths. in The Central Parsecs of the Galaxy (ed. Falcke, H. et al.) 186, 105–112 (ASP Conf. Ser., Astron. Soc. Pac., San Francisco, 1999).
- (26) Wright, M. C. H. & Backer, D. C. Flux density of Sagittarius A at millimeters. Astrophys. J. 417, 560–564 (1993).
- (27) Serabyn, E. et al. High frequency measurements of the spectrum of SGR A∗. Astrophys. J. 490, L77–L81 (1997).
- (28) Falcke, H. et al. The simultaneous spectrum of Sagittarius A∗ from 20 centimeters to 1 millimeter and the nature of the millimeter excess. Astrophys. J. 499, 731–734 (1998).
- (29) Zhao, J.-H., Bower, G. C. & Goss, W. M. Radio variability of Sagittarius A∗—a 106 day cycle. Astrophys. J. 547, L29–L32 (2001)
- (30) Reid, M. J. The distance to the center of the Galaxy. Annu. Rev. Astron. Astrophys. 31, 345–372 (1993).
Acknowledgements
We thank M. Begelman for useful comments. This work has been supported by a grant from NASA.
Correspondence and requests for material should be addressed to F.K.B. (e-mail: fkb@space.mit.edu).