Gravitational tidal effects on galactic open clusters††thanks: Plate scanning was done at the Centre d’Analyse des Images (CAI) with M.A.M.A. (Machine Automatique à Mesurer pour l’Astronomie), a facility located at the Observatoire de Paris, developed and operated by INSU (Institut National des Sciences de l’Univers, CNRS). Web site http://dsmama.obspm.fr
We have investigated the 2–D stellar distribution in the outer parts of three nearby open clusters: NGC~2287 ( M41), NGC~2516, and NGC~2548 ( M48). Wide-field star counts have been performed in two colours on pairs of digitized ESO and SRC Schmidt plates, allowing us to select likely cluster members in the colour-magnitude diagrams. Cluster tidal extensions were emphasized using a wavelet transform. Taking into account observational biases, namely the galaxy clustering and differential extinction in the Galaxy, we have associated these stellar overdensities with real open cluster structures stretched by the galactic gravitational field. As predicted by theory and simulations, and despite observational limitations, we detected a general elongated (prolate) shape in a direction parallel to the galactic Plane, combined with tidal tails extended perpendicularly to it. This geometry is due both to the static galactic tidal field and the heating up of the stellar system when crossing the Disk. The time varying tidal field will deeply affect the cluster dynamical evolution, and we emphasize the importance of adiabatic heating during the Disk-shocking. In the case of NGC 2548, our dating of the last shocking with the Plane (based on a tidal clump) is consistent with its velocity. During the 10–20 -oscillations experienced by a cluster before its dissolution in the Galaxy, crossings through the galactic Disk contribute to at least 15% of the total mass loss. Using recent age estimations published for open clusters, we find a destruction time-scale of about 600 Myr for clusters in the solar neighbourhood.
Key Words.:
open clusters and associations: general – open clusters and associations: individual: NGC 2287, NGC 2516, NGC 2548 – stars: Hertzsprung-Russel (HR) and C-M diagrams – Galaxy: kinematics and dynamics1 Introduction
Galactic open clusters (OCs) have long been shown to be extremely valuable laboratories for many domains of astronomy. In particular, observations of their spatial structures can help to constrain dynamical models and -body simulations of small ( 103) stellar systems. Extended over some parsecs, OCs are made up from many dozens to a few thousands stars. Their sparseness makes them short-lived stellar concentrations.
In this manner, most of galactic OCs evaporate entirely in some 108 years: on the 1200 or so objects of this type in the catalogue of open cluster data compiled by Lyngå (lynga87 (1987)), only about 70 are known to be older than 1 Gyr. Indeed, as a result of 2-body relaxation, several stars can acquire positive energy during the strongest (nearest) interactions with other members, and then leave the cluster which slowly vanishes. Stellar evolution (mass loss) and encounters with giant molecular clouds (GMCs, see Wielen wielen91 (1991)) also contribute to noticeably reduce the stellar system lifetime. In addition, the galactic potential plays a major role in the disruption process by its regular gravitational harassment, through tidal disruption.
As a consequence, only the initially richest clusters (which are more gravitationally bound) and those situated at large galactic radii (where the probability of encounter with a GMC is lower) can live a few Gyr. De la Fuente Marcos (fuente98 (1998)) has shown that our Galaxy should host several hundreds of thousands of open cluster remnants which have been disrupted by the Galaxy and by their own dynamical evolution (evaporation). Bica et al. (bica01 (2001)) indeed observe several dissolving star cluster candidates.
Orbits of OCs being quasi-circular, with -oscillations of small ( 1 kpc) amplitude, their trajectory includes many passages through the Disk: each of these gravitational shocks heat up and compress the cluster which then takes a prolate shape flattened to maximum at (Leon leon98 (1998)). Repeated disk-shockings speed up the disruption, as studied in globular clusters (Combes et al. combes99 (1999)) and after each passage through the Plane, members rejected in the halo of the system are stripped out by the gravitational field of the whole Galaxy. These ejected stars will form a tidal tail which extends far from the cluster inner regions. Structural studies of the surroundings of OCs can thus provide much information on the past and present dynamical evolution of the cluster.
Terlevich (terlevich87 (1987)) and de la Fuente Marcos (fuente97 (1997) and references therein) performed realistic simulations of open cluster evolution. From the observational point of view, Grillmair et al. (grillmair95 (1995)) and Leon et al. (leon00 (2000)) detected important tidal tails extensions around galactic globular clusters using a wide-field star count analysis. Leon et al. (leon99 (1999)) also found noticeable tidal tails around several binary star clusters in the Large Magellanic Cloud.
The main aim of this study is to detect such tidal tail signatures in the overall cluster structure around selected galactic OCs, by performing multicolour, wide-field star counts on Schmidt photographic plates. First results are presented in Bergond et al. (bergond01 (2001)). In Sect. 2 we discuss the selection of three open clusters. Section 3 presents the data analysis, and a brief discussion on our observational limitations. In Sect. 4 we focus on each of the three observed OCs. Next, in Sect. 5, we discuss these results together with numerical simulations, and their general implications for galactic open clusters, before summarizing this work in the last section.
2 Open cluster sample
It is expected that tidal tails are very weak stellar overdensities, and to better detect them it is necessary to reject at maximum areas with strong background variations due to a differential interstellar extinction. A hole of extinction can indeed artificially enhance the star-count in this more transparent area, giving the impression of a higher density of stars which we could mistake for a tail. For this reason, we have made a first selection, restricting our choice to the few OCs which present 10° (see Janes & Adler janes82 (1982) for the galactic distribution of OCs). Such high latitudes allow us to avoid the major part of dust clouds which are generally well concentrated along the Plane 0, with a mean scale height of 16020 pc (Pandey & Mahra pandeymahra87 (1987)).
However, the extinction within the Plane is highly variable from one direction to another, and there are windows of transparency, especially between 210° and 240° (Chen et al. chen98 (1998)). The whole map of dust emission (as traced by IRAS 100 m) in these directions is visible in Fig. 1 where we have overplotted all the known OCs in the Lyngå (lynga87 (1987)) catalogue.
We had yet to select relatively rich clusters in order to perform a reliable star-count analysis. Very poor OCs do not offer a sufficient contrast with respect to the field stars, and may be only asterisms, that is apparent concentrations of stars due to a pure perspective effect (e.g., Baumgardt baumgardt98 (1998)). At last, the cluster must have the appropriate dimensions: too small clusters are difficult to treat with the typical scale on Schmidt plates (671/mm) due to limitations in resolution of emulsions and diffusion problems in crowded areas, whereas really too wide clusters like Melotte 111 (Odenkirchen et al. odenkirchen98 (1998)) cannot be studied on one single deg2 plate.
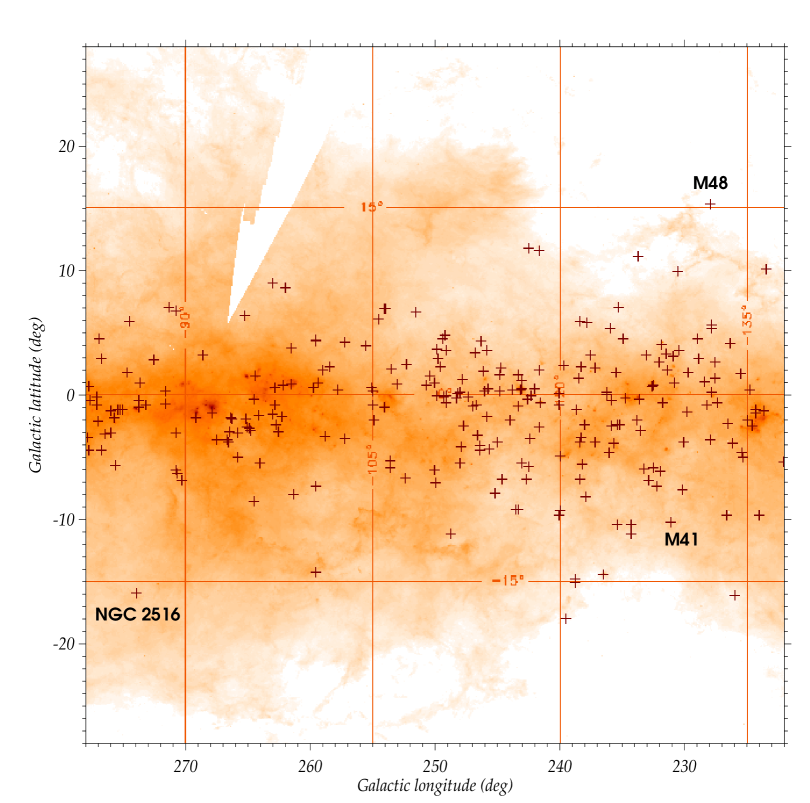
We finally selected as the most interesting candidates 3 rich, bright and low-absorbed OCs: NGC 2287 ( M41), NGC 2516, and NGC 2548 ( M48). Table 1 presents the pairs of photographic plates we scanned for this study and Table 2 summarizes the main properties of these OCs.
| Cluster | Plate | Emuls. | Filter | Exp. | Epoch |
|---|---|---|---|---|---|
| NGC | ID # | Kodak | used | min | |
| 2287 | SRC557 | IIIaJ | GG395 | 60 | 1979.898 |
| 2287 | ESO557 | IIIaF | RG630 | 60 | 1985.930 |
| 2516 | E11031 | IIIaJ | GG385 | 15 | 1994.117 |
| 2516 | E11190 | IIIaF | RG630 | 15 | 1994.444 |
| 2548 | SRC775 | IIIaJ | GG395 | 60 | 1986.246 |
| 2548 | SRC775 | IIIaF | OG590 | 70 | 1985.057 |
| 2548 | SRC776 | IIIaJ | GG395 | 60 | 1983.192 |
| 2548 | SRC776 | IIIaF | OG590 | 70 | 1985.953 |
| Cluster | Dist | Rad. | Mass | Age | Spect.-type | [Fe/H] | ||||||
|---|---|---|---|---|---|---|---|---|---|---|---|---|
| name | J2000.0 | J2000.0 | II | II | pc | pc | pc | M☉ | Myr | on turn-off | dex‡ | mean |
| NGC 2287 | 06469 | 20°44′ | 23110 | 1023 | 693 | 123 | 4.1 | 294 | 243 | B5 | 0.04 | 0.03 |
| NGC 2516 | 07583 | 60°52′ | 27394 | 1588 | 409 | 112 | 1.9 | 170 | 113† | B3 | 0.06 | 0.10 |
| NGC 2548 | 08138 | 05°48′ | 22792 | 1537 | 769 | 204 | 4.8 | N/A | 360 | A0 | 0.08 | 0.03 |
3 Data analysis
All the plates were digitized with a resolution of 10 m with the Machine Automatique à Mesurer pour l’Astronomie (MAMA, see Berger et al. berger91 (1991)). Source extraction was done using the SExtractor software (Bertin & Arnouts bertin96 (1996)), at a 3-level for each pair of plates. Once the astrometry was performed in each colour, local software was used for the cross-correlation of the and catalogues.
This allows us to build a colour-magnitude diagram (CMD), in instrumental magnitudes, for the whole plate. Next, we adopt the method described by Grillmair et al. (grillmair95 (1995)), which consists of selecting regions in the CMD where the “cluster vs. field contrast” is important. For this purpose, we use a so-called colour-magnitude S/N function defined by subdividing the CMD in multiple cells (50 50 bins here, i.e. about 0.1 mag both in and ). We refer to the papers of Leon et al. (leon99 (1999), leon00 (2000)) for details of the application of the method. We then retain only cells where the number of cluster members with respect to the field stars is the highest, by defining a threshold we choose as a compromise between significant star-count (in order to prevent background fluctuations) and reduced contamination by field stars.
In the case of relatively nearby clusters, it is possible to use a direct “cut” in magnitude in the whole star count, selecting only the brightest sources. Most of weak field stars are then directly eliminated, whereas only the bottom of the OC main sequence (that is, most of late-type dwarf members) is missing. Keeping only bright OC members to minimize pollution also obviously decreases the number of detected stripped stars from the cluster, which are preferentially low mass stars, as noted both from observations (Leon et al. leon00 (2000)) and simulations (e.g., Combes et al. combes99 (1999)), but the S/N of the tidal tails relative to the background/foreground stars will be higher due to the richness of the three selected clusters.
The three OCs we have chosen being nearby systems (with a distance to the Sun in the range – kpc), we have applied cuts in instrumental magnitudes corresponding on average to about . Using the “universal” mass function of Kroupa (kroupa01 (2001)), this implies that we may miss about 90% of the theoretical cluster total mass (see Fig. 2). Note however that Scalo (scalo98 (1998)) claimed that a universal mass function is not justified empirically for stars with masses less than 1 . Recent theoretical studies (Lastennet & Valls-Gabaud lastennet99 (1999)) also tend to show that open cluster IMFs present some variations (which may be due to mass segregation effects, see the discussion in Sect. 5) below 1.1–1.2 .
Therefore, estimates of the fraction of the cluster mass we observed are accordingly subject to non-negligible variations, and the Kroupa (kroupa01 (2001)) IMF may rather be an average of possibly locally different IMFs, as already observed even for intermediate-mass stars in OCs (e.g., Phelps & Janes phelps93 (1993) or Sanner & Geffert sanner01 (2001)).

After this first selection from the mask in the CMD diagram (for example, see Fig. 3) which on average keeps 1500 likely members on the whole field, we need to pay attention to a remaining background (Milky Way) gradient in the wide-field encompassing the OC. Following Grillmair et al. (grillmair95 (1995)), as a first step we mask the cluster, up to 1 or 2 times its estimated tidal radius . The hidden cluster is then replaced by the mean density value just outside it (i.e., from 1.5 to 2.5). The background is next smoothed using a fit by a bivariate polynomial surface:
| (1) |
A simple 1 1 bivariate polynomial is generally sufficient, except near the Galactic Plane – as it is often the case for OCs – where a degree 2 is preferable in order to follow the exponential increase of field stars towards galactic latitude zero. A higher order polynomial is not applicable, as it may erase similar scale variations such as the tidal tails we are seeking. Then, we obtain a raw map of overdensities by subtracting the Milky Way gradient from the count of likely members of the cluster:
| (2) |
where is the surface density of CMD-selected stars.
At this point, we use the wavelet analysis (see Leon et al. leon99 (1999), leon00 (2000)). This method makes use of the so-called “à trous” algorithm (Bijaoui bijaoui91 (1991)). Relatively fast, it decomposes by a discrete wavelet transform (WT) the raw image in several planes where is the scale of the plane, using a -spline function. This kernel function is used for the recursive convolutions of the initial image. If we note as the raw image of overdensities just obtained, we have successively:
| (3) | |||||
| (4) | |||||
| (5) |
Each of the planes corresponds to a certain image resolution: while orders like 5 or 6 retain only “out of focus” features, the lower orders give the finest details. In fact, the last plane – often known as LSP for Last Smoothed Plane – is not in the literal sense a true wavelet plane, but contains the residuals of the last convolution. However, we will consider it like the other planes, giving a total number of 7 scales. This value has proved to be a good compromise between computing time and the maximal resolution we need.
Finally, having obtained all the wavelet planes , we can construct the best map to recover overdensities around the cluster by adding several wavelet planes. We have chosen to select only large scale planes related to the tidal tails sizes: the best results are obtained using planes from order 3 to the LSP (i.e., order 7 in our decomposition). The final map of tidal tails will then be defined as in Leon et al. (leon00 (2000)) by the sum:
| (6) |
This choice was also made in order to obtain a good compromise between resolution and background noise.
4 Results
| Cluster | (mas) | (mas/yr) | (mas/yr) | |
|---|---|---|---|---|
| NGC2287 | 1.930.49 | 8 | 4.340.40 | 0.090.40 |
| NGC2516 | 2.770.25 | 13 | 4.080.27 | 10.980.24 |
| NGC2548 | 1.630.79 | 5 | 0.500.70 | 0.930.65 |
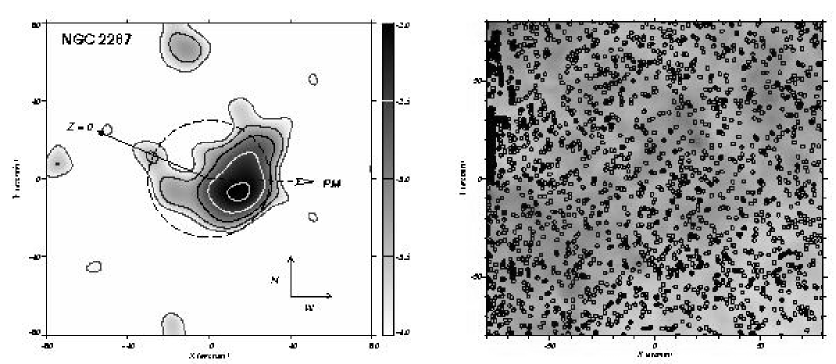
4.1 NGC 2287 ( M41)
This bright, intermediate-age OC was particularly studied for proper motions (Ianna et al. ianna87 (1987)), radial velocities (Amieux amieux88 (1988)) and spectrophotometric properties (Harris et al. harris93 (1993)). For the present wide-field structural study of the cluster, we found that a cut at an instrumental () mag. of 14 offered the maximum cluster contrast with respect to the field. Using a plate calibration based on the GSPC-II, it is equivalent to . Given a distance to NGC 2287 of about 700 pc and the low absorption in this direction (see Table 2), the cut corresponds to main sequence stars of about , hence masses of the order of 0.9 . The main sequence brightest selected stars have 9, i.e. mass greater than 3 . Taking the IMF of Kroupa (kroupa01 (2001)) within these limits, our selection of members may represent only of the total cluster mass.
Despite this limitation, the overall structure observed for NGC 2287 (cf. Fig. 4, left) corresponds relatively well to what is expected: a global elongated shape nearly parallel to the Galactic Plane (i.e., from SSE to NNW) with projected axis ratios estimated to 1.5 : 1.0, and with extensions perpendicular to it (the arrow points perpendicularly towards 0, a clump of density is visible in this direction). The dashed arrow indicates the proper motion (PM, see Tab. 3) of the OC, and the dashed circle traces the cluster extension (radius estimated to ) as given in Table 2.
The “pollution map” (see Fig. 4, right) shows no obvious clusters of galaxies and no anticorrelation between the tidal tails and the IRAS 100 m map (dust absorption) which could bias the source count. Otherwise, it is clearly visible in Fig. 4 (left) that the star count peak is shifted by about 15′ SW from the center of the field, i.e. the “classical” coordinates of NGC 2287 given in catalogues are incorrect.
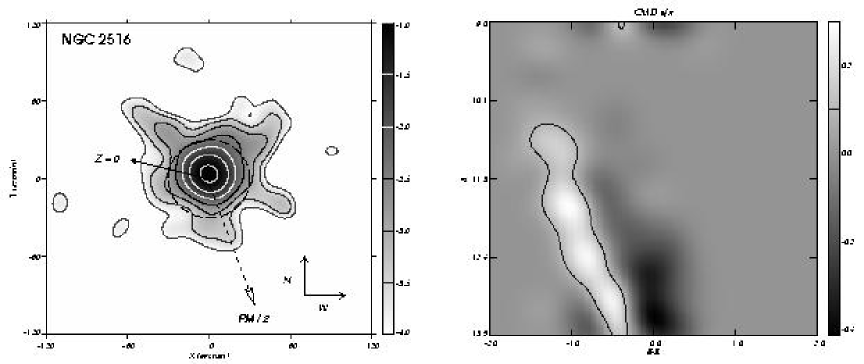
4.2 NGC 2516
Eggen (eggen74 (1974)) detected several members up to 5 pc from the cluster center and described NGC 2516 as the Southern Pleiades. Indeed, this very bright and rich cluster shares a common age and absolute galactic motion with M45. NGC 2516 contains many variable stars and is ideal to look for low-mass and active stars. It is also an essential cluster in the calibration of the IFMR (Initial Final Mass Relation) as it contains several white dwarfs.
Among the numerous studies of this spectacular OC, the one by Dachs & Kabus (dachs89 (1989)) is complete up to , over a relatively wide-field. They propose a total cluster mass of about 1000 .
An efficient cut at an instrumental magnitude of 13.5 was done, as the cluster is particularly nearby (350 pc, see Robichon et al. robichon99 (1999)). After cross-identification with the catalog of Dachs & Kabus (dachs89 (1989)), this cut corresponds to main sequence stars brighter than or . In terms of mass, the cut retains only stars with . The brightest CMD-selected stars have () or 2.5–3 . The integration of the Kroupa (kroupa01 (2001)) IMF within these limits shows that we could miss nearly 90% of the cluster potential mass, even if, as discussed in Sect. 3, variations in the mass function just below our cut may significantly change the number of unstudied members.
Despite this low percentage in mass of selected members, in Fig. 3 (left), two remarkable tails extend up to 1.5° from the cluster center, nearly perpendicularly to the Galactic Plane (the arrow points towards ). It is interesting to note the almost perfect circular geometry of the central parts of NGC 2516, despite the ideal location () of this OC for observation of the predicted flattening by the radial galactic force gradient (see the discussion in Sect. 5).
Except for a strong emission point north of the cluster (corresponding to the “Toby jug” nebula IC 2220), the extinction due to dust is homogeneous, and no clumps in background galaxies correlate with the position of tails. Hence, no observational bias can account for the presence of these huge tidal extensions.
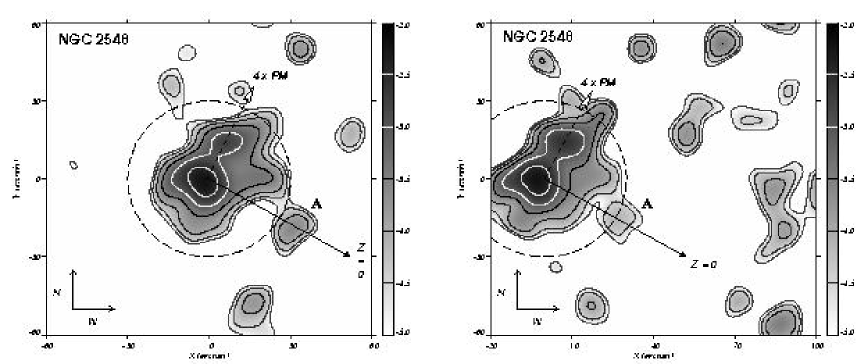
4.3 NGC 2548 ( M48)
Despite being a bright cluster, NGC 2548 (later identified as the entry #48 in the Messier’s catalogue) has not been studied recently. Here, we have used two pairs of blue and red survey plates, in order to check against possible variations in the sensitivity of the photographic emulsion which may bias the star-counts. No such effect was found. The OC is situated near the E border of the first pair (ESO/SRC 775) and on the W border of the 2nd (ESO/SRC 776). Despite these locations on the plates, the tidal tail extraction has proved consistent as shown on Fig. 5.
For the two pairs of plates including NGC 2548, we have chosen a strong cut, keeping only stars brighter than the instrumental magnitude 13.0 (corresponding to about 14.8 using a rough calibration based on GSPC-I standard stars), or . Again, we keep only stars more massive than about 1–1.1 . Interestingly, the inner isodensity levels show a secondary peak (double core). The projected axis ratio is around 1.7 : 1.0. The absorption in the region of the OC is very low (see Table 2) and uniform. Numerous extended sources were detected but no cluster of galaxies can account for the overall prolate shape and the SW tidal extension.
5 Discussion
Theoretical considerations (Wielen wielen75 (1975)) have shown that the haloes of open clusters are flattened by the galactic gravitational field. Indeed, the gradient of the gravitational force in the galactic radial direction is stretching the OC: simulations (Terlevich terlevich87 (1987); Portegies Zwart et al. portegies01 (2001)) confirm that OCs take the shape of an ellipsoid with axes in a ratio . The longest axis always points towards the Galactic Center whereas the smaller one is in the direction. This compressed shape has been observed only in a few clusters. In the Hyades, a flattening along the Galactic Plane was first suspected by Oort (oort79 (1979)). Perryman et al. (perryman98 (1998)) recently confirmed, in their exhaustive study of the 3-D structure of this fundamental “calibrator” cluster, the prolate shape of the halo, which is well elongated towards the Bulge. In the Pleiades, a similar elongated shape roughly in the direction was detected by van Leeuwen (vanleeuwen83 (1983)) and definitively established by Raboud & Mermilliod (1998a ).
It has been shown as well (Leon leon98 (1998)) that the disk-shocking compresses strongly the stellar cluster during the crossing of the galactic Plane. In the case of OCs, the heating is very efficient from the adiabatic component which includes the short period stellar orbits relative to the crossing time through the Plane. Figure 6 shows the contribution of the adiabatic heating which is maximum for typical open cluster central densities pc-3 (e.g., Binney & Tremaine binney87 (1987)).
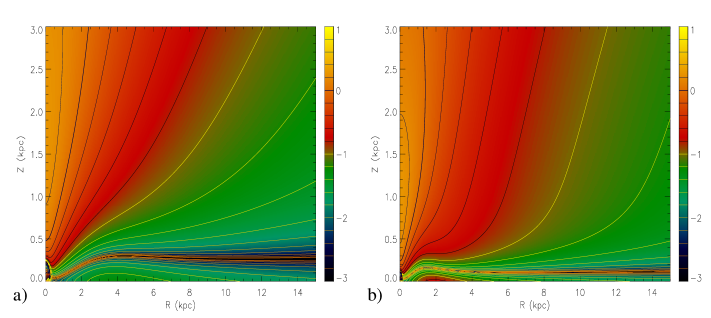
To quantify the effects of the vertical and radial (parallel to the Disk plane) tidal forces, we show in Fig. 7 the ratio of these two tidal components for a rather rich OC having a pc tidal radius. The galactic models are from Combes et al. (combes99 (1999)): the main difference is the scale height of the Disk which is set to 1 kpc for the Gal–1 model and 400 pc for the Gal–2 model, leading to a major contribution of the vertical tidal force in the latter case owing to a larger gradient due to the thinner disk.
However, the vertical component of the static tidal force is less important than the radial one, except on top of the Bulge where the radial component, in our model, is very weak. For a typical open cluster range, the vertical/radial ratio of the tidal force components is between 1% to 10%. Nevertheless the shock due to the time-dependent tidal force will induce a major heating of the OC crossing the Plane. Interestingly the vertical tidal force is stronger at very low-, where the open cluster population is mainly located, to decrease to a minimum, for a constant galactic radius, at pc (Gal–2 model) and increases towards higher where the vertical component from the Bulge and the whole Disk takes over.

Hence, in addition to the static tidal field, all OCs suffer repeated disk-shockings with the galactic Plane. Indeed one typical open cluster at the solar radius crosses the Plane about 10–20 times before its dissolution in the Galaxy (see below), only leaving an OC remnant (de la Fuente Marcos fuente98 (1998)). For most of existing clusters, we expect to observe clumps of stars disrupted from the disk shocking, in the direction perpendicular to the Galactic Plane. These clumps should have a velocity (relative to the OC center of mass) close to the velocity dispersion in the cluster. In an OC of 500 like the Hyades (evolved intermediate-age cluster, like NGC 2548), the velocity dispersion is about 0.2–0.4 km s-1 (de Bruijne et al. debruijne01 (2001)).
| Object | |||||||
|---|---|---|---|---|---|---|---|
| NGC | kpc | kpc | pc | pc | km/s | km/s | km/s |
| 2287 | 7.95 | 8.97 | 130 | 870 | 25 | 9 | 80 |
| 2516 | 5.60 | 8.54 | 120 | 200 | 2 | 24 | 5 |
| 2548 | 7.43 | 8.99 | 160 | 420 | 37 | 5 | 43 |
-
†
is the maximum height that the open cluster is supposed to reach above (or under) the Galactic Plane.
We can interpret the SW clump (noted A in Fig. 5) around NGC 2548, in the direction of the Plane, as a remnant of the last disk-shocking. Given the distance of the clump to the center of NGC 2548 of about 8 pc and taking a typical velocity dispersion of 0.3 km s-1, we estimate the last shock finished 26 Myr ago. On the other hand, following Dachs & Kabus (dachs89 (1989)), the period of the -oscillations of an open cluster is given by:
| (7) |
where is the galactic vertical acceleration at the maximum height the OC can reach. We use the acceleration values given by Vergely et al. (vergely01 (2001)), based on recent estimates of the disk scale height pc and surface mass density pc-2, whereas the local mass density is taken as pc-3.
The results of the compilation of the absolute motions of the three clusters by Piatti et al. (piatti95 (1995)) are shown in Table 4. In the case of NCG 2548 however, different values were found recently by Wu et al. (wu01 (2001)). These authors deduced km s-1 from an exhaustive proper motion survey, with pc (taking the nearby distance estimate of pc, see Claría claria85 (1985)).
Using the and values of Piatti et al. (piatti95 (1995)), we can estimate that the last crossing of NGC 2548 through the Galactic Plane finished about 40 Myr ago, whereas taking the data of Wu et al. (wu01 (2001)) the last shock occurred 20 Myr ago. Both results are consistent with our dating derived from the clump. We note that with an age of about 360 Myr (see Table 2), NGC 2548 is a dynamically evolved OC which has already suffered about 7 or 8 disk-shockings.
It has also been shown (Leon leon98 (1998); Combes et al. combes99 (1999)) that during the disk-shocking the shape of the cluster will change rapidly before the relaxation, which is never reached for an OC constantly oscillating in the Plane. The difference in shape between NGC 2516 (round core) and both NGC 2287 & NGC 2548 (pronounced prolate shape) can be accounted for a transient phase during the shock. It could also be due to effects of encounters with passing molecular clouds which can reduce, or randomize the orientation of the flattening (see Theuns 1992a , 1992b ).
In order to estimate the importance of the disk-shocking in the evolution of the OCs, we have performed -body simulations. We used the so-called perturbation particles method (Leeuwin et al. leeuwin93 (1993)). To solve the collisionless Boltzmann equation, this technique combines an analytical description of the equilibrium state and a numerical evaluation of the local density perturbation. Indeed perturbation particles are well suited for a collisionless system, and can be used for simulating a disk-shocking because the relaxation time of the cluster is still larger than the crossing time. The simulated cluster is modeled by a Plummer’s sphere for which the gravitational potential and the distribution function are known analytically (e.g., Leon leon98 (1998)).
We stress that our simulations are only aimed at giving an estimation of the mass loss. In particular, we have not included the effect of binarity and mass segregation. Binary stars, primordial or exchanged, seem to be less important for the evolution of rich clusters like those considered in our models (see de la Fuente Marcos fuente96 (1996)) and may be regarded as more massive stars, hence defering the problem to that of mass segregation.
Furthermore, the perturbation particles method does not take into account the mass segregation process, but during one crossing this latter will be slow (see Combes et al. combes99 (1999)). The spatial mass function is certainly different between the core and the outskirts of the cluster (e.g., Raboud & Mermilliod 1998b ). However, during a crossing the tidal effects are independent of the stellar masses. As a result, ignoring the mass segregation is not expected to strongly bias the total mass of the tidal tail (only the mass function will be different, with an excess of low mass stars).
We have followed an OC starting at 600 pc (see Fig. 8) above the Plane at the solar galactic radius with a total mass of 1000 and a core radius of 1 pc. We have chosen such a high- cluster to avoid strong gradient at the beginning of the simulation. Old “survivors” like M67 (Fan et al. fan96 (1996)) or NGC 188 (Sarajedini et al. sarajedini99 (1999)) have total masses of this order, and follow such high- orbits (see Carraro & Chiosi carraro94 (1994)). Figure 9 shows that the OC mass loss by the disk-shocking is about 1.5% of its total mass in one -oscillation. It can be noticed that some stars are re-bound to the cluster after the crossing.
Despite the lower intensity of the static -tidal force relative to the radial one, the time-dependent -tidal force during the crossing strongly speeds up the destruction of the OC. The global contribution of the disk-shocking can be estimated to be about 10 to 20% for such a high- cluster, and likely more for a younger open cluster which experiences stronger -force gradients in the vicinity of the Plane (see above). We can try to relate this mass-loss to the mean life duration of open clusters in the Galaxy.


Using a pre-release of the catalogue of Loktin et al. (loktin01 (2001)) available on the Base des Amas web database, we show in Fig. 10 the age distribution of the 423 open clusters in their sample. As mentioned above, OCs suffer different destructive processes (disk-shockings, encounters with GMCs, tidal field harassment) which lead to the rapid depletion of the whole population. It appears that the population age, excluding both very young ( yr) and very old ( Gyr) OCs, can be modeled by an exponential law of the following form (see the fit in Fig. 10):
| (8) |
where is a time-scale for OCs (primarily in the solar neighbourhood, as catalogues become incomplete for distant clusters) which corresponds to their destruction time-scale. Assuming a constant star-formation rate over the last 109 years in the solar neighbourhood (e.g., Rocha-Pinto et al. rocha00 (2000)), the OC destruction time-scale is of the order of yr, somewhat superior to previous observational estimates (Lyngå lynga82 (1982); Janes & Phelps janes94 (1994)). Selection effects in different Galactic OCs catalogues may explain this small discrepancy. Interestingly, the value of 600 Myr is in good agreement with the OC disintegration time in the field defined by Kroupa (kroupa95 (1995)) in its realistic simulations.
As stated before, in the solar neighbourhood, disk shocking seems to be very important in the destruction of OCs. An OC at the solar radius suffers about ten to twenty crossings during this time-scale, which leads to an upper-limit for the mass loss efficiency during one disk-crossing between 5 to 10%. This value is clearly more important than for globular clusters (Leon leon98 (1998)) which are much more massive and concentrated stellar aggregates.

6 Conclusions
We have detected important tidal extensions around 3 bright open clusters using photometric selection on wide-field photographic plates. Density isophotes of cluster probable members go further away from the ordinary limits given for these objects. In two cases (NGC 2287 & NGC 2548) we have observed strong flattening of the cluster that we interpret as a consequence of the disk-shocking. We stress that the adiabatic heating is important for the open cluster evolution, as well as the time varying galactic field. In spite of the weakness of the static -tidal force field, the time varying tidal field during the disk-shocking will indeed affect deeply the dynamical evolution of OCs. Its effects, computed with the perturbation particles method, account for about 20% of the mass loss. We also estimate the destruction time-scale of open clusters in the solar neighbourhood to 600 Myr. In the case of NGC 2548, it has been possible to estimate that the last shocking with the Galactic Plane occurred about 30 Myr ago. This value should be confirmed by a complete proper motion and radial velocities study. Advent of super-MOS (e.g. Flames) and, at medium-term, Gaia will provide hundreds of and very accurate proper motions even for low-mass members of known OCs. Moreover, accurate multi-band, deep wide-field CCD photometry of a sample of open clusters will provide much better selection of members, including sub-solar mass stars. The comparison of these new observations with more realistic simulations will be the subject of forthcoming papers.
Acknowledgements.
Special thanks to R. Chesnel and P. Toupet for plate scanning and pre-reduction. S. L. was supported in part by the Deutsche Forschungsgemeinschaft (DFG) via grant SFB 494, by special funding from the Science Ministry of the Land Nordrhein-Westfalen. We gratefully acknowledge F. Combes and F. Leeuwin for invaluable discussions. Many thanks to O. Bienaymé and Wu et al. for having kindly provided their results before publication. Finally, we are indebted to an anonymous referee for his/her suggestions and comments which helped to improve this paper.References
- (1) Amieux, G. 1998, A&AS, 76, 305
- (2) Baumgardt, H. 1998, A&A, 340, 402
- (3) Baumgardt, H., Dettbarn, C., & Wielen, R. 2000, A&AS, 146, 251
- (4) Berger, J., Cordoni, J.-P., Fraingant, A.-M., Guibert, J., Moreau, O., Reboul, H., & Vanderriest, C. 1991, A&AS, 87, 389
- (5) Bergond, G., Guibert, J., Leon, S., & Vallenari, A. 2001, in ASP Conf. Ser. 228, Dynamics of Star clusters and the Milky Way, ed. S. Deiters, B. Fuchs, A. Just, R. Spurzem, & R. Wielen, 386, in press
- (6) Bertin, E., & Arnouts, S. 1996, A&AS, 117, 393
- (7) Bica, E., Santiago, B. X., Dutra, C. M., Dottori, H., de Oliveira, M. R., & Pavani, D. 2001, A&A, 366, 827
- (8) Bijaoui, A. 1991, in 3rd ESO/ST-ECF Data Analysis Workshop, Garching, The Wavelet Transform, 3
- (9) Binney, J., & Tremaine, S. 1987, Galactic Dynamics (Princeton University Press)
- (10) Bruch, A., & Sanders, W. L. 1983, A&A, 121, 237
- (11) de Bruijne, J. H. J., Hoogerwerf, R., & de Zeeuw, P. T. 2001, A&A, 367, 111
- (12) Carraro, G., & Chiosi, C. 1994, A&A, 288, 751
- (13) Chen, B., Vergely, J.-L., Valette, B., & Carraro, G. 1998, A&A, 336, 137
- (14) Claría, J. J. 1985, A&AS, 59, 195
- (15) Combes, F., Leon, S., & Meylan, G. 1999, A&A, 352, 149
- (16) Dachs, J., & Kabus, H. 1989, A&AS, 78, 25
- (17) Eggen, O. J. 1974, ApJ, 188, 59
- (18) Fan, X., Burstein, D., Chen, J.-S., et al. 1996, AJ 112, 628
- (19) de la Fuente Marcos, R. 1996, A&A, 314, 453
- (20) de la Fuente Marcos, R. 1997, A&A, 322, 764
- (21) de la Fuente Marcos, R. 1998, A&A, 333, L27
- (22) Grillmair, C. J., Freeman, K. C., Irwin, M., & Quinn, P. J. 1995, AJ, 109, 2553
- (23) Harris, G., Fitzgerald, M., Mehta, S., & Reed, B. 1987, AJ, 106, 1533
- (24) Ianna, P. A., Adler, D. S., & Faudree, E. F. 1987, AJ, 93, 347
- (25) Janes, K. A., & Adler, D. S. 1982, ApJS, 49, 425
- (26) Janes, K. A., & Phelps, R. L. 1994, AJ, 108, 1773
- (27) Jeffries, R. D., Thurston, M. R., & Pye, J. P. 1997, MNRAS, 287, 350
- (28) Kroupa, P. 1995, MNRAS, 277, 1522
- (29) Kroupa, P. 2001, MNRAS, 322, 231
- (30) van Leeuwen, F. 1983, PhD dissertation (Sterrenwacht Leiden)
- (31) Lastennet, E., & Valls-Gabaud, D. 1999, Rev. Mex. Astron. Astrofis., 8, 115
- (32) Leeuwin, F., Combes, F., & Binney, J. 1993, MNRAS, 262, 1013
- (33) Leon, S., 1998, PhD dissertation (Observatoire de Paris)
- (34) Leon, S., Bergond, G., & Vallenari, A. 1999, A&A, 344, 450
- (35) Leon, S., Meylan, G., & Combes, F. 2000, A&A, 359, 907
- (36) Loktin, A. V., Gerasimenko, T. P., & Malisheva, L. K. 2001, A&AT, in press
- (37) Lyngå, G. 1982, A&A, 109, 213
- (38) Lyngå, G. 1987, Lund Catalogue of Open Clusters (5th edition, CDS Strasbourg)
- (39) Mermilliod, J.-C. 1995, in Information & On-Line Data in Astronomy, Eds. D. Egret and M. A. Albrecht (Kluwer Academic Press), 127
- (40) Meynet, G., Mermilliod, J.-C., & Maeder, A. 1993, A&AS, 98, 477
- (41) Odenkirchen, M., Soubiran, C., & Colin, J. 1998, NewA, 3, 583
- (42) Oort, J. H. 1979, A&A, 78, 312
- (43) Pandey, A. K., Bhatt, B. C., & Mahra, H. S. 1987, Ap&SS, 129, 293
- (44) Pandey, A. K., & Mahra, H. S. 1987, MNRAS, 226, 635
- (45) Perryman, M. A. C., Brown, A. G. A., Lebreton, Y., Gómez, A., Turon, C., Cayrel de Strobel, G., Mermilliod, J.-C., Robichon, N., Kovalevsky, J., & Crifo, F. 1998, A&A, 331, 81
- (46) Phelps, R. L., & Janes, K. A. 1993, AJ, 106, 1870
- (47) Piatti, A. E., Claría, J. J., & Abadi, M. G. 1995, AJ, 110, 2813
- (48) Portegies Zwart, S., McMillan, S. L. W., Hut, P., & Makino, J. 2001, MNRAS, 321, 199
- (49) Raboud, D., & Mermilliod, J.-C. 1998, A&A, 329, 101
- (50) Raboud, D., & Mermilliod, J.-C. 1998, A&A, 333, 897
- (51) Robichon, N., Arenou, F., Mermilliod, J.-C., & Turon, C. 1999, A&A, 345, 471
- (52) Rocha-Pinto, H. J., Scalo, J., Maciel, W. J., & Flynn, C. 2000, A&A, 358, 869
- (53) Sanner, J., & Geffert, M. 2001, A&A, 370, 87
- (54) Sarajedini, A., von Hippel, T., Kozhurina-Platais, V., & Demarque, P. 1999, AJ, 118, 2894
- (55) Scalo., J. M. 1998, in ASP Conf. Ser. 142, The IMF revisited – A case for variations, ed. G. Gilmore, & D. Howell, 201
- (56) Terlevich, E. 1987, MNRAS, 224, 193
- (57) Theuns, T. 1992a, A&A, 259, 493
- (58) Theuns, T. 1992b, A&A, 259, 503
- (59) Vergely, J.-L, Freire, R., Egret, D., & Bienaymé, O. 2000, A&A submitted
- (60) Wielen, R. 1975, in Dynamics of stellar systems, ed. A. Hayli (Dordrecht), 119
- (61) Wielen, R. 1991, in ASP Conf. Ser. 13, The Formation and Evolution of Star Clusters, ed. K. Janes, 343
- (62) Wu, Z. Y., Tian, K. P., Balaguer-Núñez, L., Jordi, C., Zhao, J. L., & Guibert, J. 2001, A&A, submitted