The Local Ly Forest. III. Relationship between Ly Absorbers
and Galaxies, Voids and Superclusters
111Based on observations with the NASA/ESA Hubble Space Telescope,
obtained at the Space Telescope Science Institute, which is operated
by the Association of Universities for Research in Astronomy, Inc.
under NASA contract No. NAS5-26555.
Abstract
In this paper, we use large-angle, nearby galaxy redshift surveys to investigate the relationship between the 81 low-redshift Ly absorbers in our HST/GHRS survey and galaxies, superclusters, and voids. In a subsample of 46 Ly absorbers located in regions where the February 8, 2000 CfA catalog is complete down to at least galaxies, the nearest galaxy neighbors range from kpc to Mpc. Of these 46 absorbers, 8 are found in galaxy voids. After correcting for pathlength and sensitivity, we find that % of the Ly absorbers lie in voids, which requires that at least some low-column density absorbers are not extended halos of individual bright galaxies. The number density of these clouds yields a baryon fraction of % in voids.
The stronger Ly absorbers () cluster with galaxies more weakly than galaxies cluster with each other, while the weaker absorbers () are more randomly distributed. The median distance from a low- Ly absorber in our sample to its nearest galaxy neighbor (kpc) is twice the median distance between bright galaxies in the same survey volume. This makes any purposed “association” between these Ly absorbers and individual galaxies problematic. The suggested correlation between Ly absorber equivalent width () and nearest-galaxy impact parameter does not extend to 200 mÅ, or to impact parameters kpc. Instead, we find statistical support for the contention that absorbers align with large-scale filaments of galaxies. The pair of sightlines, 3C 273 and Q 1230+0115, separated by 0.9° on the sky, provides an example of 8 absorbers and 7 galaxies aligned along a possible filamentary structure at least 20 Mpc long. While some strong ( mÅ) Ly absorbers may be gas in the extended gaseous halos of individual galaxies, much of the local Ly “forest” appears to be associated with the large-scale structures of galaxies and some with voids.
1 Introduction
Since the discovery of the high-redshift Ly forest over 25 years ago, these abundant absorption features in the spectra of QSOs have been used as evolutionary probes of the intergalactic medium (IGM), galaxy halos, large-scale structure, and chemical evolution. In the past few years, these discrete Ly lines have been interpreted theoretically by N-body hydrodynamical models (Cen et al., 1994; Hernquist et al., 1996; Zhang et al., 1997; Davé et al., 1999) as arising from baryon density fluctuations associated with gravitational instability during the epoch of structure formation.
Most previous studies of the low- IGM (Bahcall et al., 1993; Jannuzi et al., 1998; Weymann et al., 1998) have been performed with the Faint Object Spectrograph (FOS) aboard the Hubble Space Telescope (HST). These studies, in general, characterized the Ly absorbers with rest-frame equivalent widths () greater than 0.24 Å. These studies detected some features with , but, because of sensitivity function considerations, performed most of their Ly statistics for . A great deal more information can be gained from studying the more numerous weak Ly lines, using the moderate-resolution first-order gratings (19 km s-1) on the HST spectrographs, either the G160M grating on the Goddard High Resolution Spectrograph (GHRS) or the Space Telescope Imaging Spectrograph (STIS) with medium resolution first-order gratings. With these instruments, the Colorado group has engaged in a long-term program to study the very low redshift () Ly forest. In Paper I (Penton, Stocke, & Shull, 2000a) we described our GHRS/G160M observations and presented a catalog of Ly absorbers toward 15 extragalactic targets. We detected 81 “definite” Ly absorbers at a significance level and 30 additional “possible” absorbers at in the redshift range over a total pathlength = 116,000 km s-1 (= 0.387). In Paper II (Penton, Shull, & Stocke, 2000b) we described the physical properties of these Ly absorbers and compared them to their high-redshift counterparts.
An important result from Paper II is that the number density of absorbers per unit redshift rises sharply at Ly rest-frame equivalent widths ( for Doppler parameter ; see Figure 8 in Paper II). This corresponds to a region in column density probed only by observations made with the GHRS or STIS and medium resolution first-order or echelle gratings. Both the column density distribution and its evolution with redshift suggest that these lowest column density clouds are a population physically distinct from those at higher column density, as has been widely discussed for the high- Ly forest for some time (e.g., Sargent, 1987). The two-point correlation function (TPCF) of local Ly absorbers has no excess power over a random distribution except for , where a modest excess of close pairs is observed (Figure 21 in Paper II, and Impey, Petry & Flint 1999; hereafter IPF99). As we show in § 6, the Ly TPCF has a much lower amplitude than the galaxy-galaxy TPCF at =0.
Several previous investigations used the detection of relatively nearby Ly absorbers to determine whether a physical relationship exists between Ly absorbers and galaxies. Using HST Key Project data (Bahcall et al., 1993; Jannuzi et al., 1998), Lanzetta et al. (1995, L95 hereafter) proposed that most, if not all, low- Ly absorbers arise in extended halos of galaxies. This claim, limited to those absorbers detected in FOS data ( Å), was based upon an observed inverse correlation between and the impact parameter from the QSO sightline to the nearest galaxy. An extension of the L95 work by Chen et al. (1998, C98 hereafter) strengthened the observed inverse correlation but found little evidence that this correlation depended on any other galaxy property, aside from galaxy luminosity. This is contrary to what would be expected if the size of the gaseous galaxy halo were due to internal properties or structures in the galaxies (e.g., star formation rate and thus galaxy color, Hubble type, etc.). In the most recent work by this group (Chen et al., 2001), the authors conclude that all galaxies, regardless of Hubble type or recent star formation history, possess extensive gaseous halos of near unity covering factor; e.g., an galaxy has a halo extent of 260 kpc. We assume a Hubble constant of =70 km s-1 Mpc-1 throughout the paper. The limitations of the L95 and C98 work are that their sample was based on only the strongest absorbers at low , and that they did not consider absorbers for which no nearby galaxy was detected. Based upon a detection of a nearby galaxy in only about 1/3 of the cases, L95 and C98 extrapolate their result to all nearby Ly absorbers, assuming that absorbers for which no nearby galaxy was detected are associated with galaxies too faint to be discovered using their survey.
Tripp, Lu, & Savage (1998a) and Stocke et al. (1995) claim that neither of the C98 extrapolations are justified and that the absence of correlations with other galaxy properties argues against the “galaxy halo” model. Numerical simulations (Davé et al., 1999) are able to reproduce the L95 inverse correlation without extended galaxy halos, because it arises from the presence of both galaxies and Ly absorbers within the same large-scale filaments. Therefore the connection suggested by L95 may be only coincidental, not physical or causal. The simulations also suggest that weaker absorption lines will be found farther from galaxies and will fail to show the inverse correlation seen for the stronger absorbers, as has been observed (Stocke et al. 1995; Tripp, Lu, & Savage 1998a; IPF99).
By using Ly lines detected with the GHRS, Morris et al. (1993), Stocke et al. (1995), Tripp, Lu, & Savage (1998a), Grogin & Geller (1998), and IPF99 investigated the relationship between weak Ly absorbers and galaxies. The better far-UV sensitivity of the GHRS allowed these studies to detect absorbers at substantially lower redshifts and thus much nearer than typical Key Project detections (i.e., at compared to ). The superior GHRS resolution allowed the detection of much weaker absorbers ( Å for the low-resolution grating studies of Tripp, Lu, & Savage (1998a) and IFP99 and Å for the medium-resolution studies of Morris et al. (1993) and this work) albeit over shorter pathlengths than the Key Project data.
None of these studies found any compelling evidence for a close association between galaxies and absorbing clouds. On the contrary, the initial study of Morris et al. (1993) along the sightline to 3C 273, found nearest bright-galaxy neighbors at 200 kpc, with some nearest galaxies more than 1 Mpc away from some clouds. Followup scrutiny of the nearest of these clouds, in the southern extremities of the Virgo Cluster at =1000–1600 km s-1, failed to find any galaxies within 100-150 kpc of these absorbers down to impressively low limits (; Rauch, Weymann & Morris 1996). These include low surface brightness galaxies, as would be detected optically at central surface brightness limits of mag arcsec-2 (Rauch, Weymann, & Morris, 1996) or by 21 cm emission (; van Gorkom et al., 1993). Substantiating these results, Stocke et al. (1995) and Shull et al. (1996) found some nearby, low-, Ly absorbers in “voids” in the bright CfA galaxy redshift survey regions, with nearest bright galaxies several Mpc distant. Because both the brighter and the fainter galaxies “avoid the voids”, these authors concluded that at least some local Ly absorbers were not associated with galaxies at all. A nearest-neighbor galaxy analysis using the bright survey data suggested that, while these low column density absorbers do not cluster with galaxies as strongly as galaxies cluster with other galaxies, neither are they randomly distributed. They are slightly closer to galaxies than would be expected by chance. This result confirmed the earlier statistical results of Morris et al. (1993), using the 3C 273 sightline (see Mo & Morris, 1994, for an analysis of this result in terms of several populations of clouds, some closely associated with galaxies, some not at all associated). Stocke et al. (1995) suggested that these results are compatible with 2/3 of these absorbers being associated with large-scale structures (“filaments”) in the galaxy distribution with the remaining absorbers distributed entirely randomly. The much lower amplitude in the TPCF of these low- absorbers, compared to the galaxy TPCF, is consistent with the filament interpretation (IPF99, Paper II).
More recently, Grogin & Geller (1998, GG98 hereafter) used a small number (18) of Ly absorbers found in the region of the CfA galaxy redshift survey to determine that Ly absorbers are found at locations random with respect to galaxy density. Their smoothing kernel of 2–5 Mpc allowed them to reconstruct a robust measure of Galactocentric galaxy density, compared to using the nearest-neighbor galaxy distance, which is prone to biases due to the magnitude limits of the galaxy survey employed. However, these smoothing lengths may be too large to assess accurately the possible physical association between absorbers and large-scale structure suggested by earlier work. IPF99 addressed this difficulty by determining both nearest-neighbor distances and smoothed galaxy densities for 11 Ly absorbers in the Virgo supercluster region using a galaxy survey complete to . This impressive work finds that, while there is some bias in using nearest-neighbor distances to galaxies, the distances to fainter galaxies () are still too large (240-1320 kpc for all but one absorber) to be considered as galaxy halos. Further, when smoothed using 2 Mpc spheres, Ly absorbers are found in intermediate, not random, regions of galaxy density, supporting earlier speculations to this effect by Mo & Morris (1994) and Stocke et al. (1995). While IFP99 is the most comprehensive study of the relationship between Ly absorbers and galaxies to date, it is still limited by the small number of absorbers studied (11) and the location of these absorbers within the Virgo supercluster region alone.
In this paper (Paper III), we use the 81 Ly absorbers, whose discovery was reported in Paper I and analyzed in Paper II, in conjunction with currently available galaxy redshift survey data to explore the relationship between the low- Ly absorbers and bright galaxies. These sightlines are scattered across the sky, with only two targets behind the Virgo supercluster (3C 273 and Q 1230+0115). Our analysis uses the nearest-neighbor galaxy distribution of our absorber sample and also looks for correlations between the Ly absorbers and large-scale galaxy structures (supercluster filaments and voids) that these galaxy surveys reveal. In § 2, we describe our Ly sample and the galaxy catalog, which is based on the February 8, 2000 version of the Center for Astrophysics (CfA) redshift survey, plus a few other “pencil-beam” optical and H I surveys along specific sightlines using multi-object optical spectroscopy or 21 cm imaging spectroscopy from the Westerbork Synthesis Radio Telescope (WSRT) and the Very Large Array (VLA).
To examine the relationship of the Ly absorbers to the 3-D galaxy distribution along each sightline, we use the “pie diagrams” in right ascension and declination and the tables of nearest galaxy neighbors presented in Paper I. We also develop a galaxy-absorber sample that is consistent in galaxy coverage, to avoid biases due to galaxy survey incompleteness. Our restricted sample (called the 4 sample) is composed of 46 Ly absorbers of significance, located in regions of the local Universe where the galaxy catalogs are complete down to galaxies, or below. In § 3, we use this sample to examine galaxy–absorber “coincidences” and the distribution of nearest-neighbor galaxies. We combine our galaxy detections and non-detections with the results of several other surveys in an attempt to determine whether most Ly absorptions can be explained as arising from extended galaxy halos. We also compare the nearest-neighbor distribution of our 4 sample to the galaxy-galaxy nearest-neighbor distribution, and to a random-galaxy distribution within the same galaxy survey regions. In § 4 we explore the relationship between Ly absorbers and galaxy filamentary structures, both in terms of an individual example, the close pair of sightlines towards 3C 273 and Q 1230+0115, and by using statistical methods on the GHRS 4 sample. In § 5 we explore the properties of Ly absorbers in galaxy superclusters and voids in terms of the Ly absorber frequency, , as a function of . In § 6 we compare the two-point correlation function of galaxy halos to that derived in Paper II for Ly absorbers. Finally, § 7 summarizes the most important conclusions drawn from these various comparisons and outlines work in progress that will improve the current results (e.g., in Penton, Stocke & Shull, 2002, we will incorporate an additional 15 sightlines observed with HST/STIS).
2 Sample of Absorbers and Galaxies
2.1 CfA Galaxy Pie Charts
In Paper I, we presented heliocentric “pie diagrams” in right ascension and declination versus heliocentric radial velocity for all 15 HST targets in our GHRS survey. These pie diagrams indicate the spatial positions of the CfA Redshift Catalog galaxies relative to our target sightlines and the detected Ly absorbers, assuming a pure Hubble flow. The February 8, 2000 version of this catalog (Huchra et al., 1992) contains 120,000 galaxies with velocities less than 100,000 km s-1, including several large sky areas where complete, magnitude-limited surveys have been completed (see § 2.3).
All Ly absorber velocities were reported in Paper I in the LSR velocity scale, established by aligning the velocity centroids of the Galactic S II 1250, 1253, 1259 absorption lines with the dominant Galactic 21-cm emission. We selected this velocity scale instead of the HST/GHRS wavelength solution owing to the possibility of an improper wavelength scale caused by poor target centering in the large science aperture (LSA). To convert our LSR Ly absorber velocities to heliocentric velocities, we assumed that the solar velocity with respect to LSR is +20.0 km s-1 towards (=18:03:50.3;=+30:00:17; epoch J2000). Due to this process, we estimate conservatively that the typical velocity accuracy of the Ly absorbers is . Our accuracy is limited by the centroid uncertainty of the Gaussian fit, added in quadrature with the coincidence accuracy of the dominant H I 21-cm emission and the S II absorption lines. The error in the mean of the Gaussian fit is listed individually for each line detected in Table 2 of Paper I. The accuracy of the CfA redshift catalog galaxy recession velocities is variable (median velocity error of 34 km s-1; mean velocity error of 43 km s-1). Herein, the absorbers of Paper I are converted to heliocentric velocities to match the galaxy data.
2.2 Nearest-Neighbor Galaxies
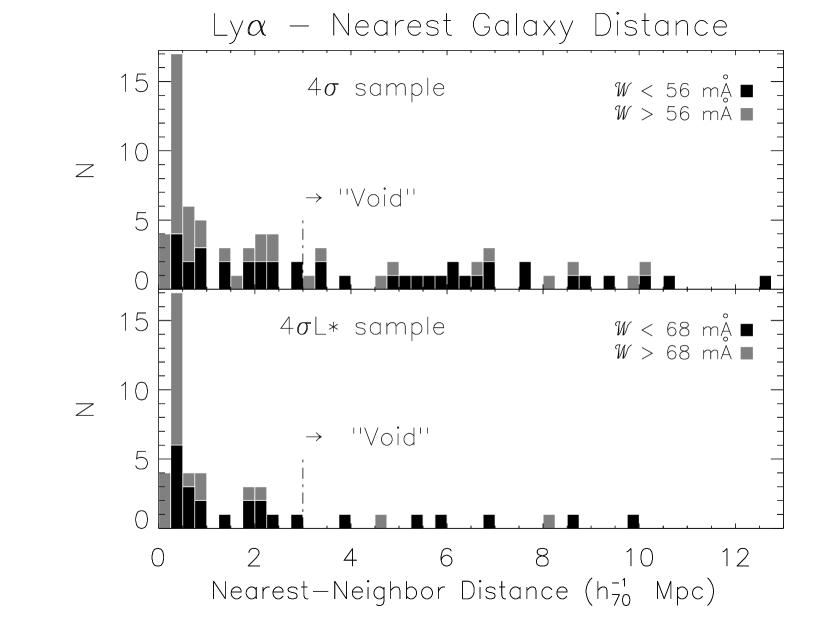
In the upper panel of Figure 1, we display a histogram of the nearest-neighbor distances from each of our 81 4 absorbers to the nearest CfA redshift survey galaxy. The distribution is split at the median (56 mÅ, or cm-2 for km s-1). The dark bins are the histogram for the weaker absorbers, while the grey bins are the stronger absorbers. A two-sided Kolmogorov-Smirnov (K-S) test indicates that the weaker and stronger distributions are different at the 99.9% () confidence level. We suspect that the weaker and stronger absorbers may sample different populations with different space distributions.
In Paper I we listed the nearest 3 galaxies for all SL3 Ly absorbers in our sample, with information on galaxy morphology, location, dimensions, velocity, and magnitude taken from the Revised CfA Redshift Catalog unless otherwise indicated. The line of sight (LOS) distance from the absorber to the galaxy uses a “retarded Hubble flow” model (Morris et al., 1993; Stocke et al., 1995) which accounts for peculiar galaxy motion and galaxy rotation by decreasing the reported total absorber-galaxy distance compared to a “pure Hubble flow” model where LOS distance is given by . In the “retarded Hubble flow” model, we consider any galaxy within 300 km s-1 of the recession velocity of an absorber to be at the same distance from us as the absorber, and we decrease all LOS distances by , if , or by 300 km s-1 if . All three-dimensional distances quoted herein use this “retarded Hubble flow” model for computing distances long the line-of-sight and assume Euclidean geometry, given the small redshifts involved. Therefore, our 3D nearest-neighbor distances should be considered conservative lower limits.
While the tolerance on matching absorber to galaxy velocities is a somewhat arbitrary choice, we note several reasons that brought us to this selection. First, halo stars (L95) and high velocity gas associated with our own galaxy extend to these velocities. Secondly, the rotation curves of the most massive galaxies extend to these velocities. While this value is somewhat greater than typical velocity dispersions of galaxy groups and supercluster “filaments”, it is typical of the full range of velocities therein (e.g., Ramella, Geller, & Huchra, 1992). Finally, while L95 allowed a leeway for “association” between absorbers and galaxies, both the FOS absorber velocities and the faint galaxy velocities obtained by L95 are less accurate than those used here. So, to be conservative in the sense of being more inclusive of possible absorber-galaxy “associations” (and thus more open to the L95 hypothesis that all absorbers are extended galaxy halos), we use this somewhat larger range for absorber-galaxy velocity differences. In a “pure Hubble flow” model (i.e., no velocity tolerance), the 3D distances between galaxy and absorber would be even larger.
2.3 The 4 Sample
Because the CfA redshift survey is a flux-limited survey and does not contain uniform galaxy information as a function of position on the sky, some of our sightlines are better suited than others for nearest-neighbor analysis. Four of our 15 sightlines (I ZW 1, MRK 335, MRK 421, and MRK 501) pass through well-surveyed regions of the February 8, 2000 CfA survey. In an earlier publication (Stocke et al., 1995) we used these sightlines to investigate probable galaxy-cloud relationships. To date, the well-surveyed regions of the CfA catalog that are complete to are (in 1950 coordinates):
Galaxies in the low Galactic latitude survey (LGL) are taken from Marzke, Huchra, & Geller (1996), while the Southern Galactic Cap data are taken from Huchra, Vogeley, & Geller (1999). The CfA catalog also includes all galaxies in the Morphological Catalog of Galaxies (MCG, Huchra et al. 1993), complete to in the following region:
One sightline (MRK 509) lies in this region of the sky. The CfA catalog also includes all galaxies in the merged Zwicky-Nilson catalog (Nilson 1973), complete to in the regions:
This region is known as the North Zwicky 40 (NZ40), and it includes the sightlines of MRK 279, MRK 290, and MRK 817. In addition, Grogin, Geller, & Huchra (1998) (GGH) have extended the CfA survey down to =15.7 in the region:
which includes the sightlines towards 3C 273 and Q 1230+0115. Finally, the second southern sky redshift survey (SSRS2; da Costa 1999) contains the PKS 2155-304 sightline and is complete down to in the region:
The CfA catalog also includes the Bright Galaxy Redshift Catalogue (BGRC), which is an all-sky catalog complete to =13.21.
In addition, five of our objects (3C 273, H 1821+643, MRK 335, MRK 501, and PKS 2155-304) have undergone optical multi-object spectroscopy and/or “pencil-beam” H I surveys with WSRT or VLA. The 3C 273 sightline was observed by Morris et al. (1993) with the Fiber Spectrograph on the Las Campanas 2.5m du Pont Telescope using the 2D-FRUTTI detector. Redshifts were obtained over region of radius centered on 3C 273. The H 1821+643 sightline was observed by Tripp, Lu, & Savage (1998a) using the WIYN+HYDRA in a 1° circular field of view. These optical surveys are reported to be complete down to over a full 1° field and 72% complete to over a 20’ radius, respectively. However, as with any fiber survey, some galaxies might be missed due to fiber positional misalignments and positioning constraints. The MRK 335 and PKS 2155-304 sightlines were observed with the VLA (van Gorkom et al. 1996; Shull et al. 1998). The PKS 2155-304 sightline was observed over the velocity ranges 3562–6637 km s-1 and 16,230–17,530 km s-1 to an H I mass limit well below that of an spiral galaxy. MRK 335 was observed with the VLA over the velocity range 1635–2635 km s-1 at a resolution of 25 km s-1. The MRK 501 sightline was observed over the velocity ranges 4385–5385 km s-1 and 7240–8240 km s-1 with a resolution of 17 km s-1 (van Gorkom et al., 1996). Table 1 summarizes the galaxy information available for each sightline, including by column: (1) sightline target name; (2) the Zwicky (blue) magnitude limit of the catalog along this sightline; (3) the catalog names as described above; and (4) the velocity limit () at which the catalog magnitude limit equals . Velocities along the sightline less than the velocity limit () are complete to magnitudes fainter than .
Owing to our concerns over Ly absorbers with significance levels , we only include absorbers with in our analysis. To achieve some consistency in our nearest-neighbor sample, we adopt the following condition for inclusion in our 4 sample: the absorber must reside at a velocity and location on the sky in which the CfA redshift catalog (or other survey) is inclusive of all galaxies down to at least . In the Zwicky (blue) magnitude system, an galaxy has an absolute magnitude of = (Marzke et al., 1994); for the objects in the well-surveyed CfA regions, which are complete for , this velocity cutoff is km s-1. Table 1 summarizes the velocity restrictions for each of our sightlines. Note that the PKS 2155-304 sightline is unusual, since its velocity coverage is not contiguous. Under these velocity and significance level restrictions, there are 46 absorbers in our 4 sample. Table 2 presents all 4 absorbers, sorted by velocity with the following information by column: (1) target name (an asterisk indicates pre-COSTAR data), (2) the absorber heliocentric radial velocity and its error in km s-1, (3) the rest-frame equivalent width () and its error in mÅ, (4) whether this absorber is included in the 4 sample, (5) the CfA redshift catalog name of the nearest galaxy to this absorber, (8) the total Euclidean absorber-galaxy distance (, assuming the “retarded Hubble flow” model; see § 2.3), (6) the apparent Zwicky blue magnitude of this galaxy, and (7) the heliocentric radial velocity of this galaxy. When calculating absorber-nearest galaxy distances, we do not restrict ourselves to or brighter galaxies, but consider all known galaxies in the field. Notice that, owing to the peculiar velocity allowance () assumed here, several absorbers are paired with the same nearest known galaxy.
| Target | mbaaBlue (Zwicky) magnitude limit of the indicated catalog along this sightline. | CatalogbbGalaxy catalog used in determining nearest neighbors. The Bright Galaxy Redshift Catalog (BGRC), Southern Galactic Cap, North Zwicky 40, GGH, SSRS2, MCG, and CfA slices are taken from the February 8, 2000 version of the CfA redshift catalog; see text for acronym definitions. | LimitccVelocity cutoff limit for which the indicated catalogs are complete down to galaxies, assuming = 70 km s-1 Mpc-1. ( km s-1) |
|---|---|---|---|
| 3C273 | 19.00 | GGH & Morris et al. (1993)ddCfA + 1°-radius 2D-FRUTTI galaxy survey complete to . | |
| AKN120 | 13.21 | BGRC | 2519 |
| ESO141-G55 | 13.21 | BGRC | 2519 |
| FAIRALL9 | 13.21 | BGRC | 2519 |
| H1821+643 | 18.00 | Tripp, Lu, & Savage (1998a)eeCfA + 20’-radius WIYN/HYDRA galaxy survey 72.4% complete at . | |
| IZW1 | 15.50 | South Gal Cap | |
| MARK279 | 14.50 | N Zwicky 40 | |
| MARK290 | 14.50 | N Zwicky 40 | |
| MARK335 | 15.50 | South Gal Cap | |
| MARK335 | VLA - van Gorkom et al. (1996) | ||
| MARK421 | 15.50 | 2nd CfA Slice | |
| MARK501 | 15.50 | 1st CfA Slice | |
| MARK501 | WSRT; van Gorkom et al. (1996) | ||
| MARK509 | 15.00 | MCG | |
| MARK817 | 14.50 | N Zwicky 40 | |
| PKS2155-304 | 15.50 | SSRS2 | |
| PKS2155-304 | VLA | ||
| Q1230+0115 | 15.70 | GGH |
| Target | aaRest-frame equivalent width. | InbbY if the absorber is included in our 4 sample, N if not included. 4 | Nearest | DtotccEuclidian absorber-galaxy distance assuming = 70 km s-1 Mpc-1. | mBddZwicky (blue) apparent magnitude of the nearest galaxy. For galaxies named Tripp#, the POSS II J-magnitude is given, which is roughly equivalent to . | ||
|---|---|---|---|---|---|---|---|
| (km s-1) | (mÅ) | sample ? | Galaxy | (Mpc) | (km s-1) | ||
| 3C273 | 1013 6 | 369 36 | Y | 12285+0157 | 0.17 | 15.60 | 1105 |
| Q1230+0115 | 1487 6 | 138 42 | Y | A1225+0152 | 0.27 | 16.30 | 1298 |
| 3C273 | 1583 6 | 373 30 | Y | A1225+0152 | 0.18 | 16.31 | 1298 |
| Q1230+0115 | 1664 9 | 385 94 | Y | 12308+0147 | 0.28 | 18.55 | 1643 |
| Q1230+0115 | 1743 7 | 241 99 | Y | 12308+0147 | 0.28 | 18.08 | 1643 |
| Q1230+0115 | 1857 13 | 142 81 | Y | 12308+0147 | 0.28 | 17.31 | 1643 |
| MARK817 | 1919 9 | 29 13 | Y | 14332+5934 | 0.28 | 18.45 | 1920 |
| MARK335 | 1961 6 | 229 30 | Y | 00025+1956 | 0.10 | 18.45 | 1950 |
| MARK817 | 2083 5 | 135 15 | Y | 14332+5934 | 0.28 | 18.45 | 1920 |
| 3C273 | 2287 7 | 35 30 | Y | A1225+0258 | 0.40 | 17.10 | 2329 |
| MARK335 | 2291 12 | 81 26 | Y | N7817 | 0.45 | 18.88 | 2310 |
| Q1230+0115 | 2298 6 | 439 57 | Y | A1228+0116 | 0.16 | 18.88 | 2289 |
| MARK509 | 2549 6 | 209 32 | Y | A2028-1821 | 4.66 | 17.99 | 2314 |
| PKS2155-304 | 2630 15 | 42 40 | Y | A2156-3128 | 0.70 | … | 2786 |
| PKS2155-304 | 2782 16 | 36 22 | Y | A2156-3128 | 0.70 | 15.60 | 2786 |
| MARK421 | 3035 6 | 86 15 | Y | A1102+4120 | 2.14 | … | 2988 |
| PKS2155-304 | 4028 12 | 21 11 | Y | N7201 | 2.77 | … | 4452 |
| AKN120 | 4057 8 | 48 18 | N | A0510-0036 | 0.87 | … | 4284 |
| MARK335 | 4265 14 | 33 16 | Y | 00008+2150 | 2.25 | 16.10 | 4455 |
| MARK290 | 4652 7 | 60 18 | N | A1542+5722 | 1.65 | … | 4287 |
| MARK501 | 4659 10 | 161 43 | Y | 16510+3927 | 0.52 | 14.42 | 4625 |
| MARK817 | 4668 10 | 23 11 | N | 14293+5528 | 6.54 | … | 5291 |
| PKS2155-304 | 4949 7 | 64 23 | Y | A2157-3025 | 0.33 | 16.30 | 5187 |
| PKS2155-304 | 5010 7 | 82 22 | Y | A2157-3025 | 0.33 | 16.30 | 5187 |
| MARK817 | 5074 6 | 207 14 | N | 14293+5528 | 4.78 | 16.30 | 5291 |
| PKS2155-304 | 5116 7 | 218 20 | Y | A2157-3025 | 0.33 | 16.30 | 5187 |
| MARK817 | 5222 7 | 25 7 | N | 14293+5528 | 4.78 | 17.40 | 5291 |
| MARK279 | 5234 7 | 30 10 | N | A1310+6745 | 8.89 | 17.40 | 5994 |
| PKS2155-304 | 5615 7 | 29 15 | Y | A2157-3025 | 1.86 | 15.70 | 5187 |
| PKS2155-304 | 5670 8 | 39 16 | Y | A2200-2909 | 2.32 | 20.60 | 5658 |
| MARK817 | 5779 7 | 34 13 | N | 14293+5528 | 5.56 | 15.70 | 5291 |
| MARK501 | 5990 7 | 55 46 | Y | 16310+3727 | 8.50 | 16.00 | 5309 |
| MARK817 | 6241 6 | 37 8 | N | A1414+6042 | 5.12 | 15.50 | 6595 |
| FAIRALL9 | 6255 9 | 22 9 | N | A0105-5820 | 3.32 | 15.50 | 5914 |
| MARK335 | 6266 6 | 130 14 | Y | 00036+1928 | 0.82 | 16.34 | 5936 |
| MARK279 | 6360 7 | 58 7 | N | 14010+6943 | 1.28 | 13.90 | 6293 |
| MARK279 | 6433 6 | 40 7 | N | 14010+6943 | 1.28 | 13.90 | 6293 |
| AKN120 | 6750 7 | 53 13 | N | 05071-0018 | 2.84 | 16.00 | 6961 |
| MARK279 | 6913 5 | 65 8 | N | A1401+7005 | 3.04 | … | 6430 |
| MARK290 | 7071 8 | 23 10 | N | A1505+6310 | 10.73 | … | 6584 |
| FAIRALL9 | 7112 8 | 32 10 | N | A0106-5837 | 6.76 | 16.00 | 7796 |
| MARK817 | 7316 13 | 17 7 | N | I1049 | 6.91 | 12.70 | 6728 |
| H1821+643 | 7325 5 | 298 20 | Y | Tripp1 | 0.87 | 16.00 | 7207 |
| MARK290 | 7349 6 | 21 7 | N | A1505+6310 | 12.51 | 17.00 | 6584 |
| MARK501 | 7521 17 | 53 36 | Y | 17048+4107E | 5.31 | 17.50 | 7852 |
| H1821+643 | 7537 9 | 50 24 | Y | Tripp1 | 0.97 | 15.00 | 7207 |
| MARK279 | 7767 6 | 48 9 | N | N5607 | 6.00 | 15.20 | 7595 |
| MARK817 | 7785 11 | 28 9 | N | 14212+6010 | 7.57 | 15.60 | 8520 |
| MARK279 | 7845 10 | 21 10 | N | N5607 | 6.00 | 14.90 | 7595 |
| H1821+643 | 7853 7 | 40 17 | Y | 18197+6340E | 1.34 | … | 7756 |
| 3C273 | 7870 11 | 33 18 | Y | A1228+0205 | 0.94 | 15.50 | 7593 |
| AKN120 | 7884 21 | 20 25 | N | A0509-0045 | 2.32 | 15.50 | 7888 |
| H1821+643 | 7941 8 | 68 38 | Y | Tripp2 | 0.34 | 15.60 | 8250 |
| AKN120 | 7977 5 | 147 22 | N | A0509-0045 | 2.32 | 15.60 | 7888 |
| AKN120 | 8037 7 | 65 17 | N | A0509-0045 | 2.32 | 15.60 | 7888 |
| MARK501 | 8748 7 | 66 57 | N | 16572+4012 | 2.22 | 15.60 | 8714 |
| 3C273 | 8830 8 | 114 25 | Y | A1226+0211 | 0.40 | 16.00 | 8807 |
| Q1230+0115 | 9239 8 | 301 49 | N | A1227+0144 | 0.52 | 14.80 | 9281 |
| FAIRALL9 | 9498 6 | 84 13 | N | A0114-6153 | 8.61 | 15.30 | 8818 |
| 3C273 | 9830 17 | 46 22 | Y | A1225+0223 | 0.39 | 16.70 | 9752 |
| FAIRALL9 | 11650 7 | 16 8 | N | A0101-5726 | 9.44 | 16.70 | 11114 |
| FAIRALL9 | 11930 10 | 22 9 | N | A0120-5934 | 10.10 | 13.83 | 12927 |
| FAIRALL9 | 12099 18 | 30 28 | N | A0120-5934 | 7.73 | 14.39 | 12927 |
| FAIRALL9 | 12202 6 | 28 7 | N | A0120-5934 | 6.30 | 14.39 | 12927 |
| H1821+643 | 12317 6 | 64 15 | Y | 18421+6358 | 6.94 | 14.39 | 12369 |
| FAIRALL9 | 12416 29 | 19 23 | N | A0120-5934 | 3.47 | 14.39 | 12927 |
| PKS2155-304 | 13589 6 | 101 18 | N | A2143-2933 | 10.15 | … | 14030 |
| 3C273 | 14689 7 | 140 25 | Y | A1224+0230B | 1.90 | 15.65 | 14860 |
| 3C273 | 14984 14 | 46 22 | Y | A1224+0230B | 1.90 | 16.15 | 14860 |
| 3C273 | 15239 33 | 52 40 | Y | A1224+0230B | 2.21 | 16.15 | 14860 |
| 3C273 | 15928 19 | 64 33 | Y | A1223+0238 | 9.81 | … | 14986 |
| PKS2155-304 | 16201 5 | 346 23 | N | A2155-3033A | 0.58 | … | 16200 |
| PKS2155-304 | 16322 15 | 62 34 | Y | A2155-3033A | 0.58 | … | 16200 |
| PKS2155-304 | 16922 7 | 43 37 | Y | A2155-3033B | 0.44 | … | 17093 |
| PKS2155-304 | 16970 9 | 389 68 | Y | A2155-3033B | 0.44 | 16.58 | 17093 |
| PKS2155-304 | 17116 9 | 448 79 | Y | A2155-3033B | 0.44 | 16.30 | 17093 |
| PKS2155-304 | 17710 6 | 139 21 | N | A2156-3017 | 3.39 | 15.30 | 17179 |
| PKS2155-304 | 18071 7 | 99 20 | N | A2156-2900 | 6.50 | 15.30 | 17739 |
| 3C273 | 18270 24 | 47 28 | Y | A1229+0222 | 5.98 | 15.30 | 18889 |
| 3C273 | 19031 12 | 47 22 | Y | A1229+0222 | 3.91 | 18.30 | 18889 |
| 3C273 | 19953 6 | 297 25 | Y | A1222+0249 | 8.05 | 17.69 | 20661 |
Note. — A preceeding the sightline name indicates a pre-COSTAR HST observation.
3 Galaxy - Absorber Relationships
3.1 Nearest-Neighbor Distributions
The lower panel of Figure 1 presents the nearest-neighbor galaxy distances for the 46 absorbers in the 4 sample. In this histogram, the stronger Ly features, are displayed in grey bins, while the weaker features, W68 mÅ, are displayed in dark bins. The choice of the 68 mÅ cutoff divides our restricted 4 sample equally by number and corresponds to assuming a Doppler parameter of (see Papers I and II). A two-sided K-S test indicates that the stronger and weaker features are drawn from different populations at the 99.3% () confidence level, similar to the result obtained for the median split sample shown in the upper panel of Figure 1. This also confirms our earlier contention (Stocke et al., 1995) that the weak and strong Ly features are distributed differently with respect to nearest neighbors, with the stronger features generally having closer nearest galaxy neighbors. Eighty percent of our stronger 4 absorbers have a nearest galaxy neighbor within 1 Mpc, while only 45% of the weaker 4 absorbers have a known galaxy within 1 Mpc.
Note that there is considerable spread in the nearest-neighbor distances in both the strong and weak absorber samples. If we define being in a “void” as lacking a nearest neighbor within 3 Mpc, then 8 (17%) of our 4 absorbers are in voids and 38 (83%) are not. Our definition of “void” is not entirely arbitrary, in that 3 Mpc is the median distance from a random point in the low- Universe to the nearest galaxy (see § 3.2 below). In our full sample, 32 of 81 of our 4 Ly absorbers (40%) lie in voids according to the above definition, illustrating the need to restrict the sample region according to limiting magnitude. While our use of a “retarded Hubble flow” model could create an underestimation of the void fraction, we have used other “void” definitions guided by the Slezak et al. (1993) wavelet technique for identifying voids. This secondary methodology gives nearly identical results to the 3 Mpc retarded Hubble flow definition. Interestingly, even if we exclude the 17 local supercluster absorbers, there are only 3 out of 17 absorbers in voids at but 5 out of 12 at greater . The reason for this possible difference is not clear but maybe due either to the different galaxy survey methodology employed in these two redshift regimes (i.e., “pencil-beam” surveys at higher , CfA redshift survey at lower ) or to the greater sensitivity of our GHRS spectra at higher , causing statistically weaker absorbers to be detected at higher .
Of these 8 “void” absorbers, only two are in the strong half of the sample ():
-
1.
MRK 509 : nearest galaxy = 4.7 Mpc ; mÅ ;
(galaxy survey complete to 0.2 at this location) -
2.
3C 273 : nearest galaxy = 8.0 Mpc ; mÅ ;
(galaxy survey complete to 0.3 at this location)
Because of its proximity, the =2549 km s-1 absorber of MRK 509 is our best candidate for studying Ly absorbers in low- galaxy voids.
Even though the 4 sample in Table 2 is defined by having galaxy redshift survey data complete to at least , there is still a possible distance-dependent bias in nearest-neighbor distances because lower locations within the same survey region are more sensitive to lower luminosity galaxies. Absorbers at limit in Table 1 have been surveyed to below luminosities and so these absorber regions have fainter known galaxies. Thus, a distance dependent bias could be introduced into the 4 sample, as a result. Using their Virgo region sample, IPF99 showed that decreasing the luminosity limit of the galaxies surveyed does decrease the nearest-neighbor distance to some of their 11 absorbers, so that such an effect could be present in the 4 sample as well. The use of different types of surveys (i.e., wide-angle, shallow surveys, deep pencil-beam surveys and limited velocity range 21 cm surveys) might also create some bias. For example, the closest galaxy-absorber pair in the 4 sample is due to a galaxy at kpc from the absorber in the MRK 335 sightline, which was discovered in a pointed H I survey (van Gorkom et al., 1996). This galaxy at (0.04) and is below the CfA redshift survey limit at that distance () and so is the least luminous galaxy in any galaxy redshift catalog used herein.
In Figure 2 we show the nearest galaxy distances to absorbers in the 4 sample as a function of recession velocity. We discount the absorbers at , almost all of which have uncommonly close absorber-galaxy distances. These absorbers are nearly exclusively in the 3C 273 and Q 1230+0115 sightlines which penetrate the southern region of the Virgo cluster at . This figure shows that there is no evident correlation between absorber distance and recession velocity (correlation coefficient=0.45). Similarly, the mean distance to the nearest 3 galaxies is not strongly correlated with redshift (correlation coefficient=0.59). Are the small absorber-galaxy distances at a result of the lower luminosity limits for galaxies, or of a larger space density of galaxies in the Virgo region? The answer is not obvious based upon the present information, but to be safe we investigate the 4 sample, with and without the Virgo absorber-galaxy pairs. Despite the absence of a correlation in Figure 2, we devised comparison methods that substantially reduce, if not eliminate, the effect of any distance-dependent biases by using the same CfA redshift survey volume to measure the statistics of the comparison samples (see § 3.2).

3.2 Cumulative Distribution Functions
In order to achieve an unbiased comparison to our 4 sample of absorbers, we determine: (1) the galaxy-galaxy nearest-neighbor distribution and (2) the random location-nearest-neighbor galaxy distribution of the 5200 CfA galaxies in the first six CfA slices, that dominates our survey volume. Specifically, the distributions of nearest-galaxy-neighbor distances were calculated using the region covered by the first six CfA slices:
The velocity constraints correspond to our lower spectral limit (1218 Å) and the completeness limit. To avoid any possible “edge” effects, we consider only galaxies greater than 0.°5 from the edge of the “well-surveyed” regions defined in § 2.3. We have compared our absorbers to a random distribution based upon 250 sightlines through the above region that are consistent with the varying sensitivity, S(), and wavelength coverage of our spectra. The random absorber location sample is simulated identically as in Paper II; for each pixel of each random spectrum (sightline), we compute the probability of a Ly absorber occurring given our selection function. We combine this probability with the signal to noise (S/N) of each spectral location, to determine the probability, , that a randomly placed absorber will occur at that location. If is greater than a uniformly distributed random number, then we locate an absorber at that pixel. As with the TPCF, because of our limited spectral resolution, two absorbers are not allowed to occur within 50 km s-1 of one another.
The galaxy-galaxy, random absorber-galaxy, and observed Ly absorber-galaxy cumulative distribution functions (CDFs) are displayed for our 4 sample in Figure 3. The clustering of galaxies is revealed by the dashed line, which shows that % of the galaxies in the 4 region are within 2 Mpc of another galaxy. For a random distribution (triple dot-dashed line) that matches the selection function of our 4 sightlines, only 27% are within 2 Mpc and 50% are within 3 Mpc of the nearest galaxy. The solid line shows our 4 absorber sample. The inclusion of the few absorbers at , that may be biased by being in the Virgo region (see Figure 2), does not alter the result significantly. It is clear that our 4 Ly sample does not cluster with galaxies as strongly as galaxies cluster, but they are more clustered than a random distribution. K-S tests give only a probability that our 4 absorber sample clusters with galaxies as strongly as galaxies cluster with other galaxies, and a probability that the 4 absorber sample is randomly distributed with respect to galaxies. Figure 3 also shows that, while the median distance between galaxies is 250 kpc, the median Ly cloud-galaxy distance is 500 kpc. Because Ly absorbers are typically twice as far away from bright galaxies as these bright galaxies are separated, it is problematic to associate these clouds with individual bright galaxy halos. The results shown in Figure 3 are similar to those in Morris et al. (1993), Stocke et al. (1995), Tripp, Lu, & Savage (1998a), and IPF99, although the different techniques used do not allow a more quantitative comparison with these earlier results. It has been suggested (Impey & Bothun, 1997) that, because Ly absorbers correlate with galaxies less strongly than galaxies correlate with galaxies, their clustering is similar to that of low-surface-brightness (LSB) galaxies. Impey & Bothun (1997) take one further logical step and associate Ly clouds with LSB galaxies. This speculation remains an open question. We note that no LSB galaxies have been found close to any low column density Ly clouds to our knowledge, including the pair of Virgo absorbers towards 3C 273, where sensitive limits have been set on their absence (Rauch, Weymann, & Morris, 1996).

To further explore the possibility that the weaker and stronger Ly absorbers sample different populations, we split the 4 sample into two distributions at above and below 68 mÅ. The CDFs for these split samples are also shown in Figure 3. It is clear that the stronger absorbers cluster more like galaxies, and the weaker absorbers appear to cluster more randomly, although neither sample is well-matched by the comparison samples. The K-S probability that the strong absorber-galaxy and the galaxy-galaxy distributions are drawn from the same parent distribution is 0.3% (4 difference). The K-S probability that the weak absorber-galaxy and random-galaxy distributions are drawn from the same parent distribution is only . Additionally, a K-S test indicates that the weak and strong Ly samples differ at the 99.1% (3) confidence level. These results confirm our earlier suggestion (Stocke et al., 1995) of such a dichotomy, which was based on fewer absorbers.
The primary difference between the galaxy-galaxy and the strong absorber-galaxy nearest-neighbor distributions in Figure 3 is due to the two absorbers listed in §3.1. These two “void absorbers” are several Mpc away from the nearest known galaxy. In order to have these two distributions match each other statistically, very faint galaxies would have to be within Mpc of these absorbers. If these two “void absorber” are removed from the strong absorber sample, this sample still deviates from the galaxy-galaxy CDF at the 98.4% (3) level. The very nearby “void absorbers” in the MRK 509 and MRK 421 sightlines are in regions already surveyed to 0.2 and 0.3 by the CfA survey data, respectively. Thus, the evidence is already strong that at least some higher column density absorbers are not physically associated with galaxies. New deeper galaxy surveys in the optical (McLin et al., 2002) and H I (Hibbard et al., 2002) extend this result to impressively low limits for these and other void absorbers. The absence of metal absorptions in the strong Ly systems found in the PKS 2155-304 sightline at (Shull et al., 1998) is further evidence that some higher column density Ly absorbers are not “recycled gas” in extended galaxy halos.

Grogin & Geller (1998, GG98) recently used a subset of our 4 sample, in conjunction with the CfA redshift survey, to investigate the relationship between galaxies and Ly clouds in a somewhat more robust manner. As shown by IPF99, the exact nearest-neighbor distance for each absorber depends upon the absolute magnitude limit. GG98 determined a galaxy density at each point within the CfA survey region by averaging over the 1–3 Mpc regions, using the detailed selection function of the survey to determine an averaged galaxy density at the location of each Ly cloud. By doing this, GG98 avoided using just the nearest-neighbor galaxy distance as an indication of Ly absorber environment. They also used the CfA survey mean luminosity function to correct for the presence of galaxies below the survey limit at each absorber. From this procedure, they found that Ly clouds are located randomly with respect to the averaged galaxy density. We make the following comments about this work:
-
1.
Although GG98 claim that their result is insensitive to their smoothing lengths, these lengths are comparable to or larger than nearest-neighbor distances for 80% of our sample.
-
2.
The GG98 sample contains roughly equal numbers of stronger and weaker Ly absorbers by the definition of Figure 3.
-
3.
Because the sample used by GG98 contains 5 absorbers that are no longer in our 4 sample (e.g., the =2060 km s-1 absorber in the 3C 273 sightline), this study should be revised with newer absorber data.
-
4.
The GG98 analysis technique does not take into account the varying sensitivity of the HST spectra, as we have done here.
In order to use the 4 sample to determine whether our current results are consistent with the GG98 analysis, we have repeated the nearest-neighbor analysis using the mean distance to the nearest 3 galaxies (see Table 10 of Paper I). We have generated galaxy-galaxy and random location-galaxy data to compare with the Ly-galaxy data in a manner identical to the descriptions above. The use of the mean of the nearest three galaxy distances provides some smoothing of the galaxy environments, but on a scale more local to the Ly absorbers than the GG98 analysis. Our results are shown in Figure 4, a CDF similar to Figure 3. To illustrate the importance of using the spectral sensitivity function, S(), when calculating the random CDF, we have also included the random CDF without using S(). As mentioned above, without considering S(), our Ly CDF appears more random than it truly is. This suggests that, by not including the sensitivity of the Ly survey, GG98 may have drawn the incorrect conclusion that Ly absorbers are randomly distributed with respect to the galaxy density. New work is underway to utilize the GG98 technique on a much larger sample of absorbers, incorporating our S() to revisit these results (Grogin et al., 2002).
3.3 Ly Absorber Searches near Galaxies
Because of the suggestion by L95 that extended galaxy halos are the sources of Ly absorption, we have searched for absorbers near known galaxies along our sightlines. For this purpose, we classify galaxy-sightline and galaxy-absorber matches into two categories: “coincidences” and “non-detections”.
We define a “coincidence” as a absorber within 350 kpc of a galaxy using our “retarded Hubble flow” model. This distance was chosen to be inclusive of all “coincidences”, based upon an earlier analysis of higher absorbers by L95, but only five of these are in as close proximity as the “associations” found by L95 (our impact parameter limit is 1.5 times the limits of galaxy halos suggested by L95; 230 kpc). An absorber-galaxy coincidence does not necessarily imply that the absorber is gravitationally bound or physically connected with a galaxy in any way; for this present analysis it only implies proximity. In our full 4 sample, we find that 14 of our 81 absorbers (17%) are “coincident” with 11 different galaxies. All of these “coincidences” involve absorbers in the 4 sample. Several galaxies are “coincident” with absorbers in both the 3C 273 and Q 1230+0115 sightlines up to 2300 km s-1, although in most of these cases the velocity difference between the galaxy and the Ly absorber in at least one of these sightlines is quite large (Table 3). Fully 2/3 of the “coincidences” are in the Virgo region of the 3C 273/Q 1230+0115 sightlines, suggesting that these matches are, in fact, truly coincidental; most occur in the region of highest galaxy density in our surveyed volume.
Table 3 lists, in order of increasing separation distance, galaxy-absorber information for the “coincidences”. Eleven galaxies are listed for 21 “coincidences”. For brevity, Table 3 lists a maximum of three associated galaxies for each absorber (complete information regarding these nearest galaxies can be found in Table 10 of Paper I). If only the nearest galaxy is listed, the number of “coincidences” drops to 16. Galaxy information is derived from the CfA survey, except where previously noted. Information in Table 3 includes by column: (1) sightline target name, (2) galaxy name, (3) the galaxy Zwicky magnitude, (4) the galaxy heliocentric radial velocity in km s-1, (5) the galaxy-absorber 3D separation distance () in kpc assuming our retarded Hubble flow model, (6) the heliocentric radial velocity in km s-1 for the associated Ly absorber, (7) the rest-frame equivalent width () of the Ly absorber in mÅ, (8) the significance level (SL) of the Ly absorber, and (9) whether the absorber is in our 4 sample. Because the values assume a retarded Hubble flow model, these 3D distances should be considered lower limits.
As previously mentioned, and indicated in Table 3, our closest galaxy-absorber pair is related to the 1963 km s-1 absorber in the MRK 335 sightline. The galaxy impact parameter at the velocity of the galaxy (1950 km s-1) is = 96 kpc. The “coincident” galaxy, detected by a 21 cm survey (van Gorkom et al., 1996), has an estimated (0.04 ) and an H I mass .
Almost all of the “coincidences” are in the well-surveyed Virgo cluster region surrounding the 3C 273 and Q 1230+0115 sightlines. These include the Haynes & Giovanelli H I cloud (HG cloud hereafter; km s-1), which is kpc off the Q 1230+0115 sightline but has no Ly detection in the new Q 1230+0115 E140M spectrum to 20 mÅ (3). However, there is a Ly detection in the 3C 273 spectrum at , with an impact parameter (Table 4), and (Table 3) of kpc from the HG cloud. Therefore, if the 3C 273 detection and the Q 1230+01115 non-detection are both probing the HG galaxy halo, that halo must be quite patchy or asymmetric. Bowen, Blades, & Pettini (1996) came to a similar conclusion involving the covering factors of galaxy “halos” using independent data. This is the only “non-detection” of a bright galaxy in our sample, by which we mean that no absorber is found within 350 kpc of a known galaxy assuming our retarded Hubble flow model.
| Target | Galaxy | aaBlue (Zwicky) magnitude, where available. | DtotbbTotal Euclidean distance (in Mpc) to the nearest absorber using our “retarded Hubble flow” model. | SL | In 4 | |||
|---|---|---|---|---|---|---|---|---|
| Name | (km s-1) | (kpc) | (km s-1) | (mÅ) | sample ? | |||
| MARK335 | 00025+1956 | 16.0 | 1950 | 96 | 1961 | 229 | 28.1 | Y |
| Q1230+0115 | A1228+0116 | 18.3 | 2289 | 162 | 2298 | 438 | 23.9 | Y |
| 3C273 | 12285+0157 | 15.6 | 1105 | 169 | 1012 | 369 | 34.8 | Y |
| 3C273 | A1225+0152 | 16.3 | 1298 | 181 | 1012 | 369 | 34.8 | Y |
| 3C273 | A1225+0152 | 16.3 | 1298 | 181 | 1583 | 372 | 42.0 | Y |
| 3C273 | A1224+0146 | NA | 1275 | 231 | 1012 | 369 | 34.8 | Y |
| 3C273 | 12277+0254 | 15.3 | 1635 | 260 | 1583 | 372 | 42.0 | Y |
| 3C273 | A1224+0146 | NA | 1275 | 261 | 1583 | 372 | 42.0 | Y |
| Q1230+0115 | A1225+0152 | 16.3 | 1298 | 271 | 1487 | 138 | 6.3 | Y |
| Q1230+0115 | 12308+0147 | 15.3 | 1643 | 279 | 1487 | 138 | 6.3 | Y |
| Q1230+0115 | 12308+0147 | 15.3 | 1643 | 279 | 1742 | 241 | 10.9 | Y |
| Q1230+0115 | 12308+0147 | 15.3 | 1643 | 279 | 1663 | 384 | 16.9 | Y |
| Q1230+0115 | 12308+0147 | 15.3 | 1643 | 279 | 1857 | 141 | 6.6 | Y |
| MARK817 | 14332+5934 | 15.5 | 1920 | 281 | 2082 | 135 | 25.3 | Y |
| MARK817 | 14332+5934 | 15.5 | 1920 | 281 | 1918 | 28 | 5.3 | Y |
| Q1230+0115 | 12270+0107 | 17.0 | 2234 | 292 | 2298 | 438 | 23.9 | Y |
| Q1230+0115 | A1224+0146 | NA | 1275 | 293 | 1487 | 138 | 6.3 | Y |
| PKS2155-304 | A2157-3025 | 14.4 | 5187 | 332 | 4948 | 64 | 14.3 | Y |
| PKS2155-304 | A2157-3025 | 14.4 | 5187 | 332 | 5010 | 81 | 18.1 | Y |
| PKS2155-304 | A2157-3025 | 14.4 | 5187 | 332 | 5115 | 218 | 48.1 | Y |
| H1821+643 | Tripp2ccThe Tripp2 galaxy is taken from Tripp, Lu, & Savage (1998a). | 20.6 | 8250 | 337 | 7940 | 67 | 9.4 | Y |
Note. — An “concidence” is defined as any galaxy within 350 kpc of one of our sightlines that coincides with a Ly absorber assuming our “retarded Hubble flow” model. Some galaxies are associated with multiple Ly absorbers, and some absorbers have multiple associated galaxies. We limit the number of “coincidences” per absorber to three.
In Figure 5, the solid ‘+’s present the vs results given in Table 3 for all detected Ly absorbers within 350 kpc of a known galaxy. Also displayed, by the numerous dots, is the distribution expected for random galaxy-Ly absorber coincidences using our retarded Hubble flow model. Due to our retarded Hubble flow 3D distance determination (), if the difference in velocity between the absorber and the nearest galaxy were km s-1, the computed would become very large. The upper boundary of ‘+’s and dots in Figure 5 in due to this assumption. As implied by Figure 5, and confirmed by K-S tests, the observed distribution of “coincidences” shows no significant departure from random galaxy-absorber locations. K-S tests give an 88% probability that the distribution of Ly clouds with respect to the nearest galaxy is consistent with the random distribution. The results are also consistent with random coincidences. Therefore, our absorber-galaxy “coincidences” are statistically consistent with chance galaxy-absorber locations and are not indicative of any physical or causal relationship.

3.4 Equivalent Width versus Impact Parameter Relationship
Lanzetta et al. (1995), and more recently C98, used HST/FOS spectra of bright quasars observed by the Key Project Team (Bahcall et al., 1993) to study the association of nearest galaxies to Ly clouds at 0.10.3. C98 reported a distinct anticorrelation between absorber and impact parameter to the LOS () out to 230 kpc, which led them to suggest that most galaxies are surrounded by extended gaseous halos of 230 kpc and that most or all Ly absorptions arise from these extended galaxy halos. HST/FOS data have wavelength resolution of 1 Å and minimum detectable equivalent widths about 10 times greater than our HST/GHRS spectra. The FOS survey did contain some weaker absorbers, so there is some small overlap in between the FOS and GHRS surveys. The minimum used by L95/C98 is 400 mÅ, roughly 6 times higher than the median studied herein. Because many or most of the L95/C98 Ly absorptions correspond to metal-line systems and have substantially higher column density, the results in Figure 6 show that the L95/C98 conclusions may not be appropriate to extrapolate to weaker Ly detections.
At high-, it is still debated (Sargent 1987; Tytler 1987; Songaila & Cowie 1996, Tytler et al. 1995, Weymann 1995) whether there are two distinct populations of H I clouds: metal-poor absorbers that do not cluster and higher column density ( 1014 cm-2) metal-bearing absorbers that cluster like galaxies. Tripp, Lu, & Savage (1998a) used GHRS/G140L+G160M spectra of H 1821+643 (G160M included in our sample) and a GHRS/G140L spectrum of PG 1116+215 with minimum 50 mÅ to examine the versus relationship. They concluded that the anticorrelation persists to 640 kpc, but at a significantly larger dispersion than for just the C98 data. In Figure 6, we collect and from our study, C98, Morris et al. (1993), Tripp, Lu, & Savage (1998a), and IPF99. We also include our non-detections of § 3.3 and those of C98.
As indicated in Figure 3, it is rare to have a random sightline with an impact parameter from an galaxy less than 1 Mpc. Therefore, since FOS and G140L spectra cannot detect absorbers with mÅ, or , it not surprising that the lower left corner of Figure 6 is sparsely populated using galaxy surveys of fields that do not go exceptionally faint (as in the L95 and C98 studies). Galaxy detection surveys that extend significantly below (van Gorkom et al. 1993, 1996; Shull et al. 1996; Rauch, Weymann & Morris 1997; IPF99) would be expected to find smaller impact parameters, by chance in some cases (see e.g., § 3.3 and IPF99 Figure 13). The upper right corner of Figure 6, with large impact parameters and high s, is also sparsely populated. Perhaps this is merely a consequence of the scarcity of large- absorbers in galaxy voids. Our GHRS survey does not have sufficient pathlength to detect such rare, strong absorbers, but the FOS Key Project does, should such absorber systems exist. We do not know if any are present in the L95 and C98 samples, since, as pointed out by Tripp, Lu, & Savage (1998a), neither L95 nor C98 plot the absorbers for which they failed to discover nearby galaxies. We have not included the “failed searches” from C98 in Figure 6. However, the lower limits implied by their non-detections place 2/3 of their absorbers to the right of the dash-dot vertical (“void”) line. We caution that the L95 & C98 galaxy searches do not go very deep and could have left nearby galaxies undetected, to say nothing of dwarf or LSB galaxies.
In Figure 6 we overplot a linear fit that corresponds to the C98 data only and returns a high probability of correctly modeling their data alone (99.99%). Even so, the C98 correlation is quite broad at any or , so that the high correlation coefficient may merely reflect the biases mentioned above against finding galaxy-absorber pairs in the upper left and lower right quadrants of Figure 6. When all the data in Figure 6 are fitted, the correlation coefficients indicate a low probability of correctly modeling the data (0.01%). The solid line in Figure 6 is a linear fit to our GHRS data alone and also returns a low probability of correctly modeling our data (8%).
As seen in Figure 6, the region with 200 kpc () and mÅ () is a nearly uniform scatter plot. Based upon the low probability for the fits to the low- absorbers in Figure 6, we conclude that the results of C98 and L95, the anticorrelation between galaxy impact parameter () and absorber , does not extend above 200 kpc. In fact, when the non-detections of C98 are included (the triangles with downward arrows in Figure 6), it appears that the reported anticorrelation may not extend above 50 kpc (). This distance may be the full extent of gaseous halo material physically associated with the nearby galaxy. Alternately, gaseous halos may extend somewhat further, but with lower covering factor (see Mo & Mao, 2000). In addition, it has been demonstrated (Davé et al., 1999; Linder, 2000) that this anticorrelation can arise even if weaker absorbers are not associated with galaxies in any way.

Taken with the above discussion of the selection biases inherent in the L95 and C98 distributions of Figure 6, we conclude that, while some of the highest column density Ly systems in the local Universe may be associated with the gaseous halos of nearby bright galaxies, the lower column density clouds show no evidence of extending this correlation. In fact, Davé et al. (1999) have reproduced the salient features of Figure 6, including the observed slope shown by the dotted line, using a N-body plus hydrodynamical simulation in which mass feedback from galaxies into the IGM is small. In other words, both the L95/C98 correlation at high and the increasing scatter at low in our data can be explained by these simulations. In Davé et al. (1999) this correlation is reproduced simply because galaxies and Ly clouds both trace the same large-scale structure. The simulations also predict that the correlation should degrade towards lower column density because three distinct populations of clouds, with somewhat different relationships to galaxies, are involved: (1) cold, condensed clouds that are quite close to galaxies (kpc) and are plausibly galaxy halos; (2) highly-ionized absorbers, shock-heated by infalling large-scale structure and thus near “filaments” of galaxies (kpc); and (3) warm, diffuse photoionized clouds that are truly intergalactic and thus much more randomly placed relative to galaxies (kpc). The L95 and C98 absorber samples appear to contain primarily type 1 and 2 clouds, while the GHRS studies consist of types 2 and 3. See IPF99 for a speculative division of local Ly absorbers into these three types described by Davé et al. (1999).
The C98 results that the correlation in Figure 6 are largely independent of the properties of the nearby galaxy lends further support for the contention that this correlation is the result of large-scale structure alone, as Davé et al. (1999) predict. C98 found only a correlation with galaxy luminosity, but not with any star formation properties (e.g., Hubble type or color), which would certainly be expected if these absorbers were due to some pervasive feedback of gas from galaxies into the IGM. Additionally, the “failure” of the sensitive galaxy searches around low- Ly absorbers by Rauch, Weymann, & Morris (1996), van Gorkom et al. (1993, 1996), Shull et al. (1996, 1998), and IPF99 plus the examples of local Ly absorbers found in galaxy voids by Stocke et al. (1995) and this paper, adds considerable evidence to the contention that not all Ly clouds arise in extended gaseous galaxy halos.
Finally, while some authors have suggested that many low column absorbers might be associated with low surface brightness (LSB) galaxies (Impey & Bothun, 1997; Linder, 2000), there are no current data supporting this suggestion. Specifically, Rauch, Weymann, & Morris (1996) searched the 3C 273 field for LSB galaxies at Virgo distances and found none; IPF99 found similar negative results in the Virgo cluster proper. Since many LSB galaxies are H I rich, they should be detected easily by H I images of Ly absorber locations and have not been (van Gorkom et al., 1993, 1996; Shull et al., 1996; Hibbard et al., 2002). New H I and optical surveys are now in progress to address this suggestion further.
4 Ly absorbers and Galaxy Filaments
4.1 The 3C 273/Q 1230+0115 field and absorbers
The proximity of the 3C 273 and Q 1230+0115 sightlines, 0.91° apart in the sky, provides an opportunity to look for common absorbers at very low and thus to infer the sizes of Ly clouds. Due to the depth of galaxy surveys in this region, these two adjacent sightlines also allow an important new method for relating Ly absorbers to galaxies and large-scale structure. Over the range km s-1, these sightlines are separated by (230–550) kpc. Absorbers in that redshift range are located in the southern portion of the Virgo Cluster region. Updated column densities for the two strongest Virgo cluster absorbers along the 3C 273 sightline have been reported by Sembach et al. (2001) on the basis of FUSE spectra.
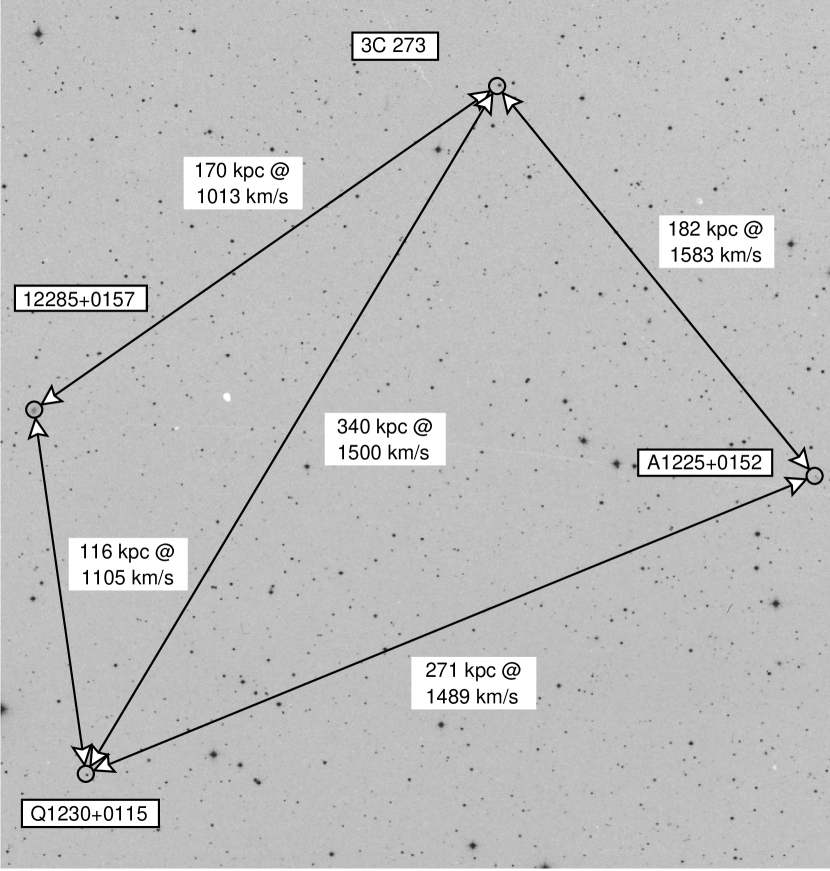
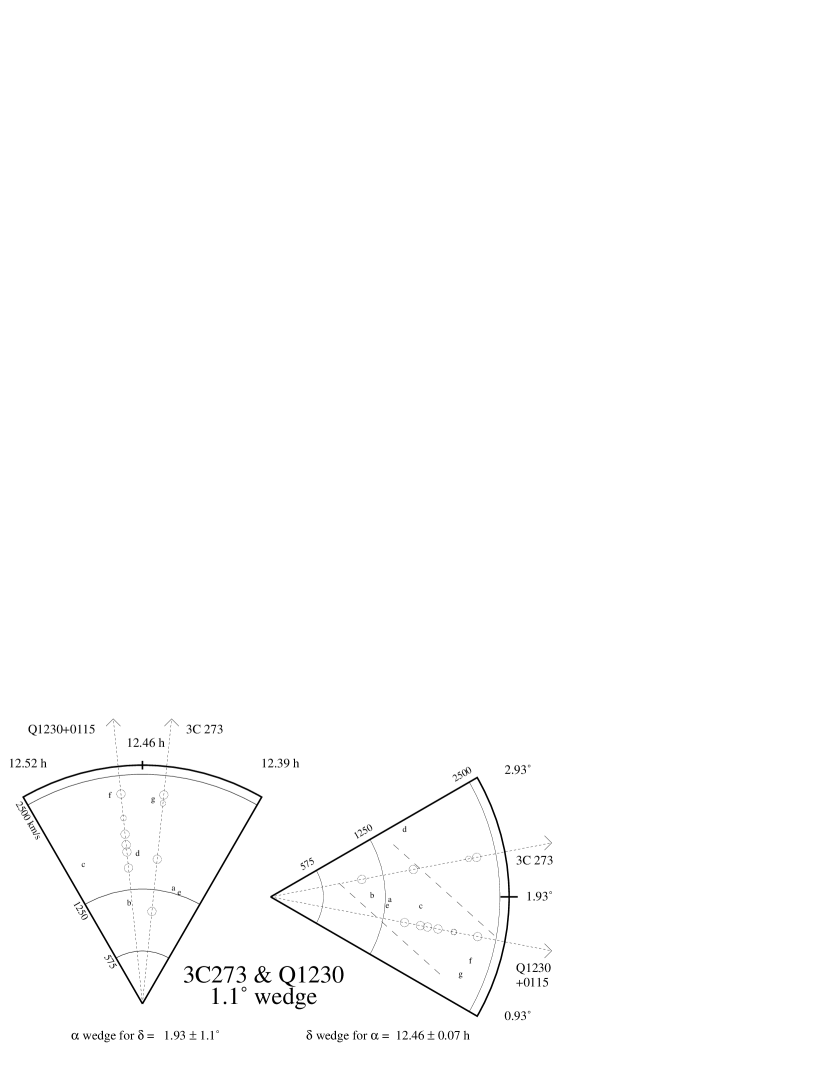
A digitized sky survey (DSS) image around 3C 273 and Q 1230+0115 is presented in Figure 7. Additionally, 1.1° “pie diagrams” for this sightline, centered halfway between the two targets, are shown in Figure 8. Unlike the pie diagrams in Paper I, each galaxy is given its own designating letter in Figure 8. Table 4 lists these galaxies and their relationship to the 3C 273 and Q 1230+0115 sightlines, including by column: (1) the galaxy name in the CfA redshift catalog, (2) the galaxy’s heliocentric radial velocity in km s-1; (3) and (4) the distance in kpc on the sky between the galaxy and the 3C 273 and Q 1230+0115 sightlines, respectively; (5) the letter designation for the galaxy as shown in Figure 8; (6) and (7) the heliocentric velocity of the closest Ly absorber in the 3C 273 and Q 1230+0115 sightline respectively. Galaxies (a) and (b) are the closest to these sightlines and are shown in the image in Figure 7, as well. Galaxy (a), A1225+1052, is also known as the Haynes & Giovanelli H I cloud (Giovanelli et al., 1991) and is composed of two H I peaks, only one of which clearly contains starlight (Salzer, 1991). Galaxy (b), 12285+0157, has been recently studied by Hoffman et al. (1998). Because of infall to the Virgo Cluster, velocity-dependent distance estimates of galaxies in this region are uncertain on the order of 1-2 Mpc; we assume that these “streaming motions” affect galaxies and Ly absorbers the same and do not introduce additional errors to the galaxy-absorber distances. In this Section we will continue to estimate distances using recession velocities and .
A 1° area around the 3C 273 sightline was surveyed for galaxies by Morris et al. (1993) complete to . This region lies within the southern extension of the CfA survey made by Grogin, Geller, & Huchra (1998). At Mpc or =1400 km s-1, the Morris et al. (1993) magnitude limit implies that galaxies have been surveyed in this field down to . Further redshift survey work towards the 3C 273 and Q 1230+0115 sightlines is in progress (McLin et al., 2002).
| Galaxy Name | galaaGalaxy recession velocity. | bbGalaxy to line-of-sight (LOS) distance, perpendicular to the LOS (in kpc). to | bbGalaxy to line-of-sight (LOS) distance, perpendicular to the LOS (in kpc). to | LabelccLabel corresponding to Figure 8. | absddVelocity of nearest Ly absorber along the 3C 273 sightline | abseeVelocity of nearest Ly absorber along the Q 1230+0115 sightline |
|---|---|---|---|---|---|---|
| ( km s-1) | 3C 273 | Q1230+0115 | 3C 273 | Q1230+0115 | ||
| A1225+0152 | 1298 | 182 | 271 | a | 1012 | 1487 |
| 12285+0157 | 1105 | 170 | 116 | b | 1012 | 1487 |
| 12308+0147 | 1643 | 483 | 279 | c | 1583 | 1663 |
| 12277+0254 | 1635 | 260 | 562 | d | 1583 | 1663 |
| A1224+0146 | 1275 | 282 | 294 | e | 1012 | 1487 |
| A1228+0116 | 2289 | 678 | 162 | f | 2287 | 2298 |
| 12270+0107 | 2234 | 677 | 293 | g | 2287 | 2298 |
All eight definite absorbers (3 towards 3C 273 and 5 towards Q 1230+0115) and two possible Ly absorbers (one in each sightline) are presented in the “pie diagram” of Figure 8 as large and small dashed circles respectively. Considering only the definite absorbers, there are two close velocity matches between the sightlines: the 1583 km s-1 (3C 273) absorber matches both with the 1489 and 1665 km s-1 (Q 1230+0115) absorbers. Additionally, a possible absorber at 2287 km s-1 (3C 273) is closely matched with a definite absorber at 2300 km s-1 (Q 1230+0115), which needs better 3C 273 data to confirm. At lower spectral resolution (e.g., FOS at 1 Å), the pair of close absorbers (1489 and 1665 km s-1) in the Q 1230+0115 sightline would be blended and so would be paired with the 1583 km s-1 absorber in the 3C 273 sightline to form a single pair of “common absorbers”. This pairing would suggest a transverse size for this Ly cloud of kpc, similar to values found at higher redshift (e.g., Dinshaw et al., 1995; Impey, 1997). However, four definite absorbers have no counterpart in the other sightline, suggesting upper limits on Ly absorber sizes comparable to, or smaller than, this value.
The information in Figure 7 can be interpreted in terms of the extended galaxy halo hypothesis of L95, in that both galaxies (a) and (b) are close enough to both sightlines to expect Ly absorbers in both spectra by the hypothesis of L95. Indeed, one could plausibly assign both the 1489 km s-1 or 1665 km s-1 absorbers in Q 1230+0115 and the 1012 km s-1 or 1583 km s-1 absorbers in 3C 273 to A1225+0152 (), giving that galaxy a kpc gaseous halo down to approximate column densities of . Although three of the four absorptions are at higher recession velocities than the systemic velocity of A1225+0152, the fact that this galaxy is actually two interacting systems is supporting evidence for this picture. The second H I emission peak is located kpc to the SW of A1225+0152 (Giovanelli et al., 1991), and thus just off the right edge of Figure 7 with an elongated H I halo of diameter 215 kpc at cm-2. It has been speculated that galaxy interactions can increase greatly the gaseous cross-sections of galaxies (Morris & van den Bergh, 1994; van Gorkom et al., 1996), and this set of galaxies and absorbers offers a laboratory to test that hypothesis.
However, the other nearby galaxy, 12285+0157, offers a counter-example to this same hypothesis. While the 3C 273 spectrum has an absorber which plausibly could be associated with this galaxy, being only 100 km s-1 lower than the galaxy velocity, the spectrum of Q 1230+0115 has no absorption within several hundred km s-1 of the galaxy redshift. This is despite the fact that A12285+0157 is closer to the Q 1230+0115 sightline than to that of 3C 273 by a factor of 1.5. At the very least, these two sets of absorbers and galaxies suggest that very extended galaxy halos (if they exist) cannot be spherical with unity covering factor. This is contrary to the suggestion by L95 and C98 that galaxy halos are spherical with large covering factor (see § 4.2 and Bowen, Blades, & Pettini (1996) for further discussions).
Figure 8 suggests an alternative explanation, described by the dashed lines, in which galaxies and clouds in this region occupy a single large “filament” Mpc long, with an aspect ratio of 20:1. This possible alternative interpretation makes all but one of the observed definite absorbers “common” between these two sightlines. A further statistical test that Ly absorbers lie in galaxy “filaments” will be presented in the next section. We await better S/N and resolution spectra for both of these targets, as well as more galaxy redshift survey data in this region to confirm this possible “filament”. Figure 8 shows the value of performing sightline pair experiments at low , where both galaxies and absorbers can be integrated into a common picture of large-scale structure.
4.2 Statistical Tests of Ly Cloud Alignment with Galaxy Filaments
In this section we investigate the statistical relationship between local Ly absorbers and large-scale structure using the distribution of CfA galaxies in (3-11) Mpc diameter spherical or cylindrical regions around each absorber. The purpose of this investigation is to determine whether the local Ly absorbers preferentially align with the large-scale “filaments” of galaxies, to which the Ly clouds are also plausibly related in numerical simulations (Davé et al., 1999). A possible example of such an alignment was presented in the last subsection.
Because the methodology used in this section is new and somewhat complicated, an overview is supplied in this and the next paragraph. The basic approach is similar to comparing the position angle of the absorber to galaxy impact parameter vector (“absorber PA”) to the galaxy major axis, as in C98. Instead we use many nearby galaxies in a specified volume to compare the mean “absorber PA” to the major axis of the galaxy large-scale structure “filament”, composed of these same galaxies. Much of the below discussion is devoted to describing how the “filament” major axis is determined using the mean PA of all galaxy-galaxy vectors. We do not presume that filamentary structure is present in each volume beforehand, just as measurement of a galaxy major axis does not presume a highly flattened structure. We simply use whatever galaxy distribution is present to find the “filament major axis” using the mean of all galaxy-galaxy vectors. As described in detail below, this procedure returns a distribution of PAs which, in the mean, has a full-width-half-maximum of . An important variable in this process is the size of the volume around each absorber, which determines the number of galaxies (N) to be included in this analysis. For our fiducial volume (4.3 Mpc scale size), a typical absorber has several tens of galaxies in this volume but “void absorbers” have only a few, while some very nearby absorbers in very well-surveyed galaxy regions have several hundred (we truncate 200 to avoid any few absorbers from dominating our statistics). Through experimentation we have found that volumes Mpc in scale size contain too few galaxies to determine an accurate “filament” PA; volumes Mpc in scale size are so big that they contain several “filaments” (this is evident in “pie diagrams” from the CfA redshift survey shown in Paper 1), also degrading the accuracy of the “filament” PA. For volumes between these two extremes the “filament” PA can be determined to a mean accuracy of 5 degrees (see discussion below).
Once the “filament” and “absorber” PAs are determined for each volume, we align all vectors to the “filament” PA and co-add the vectors from all volumes in the 4 absorber sample. We then cross-correlate the “filament” PAs with the “absorber” PAs. We then repeat this procedure using “absorber” PAs for a set of “fake” absorbers, randomly located in the same volumes, to supply a comparison baseline. The amount by which the cross-correlation function (CCF) for the real absorbers exceeds the CCF for the “fake”, randomly-distributed, absorbers is the statistical significance to which absorbers are aligned with galaxy “filaments”. Large statistical significances are found for most volumes, as described in detail in the paragraphs below.
To explore the possible relationship between the detected Ly absorptions and galaxy filaments, we compared our 4 sample of absorbers to the large-scale galaxy distribution in the vicinity of each absorber. To do this, we extracted a constant-volume cylinder or sphere from the CfA survey centered on each absorber. The diameter of the sphere and the length and diameter of the cylinder were set to =300 or 450 km s-1 (4.3 or 6.4 Mpc). The choice of =300 km s-1 matches our previous “retarded Hubble flow” model of 300 km s-1 and appears to be a good match to the scale of large-scale structure “filaments” (see below). Additional larger box sizes were also examined to correct for the uncertainties associated with inferring galaxy/absorber distances from redshifts without knowledge of their peculiar velocities (PVs). This is done by allowing an additional 150 km s-1 or 300 km s-1 in PV for both our spherical and cylindrical models. The rationale behind these modified models is to include filament galaxies with large peculiar velocities, which would, if interpreted as pure Hubble flow velocities, place them just outside the sample volume. But, this also includes many more galaxies with low PV at larger distances from the absorbers; i.e., with increasing PV allowance, the region of space and number of galaxies included in our sample increases. In addition, we explored the consequences of different extraction volumes by performing trials for smaller (=200 km s-1) and larger (=600 and 800 km s-1) sizes. We find that volumes smaller than 300 km s-1 are too small to include a large enough number of galaxies to define adequately the large-scale structure, while larger volumes ( 600 km s-1) include more than one large-scale structure “filament”, making the large-scale structure more complicated to interpret (see the “pie diagrams” in Paper I).
For all CfA galaxies in the extracted volume, we first determine the best-fitting ( plane () of the galaxies in the volume using a robust, -minimizing fit. The algorithm reduces the impact of “outliers” which do not reside near the dominant plane, if any, of the galaxies in each extracted volume. Before determining the best-fit plane, we convert and to units of Mpc. Once the dominant plane has been identified, we rotate the galaxy coordinates (X,Y,Z) in Mpc so that the dominant plane is aligned perpendicular to the new Z axis for viewing. This alignment to the coordinate system (X,Y,Z) attempts to remove any viewing angle effect and reduces our exploration to the simple question: When viewed from a consistent “face-on” viewing angle, do our detected absorbers show any preference to be aligned with the filamentary structure seen in galaxy clustering?
Once the extracted CfA regions have been rectified to consistent, face-on viewing angles, we calculate the two-dimensional (2D) position angles (PAs) for all galaxy-galaxy and absorber-galaxy pairs to produce the distribution of PAs for each volume. For all absorber volumes, the dominant galaxy-galaxy PA is located by fitting a Gaussian to the PA distribution and choosing the Gaussian center as the mean PA of the filament. The “raw” PAs are then adjusted to the Gaussian mean PA so that the adjusted distribution is centered at PA=0°; i.e., these adjusted, or aligned, PAs (APAs) are relative to the major axis of the dominant galaxy filament in each volume. Because all absorber volumes now have their PAs zero-pointed to the best-fit, local filament PA, we can co-add the galaxy-galaxy and absorber-galaxy APAs from all volumes into a single distribution. To prevent any one absorber volume from dominating the APA distribution, we use a randomly selected subsample of only 200 galaxies for any volume with more than 200 galaxies. The median number of galaxies in each region for each model are given in Table 5.
Figure 9 shows the “raw” PAs (RPA) for both the galaxy-galaxy and absorber-galaxy pairs in a spherical volume model with PV = 150 km s-1 and = 450 km s-1 diameter. Figure 10 presents the APAs for the same model, and shows that regardless of absorber location, the galaxy-galaxy PAs have a very narrow peak ( FWHM). Thus, in the mean, the “filament” PA can be determined with an accuracy that is a fraction of this; i.e., conservatively. The rather narrow peak for the galaxy-galaxy APA distribution in Figure 10 tells us that the filaments in our sample are not predominantly “sheetlike”; i.e. they do not fill the viewing plane when rectified to “face on”. The broader distribution in the Ly -galaxy APAs is simply due to the inherent number statistics (i.e., N versus N2/2). Also shown in Figures 9 and 10 are “raw” PAs (RPAs) and APAs, respectively, for a comparison sample of random absorber locations within volumes of the same size and shape as the volumes from which the observed PA distributions were extracted. These random locations along our actual GHRS sightlines were constructed in an identical way as in Paper II and § 3.4, accounting for the varying sensitivity and spectral coverage of our observations. Random APAs were also constructed for sightlines randomly placed throughout CfA survey regions of sky, using the median sensitivity function of our observations. This approach approximately matches our HST/GHRS observations in terms of number of sightlines passing through well-surveyed CfA regions (see § 2.3) from . The random APAs from these “all-sky” sightline simulations are nearly identical to our random individual sightline results.


To determine the significances of the differences between the galaxy-random absorber, galaxy-real absorber, and galaxy-galaxy APA distributions, we compare the cross-correlation functions (CCFs) of the APAs. For the galaxy-galaxy APAs, this is obviously the auto-correlation function. For each of our random methods, using our sightlines and the random (“all-sky”) method, we performed Ntrial Monte Carlo simulations, each one simulating our combined HST/GHRS observations, using the median sensitivity function, S(), and our results from Paper II. The value of Ntrial for each model is given in Table 5. For the “all-sky” trials, the median S() was applied.
In Figure 11 we present the CCFs for the =300 and 450 km s-1, PV=0 and 150 km s-1 spherical models. Since these APAs have been adjusted to a zero point corresponding to the dominant PA of galaxy-galaxy vectors in each volume, the large peaks in these distributions indicate the same strong filamentary structure in the galaxy distribution along our sightlines as seen in Figure 10. To calculate the significance of our galaxy-absorber CCF over the random distribution, we compare the area in the central CCF peak to the random distribution. In Figure 11, the (small) error bars represent the 1 standard deviations of the random “all-sky” CCFs. The extent of the central peak, over which we calculate the excess power in the absorber-galaxy CCF, is defined by the locations of zero CCF power in the galaxy-galaxy auto-correlation function (the filament width as defined by the galaxy locations). By dividing the difference in areas by the 1 uncertainty inferred from the random trials, we determine the degree to which absorbers (and galaxies) align with filamentary large-scale structures. These absorber results are given in Table 5. Particularly, for the smaller volumes with no PV allowance, the excess power is large; for the various models. The PV = 300 km s-1, =450 km s-1 model creates a sample region that is the equivalent of 1500 km s-1, or 21.4 Mpc along the line of sight. As seen from the pie diagrams in Paper I, this volume is much larger than most filamentary structures, hampering our ability to correctly identify the dominant filamentary plane and the dominant PA necessary for proper PA zero-pointing. Thus, we believe that the =450 km s-1, PV , and larger volume models, sample too large a volume to determine accurately the local filamentary structure, causing our random and absorber results to appear similiar for both the spherical and cylindrical models. On the other hand, for the 200 km s-1 volume with no PV, there is little power in the random absorber CCF distribution; i.e., this volume is too small to allow the PA of the large-scale filamentary structure in the CfA catalog to be determined accurately. Thus, we believe that the first three models of each type (cylindrical, or spherical volume) in Table 5 give the most accurate representation of absorber-galaxy filament alignment.

| PVaaPeculiar velocity allowance. | Random | Spherical Model | Cylindrical Model | |||||
|---|---|---|---|---|---|---|---|---|
| ( km s-1) | ( km s-1) | MethodbbMethod used to generate the random absorber sightlines; G (GHRS) uses our GHRS sightlines; A (“all-sky”) uses a random distribution of sightlines through well-sampled regions of the CfA catalog. | SLccSignificance Level above random as defined in the text. | NtrialsddNtrials is the number of random trials used. Each random trial matches the number and pathlength of our GHRS sightlines. | median(Ngal) | SL | Ntrials | median(Ngal) |
| 300 | 0 | A | 12.6 | 41 | 74 | 14.8 | 44 | 74 |
| 300 | 150 | A | 11.1 | 16 | 76 | 6.8 | 15 | 76 |
| 450 | 0 | A | 12.0 | 19 | 72 | 8.3 | 27 | 70 |
| 450 | 150 | A | 1.0 | 29 | 74 | 1.0 | 33 | 73 |
| 300 | 0 | G | 8.4 | 41 | 68 | 11.8 | 44 | 68 |
| 300 | 150 | G | 10.2 | 16 | 69 | 6.0 | 15 | 69 |
| 450 | 0 | G | 9.1 | 19 | 68 | 8.3 | 27 | 69 |
| 450 | 150 | G | 1.0 | 29 | 70 | 1.0 | 33 | 71 |
These results agree with results from a simpler two-dimensional analysis which only considers position angle on the sky, without compensation for recession velocity. As seen from the significance levels in Table 5, these trials provide evidence that Ly absorbers align with galaxy filamentary structures in the local Universe. Together with the lack of any correlation between low column density local Ly absorbers and individual galaxies, this result is further proof that the Ly absorbers are related to large-scale structure, not to individual galaxies, in agreement with numerical simulations. This result should also be contrasted with the C98 result that there is no statistical relationship between the “absorber PA” and the major axis of the nearest, bright galaxy. C98 interpret their result as meaning that galaxy halos are spherical with near unity covering factor. But, using a different technique, Bowen, Blades, & Pettini (1996) find a much lower covering factor of 0.4. Therefore, in the light of the present results, where an alignment between Ly absorbers and galaxy filamentary structure has been found, the random location of Ly absorbers with respect to the nearest galaxy may not be indicative of a galaxy halo property at all.
5 / of Ly absorbers in Voids
In this section, we explore the line-of-sight frequency / as a function of for the low- Ly forest divided into void and “supercluster” subsamples. As before, we use only our 4 sample and define a void location as a region of space with no known galaxy within 3 Mpc. We have explored using other methods to define voids along our sightlines, guided by the Slezak et al. (1993) wavelet transform method for defining voids in the original CfA survey. Since several of our GHRS sightlines pass through this region, we have used the Slezak et al. (1993) void boundaries to determine that a allowance from the edges of the supercluster filaments as defined by galaxy locations is an adequate representation of the void boundaries along our sightlines. Alternatively, from the filament center is a slightly more conservative definition of the void boundaries (it yields slightly smaller voids than the first two definitions). The results stated below are for the simple 3 Mpc definition, but all three definitions give the same result within the errors.
As in Paper II, we take / () to be the integrated line-of-sight frequency,
| (1) |
The upper panel of Figure 12 shows / () for our 4 void absorber sample as the solid line, while the supercluster 4 sample is shown by the dashed line. The bins in this figure are 1 mÅ in width, and 1 error bars are given every 20 bins. Given the current limited sample, the ratio of / in superclusters to voids is consistent with a constant value of for all . In other words, % of the low- Ly population are “void” absorbers. At this time, there is no statistically significant evidence that void and supercluster absorbers have different column density distributions, given that there are only 8 “void” absorbers in our sample. However, as can be seen in the bottom panel of Figure 12, which displays /(void) divided by /(SC=supercluster), there may be a slight overabundance of low absorbers in “voids’. This is consistent with our earlier assertions (§ 3.2) that the low absorbers showed a more random distribution.
We now follow the methodology given in Paper II for determining the cosmic baryon density, . In Paper II we estimated that of the local baryonic matter may reside in these Ly absorption systems. The relative number density of Ly absorbers in voids and in superclusters found herein allows a first determination of the baryon density in voids. In Paper II, we pointed out that for isothermal spherical Ly clouds of characteristic radius, ,
| (2) |
where is the space density of the Ly absorbers. While this estimate is dependent upon both the geometry of the absorbers and the intensity of the ionizing radiation impinging on these clouds (see Paper II and Shull et al. (1998) for details), these factors enter here only if they are different for “void absorbers” compared to ”supercluster absorbers”. Thus, by assuming these factors are the same in voids and superclusters, the ratio of baryon density in clusters to that in voids is given by,
| (3) |
Recent galaxy-void surveys have failed to turn up significant number of galaxies in voids down to impressively low luminosity limits (e.g., M McLin et al., 2002; Hibbard et al., 2002). Therefore, since Ly clouds are the only detectable baryons in voids, % of the total baryonic density in the local Universe, inferred upon primordial nucleosynthesis, is contained in voids.

6 Two Point Correlation Functions of Galaxy Halos and Ly Absorbers
In this section, we determine the characteristic width of low- galaxy filaments and voids, and compare the galaxy-galaxy two-point correlation function (TPCF) to the Ly cloud TPCF determined in Paper II. Along each sightline, we extracted a cylindrical “core sample” through the CfA survey volume of galaxies with radii of 0.5, 0.75, and 1 Mpc. The 1D TPCF of the galaxies within these cylinders was determined using the location along the sightline of closest approach to each galaxy. Therefore, this is a measure of the TPCF of extended gaseous halos along these sightlines. As in the previous sections, to ensure approximately uniform galaxy information, we restrict our sightlines to our 4 sample, and to be consistent with our previous TPCFs, we do not include separations 50 km s-1. To obtain information about larger separations, we do not restrict our pathlength to the available GHRS spectral coverage. We use the full “core sample” from a minimum =575 km s-1 to (c– 1,200 km s-1) from the target, provided that the sightline is still in a region of the CfA survey which is complete down to at least . As in Paper II, we normalize by the expected random distribution to obtain the TPCF, . For all trials, we see strong galaxy clustering below 2000 km s-1, peaking at 10 in the lowest separations. The TPCF for the 750 kpc radius trial is displayed in Figure 13 and is quite similar to the other trials.
As is obvious in Figure 13, the galaxy-galaxy TPCF differs significantly from the Ly TPCF and indicates that Ly absorbers cluster nowhere near as strongly as galaxy halos would cluster along these sightlines. Within 750 km s-1, the galaxy-galaxy TPCF has dropped to half of its peak value at the lowest separations. This leads us to the conclusion that the galaxy filaments in our sample are of order 750 km s-1 in velocity width, or 11 Mpc. Peculiar velocities (PVs) would broaden the measured galaxy TPCF, so this estimate of low- filament width is an upper limit. If we assume a PV of 200 km s-1 for galaxies in these filaments, then the actual physical width is 5 Mpc. Therefore, the filaments are either rather broad, or the peculiar velocities within the filaments are large. This result is consistent with the filament widths found in § 4.2.
While the secondary peak at in the galaxy TPCF is exactly the signal predicted by De Lapparent, Geller, & Huchra (1991) associated with galaxy voids of order 25-50 Mpc, we caution that the TPCF presented has insufficient pathlength per sightline to draw firm conclusions at . The presence of Ly clouds in voids is evidenced in Figure 13 by the rather uniform velocity distribution of Ly absorbers compared to the deficiency in the galaxy-galaxy TPCF for . Thus, the Ly absorbers and galaxy halos cluster differently in two respects: (1) the Ly absorbers do not exhibit the large clustering signature seen for the galaxy halos at km s-1 and (2) the Ly absorbers do not exhibit the TPCF deficiency beginning at km s-1 that occurs in the galaxy TPCF. Because the Ly absorbers and galaxy halo TPCFs are significantly different (the K-S probability that they are drawn from the same parent population is ), this gives additional support to the contention that these Ly absorbers are not very extended galaxy halos. However, we caution that there has been a critique of the Ly TPCF methodology by Fernandez-Soto et al. (1996) that claims that unresolved line blending in Ly absorbers can hide significant clustering. Since higher resolution spectra (e.g., STIS echelle) show only modest line blending, and combined HST/FUSE Lyman line curve-of-growth analysis requires only 2–3 components per line to explain discrepancies in -values (Shull et al., 2000), we suspect that effects of blending on the TPCF are small. Further, we see no way that this blending can produce a large TPCF excess at km s-1, 10 to 20 times the velocity resolution of our data.

7 Conclusions
This paper is the third in a series whose purposes are to discover very low-, low column density ( cm-2) Ly absorbers, determine their basic properties (e.g., line density, -value distribution, TPCF amplitude, etc.), and determine their relationship with galaxies, voids, and large-scale structure in the local Universe. The papers in this series use Ly detections made with the GHRS aboard the HST and utilized the G160M medium resolution first-order grating to obtain spectral resolution and limiting s as low as . Future papers in this series will continue this investigation using newer spectra obtained with the Space Telescope Imaging Spectrograph (STIS) plus medium resolution gratings, which have similar spectral resolution and limiting to the GHRS data.
In this paper we have used the Revised CfA Galaxy Redshift Catalog to compare the detected Ly absorber locations to the actual galaxy distribution at low . For the full sample, distances between Ly absorbers and the nearest known CfA catalog galaxy neighbors range from kpc to Mpc. Because galaxy redshift information is non-uniform across the sky, we constructed a sub-sample of 46 Ly absorbers. These absorbers are located in regions of the CfA catalog that have been completely surveyed down to at least galaxies to achieve some level of consistency in the Ly-galaxy correlation analysis. For the majority of our studies, we restrict ourselves to this 4 sample.
From the specific statistical results summarized below, we find no strong evidence that low column density, low- Ly absorbers arise in very extended galaxy halos. These absorbers may be a different population than some or all of the higher column density absorbers studied by L95 and C98. However, the absorbers do show a significant correlation with the large-scale distribution of galaxies. This conclusion is consistent with numerical simulations (e.g., Davé et al., 1999) of large-scale structure formation in which the low column density Ly absorbers are true intergalactic material, not gas recycled by galaxies into the IGM. Observational work from several other groups (IPF99, Morris et al. 1993; Rauch et al. 1996; Tripp & Savage 1998, IPF99) support this interpretation. The results that draw us to this conclusion are:
-
•
Of our 46 4 HST/GHRS Ly absorbers, 38 are within or near large-scale galaxy structures (filaments), while 8 are in galaxy voids. These percentages are similar, whether we use a nearest galaxy distance of 3 Mpc, or the distribution of galaxies to define the approximate regions of supercluster and void along our sightlines. Accounting for pathlength and sensitivity, we find that % of low- Ly absorbers are in galaxy voids.
-
•
While there are six absorber galaxy pairs in sufficiently close proximity (kpc) to an galaxy to be considered galaxy halos by previous work (L95, C98), the median distance between Ly absorbers and galaxies in our 4 sample is kpc, too large to be a plausible galaxy halo.
-
•
In a cumulative nearest-neighbor distance distribution, our Ly absorbers lie intermediate between random locations in space (median distance = 3 Mpc) and locations of galaxies (median distance to nearest galaxy = 250 Mpc). The median distance between Ly absorbers and galaxies is 500 kpc, twice the median separation between bright galaxies. This is further evidence to doubt the association of Ly clouds with individual galaxies. The strongest absorbers ( mÅ) have nearest-galaxy distributions more similar to galaxies, while the weaker absorbers ( mÅ) cluster more weakly. But the stronger absorbers still do not cluster as strongly as galaxies cluster (4 difference). Although we have used different techniques for investigating the absorber-galaxy relationship, these results are similar to those recently reported by Tripp, Lu, & Savage (1998a) and IPF99.
-
•
We find no correlation between Ly absorber equivalent width and the sightline impact parameter with the nearest galaxy for low- absorbers, in contrast to the Lanzetta et al. (1995) and Chen et al. (1998) results at higher . This lack of correlation is consistent with predictions of N-body+hydrodynamical simulations of the local Ly forest (Davé et al., 1999), in which most absorbers and galaxies occupy the same large-scale structure filament. The L95 and C98 interpretation that Ly absorbers are extended galaxy halos cannot be extrapolated to lower H I column densities and larger impact parameters than kpc. Likewise, our interpretation that Ly absorbers are intergalactic in nature cannot necessarily be extrapolated to the highest column densities and smallest impact parameters (kpc).
-
•
A detailed examination of the Q 1230+0115/3C 273 field for common absorbers, separated by only 0.9° on the sky (230–550 kpc at km s-1), is incompatible with a model in which spherical galaxy halos of high covering factor account for the observed Ly absorbers. A possible filamentary gas structure Mpc long can contain both galaxies and absorbers, and explains almost all the Ly absorbers in this field. This example suggests that Ly absorber studies combined with galaxy redshift surveys have the potential to map out local filamentary structure in both galaxies and gas (i.e., “cosmic tomography”).
-
•
We have compared statistically the location of Ly absorbers relative to galaxies in known filamentary structures and find evidence, at the 5 to 12 significance level, that Ly absorbers are aligned with large-scale “filamentary” structures in the local Universe. This result reinforces our inference, based upon nearest-neighbor distances that these Ly absorbers are related to large-scale structure filaments, not individual galaxies.
-
•
In Paper II we presented a two-point correlation function (TPCF) for Ly absorber locations in the local Universe which found no excess power at and a 4 excess at . Thus, local Ly absorbers cluster together only very weakly, similiar to the clustering properties of Ly absorbers at (Rauch et al., 1992), and much less than galaxies cluster with each other. The difference between the clustering of galaxies and Ly clouds was shown explicitly in this paper by constructing a TPCF of galaxy halos. The galaxy halo TPCF shows excess power at km s-1, as well as a deficiency starting at km s-1, which may be a signature of galaxy voids (De Lapparent, Geller, & Huchra, 1991). The Ly absorber TPCF shows neither of these signatures.
In Paper II we estimated that % of the local baryonic matter may reside in Ly absorption systems. Using the relative number density of Ly absorbers in voids and in superclusters (/(voids) is % of /(total)), allows a first determination of the baryon density in voids: % of the total baryonic density inferred from primordial nucleosynthesis. This number should provide useful constraints on simulation of large-scale structure formation. Because these absorbers are the only detected material in voids, and because their total mean baryonic content (in both superclusters and voids) is comparable to that in galaxies, it is important to understand the details of their number density, physical conditions, metal abundance, and distribution in space relative to galaxies.
The HST/GHRS study presented in Papers I through III of this series have provided an important first step towards a detailed understanding of this important universal component. Future papers in this series will continue to refine the results herein by presenting: (1) updated statistical values (e.g., a revised TPCF) for low column density clouds based upon both the present dataset and spectra obtained with STIS/G140M (Penton, Stocke, & Shull, 2002); (2) an updated analysis of the mean galaxy density surrounding local Ly clouds similar to that conducted by Grogin & Geller (1998) but with many more absorbers (Grogin et al., 2002), and (3) deep galaxy surveys in regions surrounding the GHRS and STIS sightlines to determine if low luminosity and/or low surface brightness galaxies are responsible for Ly absorptions, particularly the “void absorbers” (McLin et al., 2002; Hibbard et al., 2002).
References
- Bahcall et al. (1993) Bahcall, J. N., et al. 1993, ApJS, 87, 1
- Bowen, Blades, & Pettini (1996) Bowen, D. V., Blades, J. C., & Pettini, M. 1996, ApJ, 464, 141
- Cen et al. (1994) Cen, R., Miralda-Escudé, J., Ostriker, J. P., & Rauch, M. 1994, ApJ, 437, L9
- Chen et al. (1998) Chen, H.-W., Lanzetta, K. M., Webb, J. K., Barcons, X. 1998, ApJ, 498, 77 (C98)
- Chen et al. (2001) Chen, H.-W., Lanzetta, K. M., Webb, J. K., Barcons, X. 2001, ApJ in press (astro/ph 0107137)
- Cristiani et al. (1997) Cristiani et al. 1997, in Structure and Evolution of the IGM from QSO Absorption Lines, eds. P. Petitjean & S. Charlot, (Paris: Editions Frontières), 165
- Davé et al. (1999) Davé, R., Hernquist, L., Katz, N., & Weinberg, D. 1999, ApJ, 511,521
- De Lapparent, Geller, & Huchra (1991) De Lapparent, V., Geller, M. J., & Huchra, J. P. 1991, ApJ, 369, 273
- Dinshaw et al. (1995) Dinshaw, N., Foltz, C. B., Impey, C. D., Weymann, R. J., & Morris, S. L. 1995, Nature, 373, 223
- Fernandez-Soto et al. (1996) Fernandez-Soto, A., Lanzetta, K.M., Barcons, X., Carswell, R.F., Webb, J.K. & Yahil, A. 1996 ApJ, 460, L85
- Giovanelli et al. (1991) Giovanelli, R., Williams, J. P., & Haynes, M. P. 1991, AJ, 101, 1242
- Grogin & Geller (1998) Grogin, N. A., & Geller, M. J. 1998, ApJ, 505, 506 (GG98)
- Grogin, Geller, & Huchra (1998) Grogin, N. A., Geller, M. J., & Huchra, J. P. 1998, ApJS, 119, 277 (GGH)
- Grogin et al. (2002) Grogin, N. A., Penton, S. V., & Stocke, J. T. 2002, in preparation
- Hernquist et al. (1996) Hernquist, L., Katz, N., Weinberg, D. H., & Miralda-Escudé, J. 1996, ApJ, 457, L51
- Hibbard et al. (2002) Hibbard, J. E., van Gorkom, J., Stocke, J. T., and McLin, K. 2002, in preparation
- Hoffman et al. (1998) Hoffman, G. L., Lu, N. Y., Salpeter, E. E., Connell, B. M. and Fromhold-Treu, R. 1998, ApJ, 500, 789
- Huchra et al. (1992) Huchra, J., Geller, M., Clemens, C., Tokarz, S., & Michel, A. 1992, Bull. C.D.S., 41, 31
- Huchra, Vogeley, & Geller (1999) Huchra, J. P., Vogeley, M. S., & Geller, M. J. 1999, ApJS, 121, 287
- Impey (1997) Impey, C. D., 1997, in Structure and Evolution of the IGM from QSO Absorption Lines, eds. P. Petitjean & S. Charlot, (Paris: Editions Frontières), 101
- Impey & Bothun (1997) Impey, C. & Bothun, G. 1997, ARA&A, 35, 267
- Impey, Petry & Flint (1999) Impey, C. D., Petry, C. E., & Flint, K. P. 1999, ApJ, 524, 536 (IPF99)
- Jannuzi et al. (1998) Jannuzi, B. T., et al. 1998, ApJS, 118, 1
- Lanzetta et al. (1995) Lanzetta, K. M., Bowen, D. V., Tytler, D., & Webb, J. K. 1995, ApJ, 442, 538 (L95)
- Linder (2000) Linder, S. M. 2000, ApJ, 529, 644
- Marzke et al. (1994) Marzke, R. O., Huchra, J. P., & Geller, M. J. 1994, ApJ, 428, 43
- Marzke, Huchra, & Geller (1996) Marzke, R. O., Huchra, J. P., & Geller, M. J. 1996, AJ, 112, 1803
- McLin et al. (2002) McLin K., Stocke, J. T., Weymann, R. J., Penton, S. V., & Shull, J. M., 2002, ApJ, in preparation
- Mo & Morris (1994) Mo, H. J. & Morris, S. L. 1994, MNRAS, 269, 52
- Mo & Mao (2000) Mo, H. J. & Mao, S. 2000, MNRAS, 318, 163
- Morris et al. (1991) Morris, S. L., Weymann, R. J., Savage, B. D., & Gilliland, R. L. 1991, ApJ, 377, L21
- Morris et al. (1993) Morris, S. L., Weymann, R. J., Dressler, A., McCarthy, P. J., Smith, B. A., Terrile, R. J., Giovanelli, R., & Irwin, M. 1993, ApJ, 419, 524
- Morris & van den Bergh (1994) Morris, S. L., & van den Bergh, S. 1994, ApJ, 427, 696
- Penton, Stocke, & Shull (2000a) Penton, S. V., Stocke, J. T., & Shull, J. M. 2000a, ApJS, 130, 121 (Paper I)
- Penton, Shull, & Stocke (2000b) Penton, S. V., Shull, J. M., & Stocke, J. T. 2000b, ApJ, 544, 150 (Paper II)
- Penton, Stocke, & Shull (2002) Penton, S. V., Stocke, J. T., & Shull, J. M. 2002, in preparation (Paper IV)
- Ramella, Geller, & Huchra (1992) Ramella, M., Geller, M. J., & Huchra, J. P. 1992, ApJ, 384, 396
- Rauch et al. (1992) Rauch, M., Carswell, R. F., Chaffee, F. H., Foltz, C. B., Webb, J. K., Weymann, R. J., Bechtold, J., & Green, R. F. 1992, ApJ, 390, 387
- Rauch, Weymann, & Morris (1996) Rauch, M., Weymann, R. J., & Morris, S. L. 1996, ApJ, 458, 518
- Salzer (1991) Salzer, J. J., di Serego Alighieri, S., Matteucci, F., Giovanelli, R., & Haynes, M. P. 1991, AJ, 101, 1258
- Sargent (1987) Sargent, W. L. W. 1987 in QSO Absorption Lines, ed. J. C. Blades, D. Turnshek & C. A. Norman (Cambridge: Cambridge Univ. Press), 1.
- Sembach et al. (2001) Sembach, K. R, Howk, J. C., Savage, B. D., Shull, J. M., & Oegerle, W. R., 2001, ApJ, in press (astro-ph/0108047)
- Shull et al. (1996) Shull, J. M., Stocke, J. T., & Penton, S. V. 1996, AJ, 111, 72
- Shull (1997) Shull, J. M. 1997, in Structure and Evolution of the IGM from QSO Absorption Lines, ed. P. Petitjean & S. Charlot, (Paris: Editions Frontières), 101
- Shull et al. (1998) Shull, J. M., Penton, S. V., Stocke, J. T., Giroux, M. L., van Gorkom, J. H., Lee, Y. H., & Carilli, C. 1998, AJ, 116, 2094
- Shull, Penton, & Stocke (1999a) Shull, J. M., Penton, S. V., & Stocke, J. T. 1999a, PASA, Vol. 16, No. 1, 95
- Shull et al. (1999b) Shull, J. M., Roberts, D., Giroux, M. L., Penton, S. V., & Fardal, M. A. 1999b, AJ, 118, 1450
- Shull et al. (2000) Shull, J. M. et al. 2000, ApJ, 538, L13
- Slezak et al. (1993) Slezak, E., de Lapparent, V. & Bijaoui, A. 1993, ApJ, 409, 517
- Songaila & Cowie (1995) Songaila, A., & Cowie, L. L. 1995, AJ, 112, 335
- Stocke et al. (1995) Stocke, J. T., Shull, J. M., Penton, S. V., Donahue, M., & Carilli, C. 1995, ApJ, 451, 24
- Tripp, Lu, & Savage (1998a) Tripp, T. M., Lu, L., & Savage, B. D. 1998a, ApJ, 508, 200
- Tripp, Lu, & Savage (1998b) Tripp, T.M., Lu, L., & Savage, B. D. 1998b, in The Scientific Impact of the Goddard High Resolution Spectrograph, ASP Conference Series, Vol. 143, ed., J. C. Brandt, T. B. Ake, C. C. Peterson, 261
- Tytler et al. (1995) Tytler, D., Fan, X.-M., Burles, S., Cottrell, L, Davis, C., Kirkman, D., & Lin, Z. 1995, in QSO Absorption Lines, ed. G. Meylan (Berlin: Springer), 289
- van Gorkom et al. (1993) van Gorkom, J. H., Bahcall, J. N., Jannuzi, B. T., & Schneider, D. P. 1993, AJ, 106, 2213
- van Gorkom et al. (1996) van Gorkom, J. C., Carilli, C. L., Stocke, J. T., Perlman, E. S., & Shull, J. M. 1996, AJ, 112, 1397
- Weymann (1995) Weymann, R. J., 1995, in QSO Absorption Lines, ed. G. Meylan (Berlin: Springer), 3
- Weymann et al. (1998) Weymann, R. J. et al. 1998, ApJ, 506, 1
- Zhang et al. (1997) Zhang, Y., Meiksin, A., Anninos, P., & Norman, M. 1997, ApJ, 495, 63