V4641Sgr – Super-Eddington source enshrouded by an extended envelope
An optical spectroscopy of an unusual fast transient V4641 Sgr
constrains its mass to 8.7-11.7 ( is the best fit
value) and the distance to 7.4–12.3 kpc (Orosz et al. (2001)). At this distance
the peak flux of 12 Crab in the 2–12 keV energy band, measured by ASM/RXTE,
implies the X-ray luminosity exceeding erg/s, i.e.
near or above the Eddington limit for a black hole.
An optical photometry shows that at the peak of the optical outburst the visual
magnitude increased by relative to the quiescent
level and reached . An assumption that this optical
emission is due to irradiated surface of an accretion disk or a companion
star with the the black body shape of the spectrum would mean that the
bolometric luminosity of the system exceeds .
We argue that the optical data strongly suggest presence of
an extended envelope surrounding the source which absorbs primary X–rays
flux and reemits it in optical and UV. The data also suggests that this
envelope should be optically thin in UV, EUV and soft X-rays.
The observed properties of V4641 Sgr at the
peak of an optical flare are very similar to those of SS433. This envelope
is likely the result of near or super Eddington rate of mass accretion
onto the black hole and it vanishes during subsequent evolution of the
source when apparent luminosity drops well below the Eddington value. Thus this
transient source provides us direct proof of the dramatic change in the
character of an accretion flow at the mass accretion rate near or above the
critical Eddington value as predicted long time ago by the theoretical models.
Key Words.:
accretion, accretion disks – black hole physics – stars: binaries: general – stars: individual:(V4641 Sgr, SS433) – X-rays: general – X-rays:stars1 Introduction
The X-ray transient V4641 Sgr was discovered in February 1999 (in’t Zand et al. (1999), Markwardt, Swank & Marshall (1999)) and since then it has demonstrated moderate X-ray activity during approximately a half of a year at a level of 10 mCrab (Markwardt, Swank & Morgan (1999), Revnivtsev et al. (2001)). In September 1999 it entered a period of violent X-ray and optical activity, during which the X-ray flux peaked at Crab (Smith, Levine & Morgan (1999)) and observed optical brightness peaked at (Stubbings (1999), Kato et al. (1999)). After a few days of a strong activity in the optical (Kato et al. (1999)), radio (Hjellming et al. (2000)) and X-ray (Revnivtsev et al. (2001)) bands the source became undetectable in radio and X-rays, and returned back to the quiescent level in optics. It should be noted that an unusual optical activity of this object was discovered more than 20 years ago by Goranskij (1978), indicating that the source is a recurrent transient.
A detailed analysis of the X–ray data will be reported elsewhere (Revnivtsev et al., 2001). In this Letter we concentrate on the implications of the available optical data (Goranskij (1978), Goranskij (1990), Kato et al. (1999), Orosz et al. (2001)) and demonstrate that these data strongly suggest presence of an extended envelope surrounding the source.
2 Optical evidence for the envelope
Optical spectroscopic observations of V4641 Sgr performed at the quiescence led to its identification as a high mass black hole binary with an orbital period of days and the primary and secondary masses of and . Optical observations also constrains the source distance to 7.4–12.3 kpc (Orosz et al. (2001)). This new distance measurements dramatically changed our understanding of the source. At this distance the peak flux of 12 Crab measured by ASM/RXTE implies that the 2-12 keV luminosity of the source exceeds erg/s, i.e. is near or above the Eddington luminosity for a black hole.
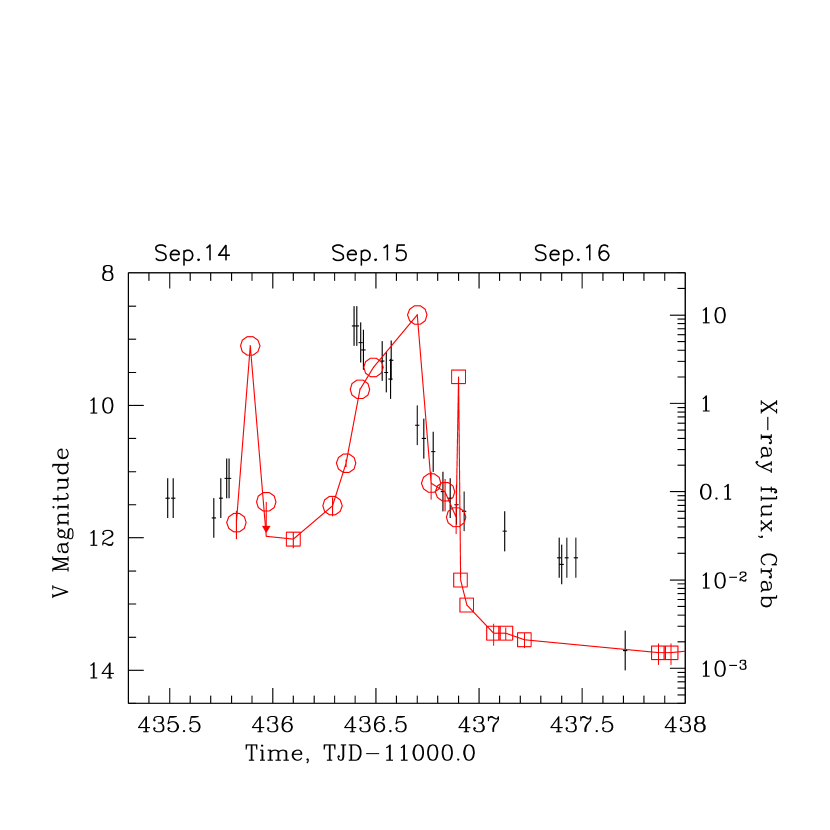
The most remarkable property of V4641 Sgr was revealed by the optical photometry during the giant outburst in Sep. 1999. The available optical and X–ray data are shown in Fig.1. The whole outburst was rather short and there is a gap in optical data between Sept. 14.8 and 15.4. The X-ray data are mostly those of ASM/RXTE with the sampling interval of approximately 1.5 hour. The existing optical data suggest that the optical brightness started to increase around Sept. 14.8, 1999, approximately at the time of the first outburst in X-rays. The peak of the optical brightness however does not coincide with any of the 3 peaks observed in X-rays. Moreover, during the peak of X-ray flux on Sep.15.7, 1999 the optical flux shows steady decline uncorrelated with the behavior in X-rays. In general the data shown in Fig.1 suggest a relatively smooth evolution of the optical flux and an erratic multi-peaked behavior in the X-rays. The peak in the optical flux appears to coincide with the minimum of X-ray flux although the possibility of short outburst(s) occurring between the X-ray points can not be entirely excluded.
A lower limit on the peak source luminosity can be obtained from the ASM data. The maximum flux measured by ASM during the giant outburst was Crab. The ASM observation, likely missed the very peak of the outburst, therefore the actual peak flux might be higher. Using the source count rates in three ASM energy channels and the Crab count rates in these channels as a reference for the flux estimates, we can obtain the 1.3-12 keV energy flux from V4641 Sgr at the peak of the X-ray outburst – erg/s/cm2. At the distance of 9.6 kpc (7.4 – 12.3 kpc at the 90% confidence) it would correspond to the 1.3-12 keV luminosity in excess of () erg/s. On the other hand, the Eddington luminosity for a () is erg/s ( erg/s). We therefore conclude that at the peak of the outburst of V4641 Sgr the 1.2-12 keV luminosity alone exceeded critical Eddington luminosity by a factor of a few: ().
Because of the gap in data between Sept. 14.8 and 15.3 the optical observations also likely missed the peak of the optical outburst, therefore the maximal visual brightness at the peak corresponds to . The interstellar reddening in the direction of the source, (Orosz et al. (2001)), corresponds to the extinction of . The extinction corrected flux at exceeds erg/s/cm2/keV, which approximately corresponds to the source luminosity in the optical spectral band of ergs/s. Note here, that even the optical data alone give us the near-Eddington source luminosity.
Increase of optical flux is observed during X–ray outbursts in many X-ray binaries (e.g. van Paradijs & McClintock (1995)). The star itself can not change its internal brightness significantly in a time scale of days or months. Therefore it is usually assumed that the optical emission in the low mass X-ray binaries (which have very weak optical companions) is due to the irradiated accretion disk and the irradiated side of the secondary star (e.g. Lyutyi & Sunyaev, 1976). However, in the case of high mass companions (like V4641 Sgr), which already have quite powerful optical star companion, it is extremely difficult to increase the optical luminosity of the system by a factor of 100. To the best of our knowledge, this is the only case, when the high mass binary system optical brightness has changed by such a large factor. If we assume that the peak optical flux is due to the optically thick thermal emission of the accretion disk or a companion star we can estimate the bolometric luminosity of system required to explain the observed optical flux.
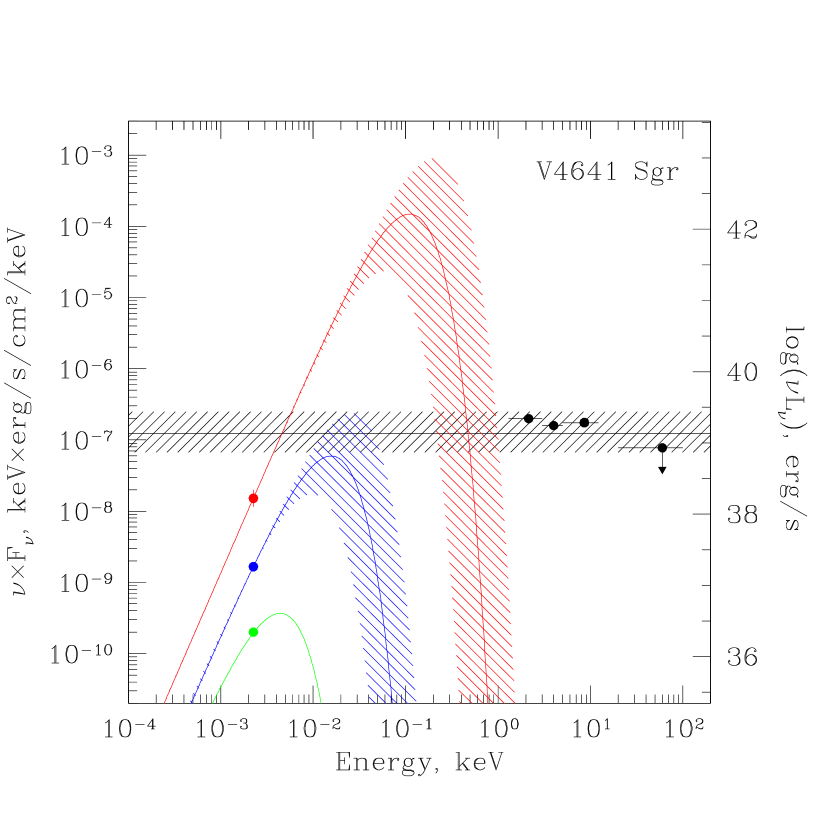
The size of the accretion disk in the binary system can be assumed to be a fraction of the size of the Roche lobe of the primary, where , according to different estimations, is of the order of 0.3–0.6 (see e.g Paczynski (1977)). Using this radius of the emitting region and the observed optical flux we can estimate the temperature of the emitting region assuming the simplest Plank shape of the spectrum. The obtained temperature is close to K. Since the irradiated disk is optically thick and is emitting black body spectrum its bolometric luminosity can be estimated as few ergs/s. In Fig.2 we present the black body models of the spectra of V4641 Sgr during three stages of its flux history - from the bottom to the top - the quiescent, pre-outburst and the peak optical activity. The shaded areas around the spectra show the allowed regions of spectral flux densities, taking into account the freedom in the system parameters. It is immediately seen that within the irradiation model the bolometric luminosity of V4641 Sgr at the peak of optical outburst should of the order of – ergs/s for any choice of the binary system parameters. The same conclusion is reached if we assume that the irradiated surface of the secondary star is responsible for the observed optical flux.
It is very unlikely that the source powered by an accretion can have the luminosity 2–3 orders of magnitude higher than the Eddington value. Therefore one has to consider alternative scenarios.
As was suggested already in 1970s (e.g. Shakura & Sunyaev (1973)), a super-critical accretion onto a black hole could result in the formation of a wind, or geometrically thick envelope. Such an envelope, under certain circumstances, could be optically thick for a) X-ray photoabsorption, and b) infrared and optical emission, but still optically thin in UV, EUV and soft X-rays, where the bulk of energy can be emitted. Below we assume that such an envelope, intercepting X–ray flux from the source and reradiating in optical and UV bands, is responsible for the observed optical emission. Detailed calculations of the radiation transport in the envelope is beyond the scope of our paper, but some rough estimates of the envelope temperature and density are possible.
First of all, let us assume that the optical emission has a thermal origin. If one takes too low temperature of the emitting region, e.g. K, then, given the observed optical flux of the system, the required size of the emitting region (even under assumption of a black body spectrum) is much larger than the size of the binary system, which is unlikely. On the other hand, for a too high temperature of the envelope, e.g. K, the required size of the emitting region is smaller, but the bolometric luminosity inevitably will exceed the Eddington value even under assumption of an optically thin emission spectrum. Only for some intermediate values of temperature the size of the emitting region can be made comparable to the binary system size with the bolometric source luminosity below the Eddington value. In the discussion below we will assume the temperature of the envelope of K. The envelope is then optically thick in optics, is getting optically thin in UV and EUV and is optically thick for X-ray photoabsorption.
In order to absorb (via photoabsorption) most of the energy emitted in X-rays the hydrogen column density of the envelope (where is the hydrogen density of the envelope) has to be at least of the order of cm-2, which means Compton thick envelope. On the other hand, maximum radiation efficiency in the optical band is achieved if the the line of sight emission measure of the envelope is cm-5 (depending on the contribution of the opacity in the lines to the total opacity of the envelope). Such line of sight emission measure implies that the envelope is optically thick in the optical band (for the assumed temperature of K). Line of sight emission measure however should not be much larger than this value. Otherwise the envelope would become optically thick in UV and EUV the the luminosity would exceed the Eddington value. Thus, assuming the homogeneous envelope (which is obviously large oversimplification) we can conclude that for the size of the envelope few (i.e. of the order of size of the Roche lobe of the primary) the density should be about cm-3. The total mass of the envelope is then g. It is interesting that for with an Eddington mass accretion rate of g/s (for a black hole) such a mass can be accumulated during – s. Cooling time of the envelope is much shorter – of the order of seconds.
Thus the optical data suggest that there is an absorbing/reprocessing envelope surrounding the source. In such a model a relatively smooth behavior of the optical luminosity would reflect the total intrinsic luminosity of the source and the amount of X–rays absorbed by the reprocessing region. The evolution of suggests that the geometry of absorbing/reprocessing region changes with time. At the maximum of the optical light curve most of the X–rays are probably absorbed, while later (at the X–ray maximum) the dominant fraction of X–rays is directly observed. Rapid changes in X–ray flux could be due to changes of the geometry of the absorbing region (e.g. edge of the torus obscuring line of sight) or thermal instability in the gas which causes fragmentation of the medium into separate clouds. During these transitions the distribution of the energy emitted in different energy bands (e.g. in optical/UV and in X-rays) could change strongly depending on the parameters of the envelope, while the bolometric luminosity of the source behaves much smoothly and reflects the mass accretion rate onto the black hole.
Note that the enhanced optical activity, observed during approximately 2 weeks before the giant outburst (the middle curve on the Fig.2, Kato et al. (1999)) and the optical activity observed by Goranskij (1978) could also be explained in the frame of the model with the emitting extended envelope. During these observations was (two magnitudes brighter than that during the quiescence). Assuming a black body shape of the spectrum and the size of the emitting region of the order of the size of the accretion disk one can estimate the temperature of the emitting region to be of the order of 40,000-50,000K. This temperature is again far too high for the irradiated disk or a star (e.g Lyutyi & Sunyaev 1976), especially taking into account the value of the X-ray flux, observed simultaneously (Revnivtsev et al. (2001)). The observed optical flux at this stage could still correspond to near-Eddington bolometric luminosity if the temperature of the envelope is 10 times lower than that during the brightest optical flare. This is possible if the line of sight emission measure and geometrical dimensions of the envelope are the same. The optical depth for UV and EUV radiation in this case would be much higher.
3 Comparison with SS 433
The difficulties with the estimates of the bolometric luminosity of V4641 Sgr during the outburst described above resemble those with the well known source SS 433. Hubble Space Telescope observations of SS 433 have detected the source in UV at . The brightness temperature of the optical emission was estimated to be K (Dolan et. al (1997)). The energy flux, observed in UV spectral band is ergs/s/cm. After the correction for the interstellar absorption, the luminosity of the source in UV is ergs/s. The bolometric source luminosity, calculated using the parameters of the optical-UV emission, presented in Dolan et al (1997) is around ergs/s. This value is strongly super-Eddington even for mass of the compact object. However, if we assume that in the vase of SS 433 we also observe the envelope, which is optically thick in optical and UV spectral bands, but still optically thin in EUV spectral band, then the estimate of the source bolometric luminosity can be strongly reduced, and become close to Eddington luminosity for the black hole.
4 Conclusion
In this Letter we showed that the optical observations of X-ray transient V4641 Sgr strongly suggest that there is a massive envelope enshrouding the source. This envelope is likely the result of near or super Eddington rate of mass accretion onto the black hole. During this state the V4641 Sgr closely resembles another unique object – SS 433, which is also thought to be a Super Eddington accretor. Fraction of bolometric luminosity emitted in different energy bands strongly depends on the parameters of the envelope and, thus, observed optical and X–ray fluxes can evolve in a complicated and uncorrelated way. As the mass accretion rate onto the black hole drops well below the Eddington value the envelope vanishes. Thus this transient source provides us for the first time a direct proof of the dramatic change in the character of an accretion flow at the mass accretion rate near or above the critical Eddington value as it was predicted long time ago by the theoretical models.
Acknowledgements.
This research has made use of data obtained through the High Energy Astrophysics Science Archive Research Center Online Service, provided by the NASA/Goddard Space Flight Center. The work was done in the context of the research network ”Accretion onto black holes, compact objects and protostars” (TMR Grant ERB-FMRX-CT98-0195 of the European Commission).References
- Dolan et. al (1997) Dolan J., Boyd P., Fabrika S. et al. 1997, A&A, 327, 648
- Goranskij (1978) Goranskij V.P. 1978, Astrn.Tsirk., 1024, 3
- Goranskij (1990) Goranskij V.P. 1990, Inf. Bull. Variable Stars 3464
- Hjellming et al. (2000) Hjellming R., Rupen M., Hunstead R. et al. 2000, ApJ, 544, 977
- in’t Zand et al. (1999) in’t Zand J, Heise J., Bazzane A. et al. 1999, IAU Circ. 7254
- in’t Zand et al. (2000) in’t Zand J., Kuulkers E., Bazzano A. et al. 2000, A&A, 357, 520
- Kato et al. (1999) Kato T., Uemura M., Stubbings R. et al. 1999, Inf. Bull. Variable Stars 4777
- Lyutyi & Sunyaev (1976) Lyutyi V, Sunyaev R. 1976, Soviet Astronomy, 20, 290
- Markwardt, Swank & Marshall (1999) Markwardt C., Swank J., Marshall F. 1999, IAU Circ. 7120
- Markwardt, Swank & Morgan (1999) Markwardt C., Swank J., Morgan E. 1999, IAU Circ. 7257
- Orosz et al. (2001) Orosz J., Kuulkers E., van der Klis M., et al. 2000, ApJ, 555, 489
- Paczynski (1977) Paczynski B. 1977, ApJ, 216, 822
- Revnivtsev et al. (2001) Revnivtsev M., Gilfanov M., Churazov E., Sunyaev R. 2001, A&A submitted
- Smith, Levine & Morgan (1999) Smith D., Levine A. & Morgan E. 1999, IAU Circ. 7253
- Shakura & Sunyaev (1973) Shakura N.I., Sunyaev R.A. 1973, A&A, 24, 337
- Stubbings (1999) Stubbings R. 1999, IAU Circ. 7253
- van Paradijs & McClintock (1995) van Paradijs J., McClintock J. 1995, in X-ray Binaries, eds. W.H.G. Lewin, J. van Paradijs, and E.P.J. van den Heuvel (Cambridge: Cambridge Univ.Press), p. 58