X-ray Spectra and Light Curves of AR Lac: Temperature Structure, Abundances, and Variability.
Abstract
We observed AR Lac, an eclipsing RS CVn binary star, with the Chandra High Energy Grating Spectrometer for a total of 100 ks divided into six intervals covering both quadratures and eclipses. We repeated observations at each phase. At least two flares were seen, in which the flux increased by factors of two and four. The flares occurred near eclipse phases and compromised detection of eclipse modulation. The quadrature fluxes were the most stable, but they also show non-repeating trends. Quadrature line profiles are broadened relative to eclipse profiles, presumably due to orbital velocity Doppler shifted emission from each binary component. The spectrum appears to be iron poor and neon rich, similar to HR 1099, but not as extreme as II Pegasi. We will examine line strengths, widths, and positions vs. phase, and present preliminary differential emission measure models and abundance determinations using the APED emissivity database.
This work is supported by NASA contract NAS8-38249 (HETG) and SAO SV1-61010 (CXC) to MIT.
1. Introduction
RS CVn binaries were first noted for their sinusoidal optical light curve variability, interpreted as large scale analogs of sunspots (Hall, 1976). Subsequent studies showed them to have optical (hydrogen and calcium; Huenemoerder & Ramsey 1984) and ultraviolet (carbon, silicon, oxygen, nitrogen; Simon and Linsky 1980) emission lines also analogous to the Solar chromosphere and transition region. They were later found to be luminous in X-rays (Walter & Bowyer, 1981), extending the Solar analogy to the corona, but with 1000 times the activity level. Eclipsing systems like AR Lac permit us to study coronal phenomena for stars of known mass, size, and rotational velocity. Emission line spectroscopy provides temperature and density diagnostics, which together with geometrical constraints, can provide insights regarding sizes of magnetic loops. Eclipse and rotational modulation provide further information on the size and distribution of the emitting structures. Together in the context provided by other stars and long term trends, we hope to learn about the fundamental physical processes which heat stellar coronae.
We observed AR Lac with the Chandra High Energy Grating Spectrometer (HETGS) for 97 ks, divided into 6 separate observations which sampled eclipse and quadrature phases. The HETGS has a maximum spectral resolution () of about 1500, covering the range of 1.8 to 30 Å with two complementary gratings, the Medium, and the High Energy Gratings (MEG and HEG, respectively). Approximately 20 years prior to these Chandra observations, Walter, Gibson, and Basri (1983) mapped X-ray emission with the Einstein observatory, and found both extended and compact emission regions with an asymmetric distribution. Neff et al. (1989) mapped the chromosphere using ultraviolet lines. We now have high resolution spectra which resolve the emission into a multitude of emission lines from highly ionized elements.
2. Light Curve
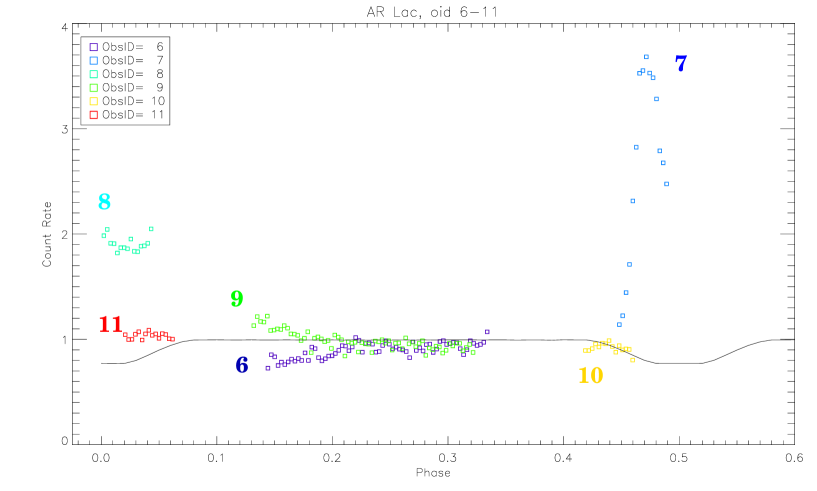
A light curve was made by binning diffracted photons in orders -3 to +3 (excluding 0) in both HEG and MEG arms. Figure 1 shows the count-rate against orbital phase, which is also rotational phase, since the system is tidally synchronized (the period of AR Lac is 1.98 days). ObsID 7 shows a strong flare, caught during the rise and part of the decay. ObsID 8 has a high rate, but is not obviously rising or falling. The light curve shows no primary eclipse, indicating that the G2 IV star (smaller component) is X-ray dark, at least on one hemisphere.
3. Doppler Shifts
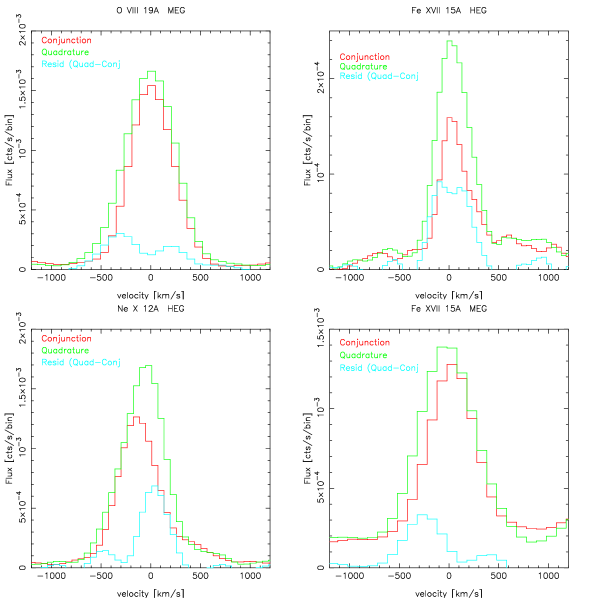
The orbital radial velocity amplitude of AR Lac is 230 km/s. Solar flares have been seen to have velocity fields of up to 400 km/s. In Figure 2, we compare line profiles for the quadrature times (ObsIDs 9 and 6) to profiles during times of conjunction, which also coincidentally have flares (ObsIDs 7,8,10, & 11). We have looked at lines near the highest instrumental resolution: O viii 19Å MEG, Ne x 12 Å HEG (blended w/ Fe xvii), and Fe xvii 15Å (HEG and MEG). It is clear that lines during quadrature are broader than during conjunction, which is expected if both components are X-ray bright. Future work will examine line centroids versus time versus order to better quantify the origin of the broadening and shifts.
4. Density Diagnostics
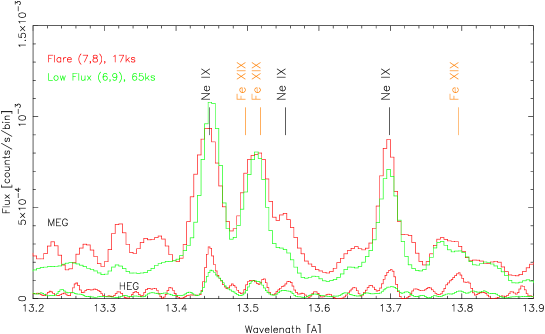
The helium-like triplet lines provide density diagnostics which are independent of relative abundance ratios and which are relatively independent of temperature. The Ne ix region is shown in Figure 3 for flare and low-flux intervals. The forbidden line (13.7 Å) to intercombination line (13.55 Å) ratio is density sensitive and decreases for densities above about (cgs). It appears likely that the ratio decreases during flares.
5. The Full Spectrum
We have derived a provisional differential differential emission measure model by measuring line fluxes in the total integrated spectrum, and then fitting to them a differential emission measure (DEM) with variable abundances. The model is considered as provisional because of the great variability of the light curve and because the system is composite. After an initial temperature distribution was derived, the DEM and abundances were scaled to give an approximate match to line-to-continuum ratios. The fit is not unique, and we will be fitting shorter, more stable intervals of the spectrum. At low temperatures, the fit is unconstrained because there are no lines from plasma cooler than about . The hot end is constrained by emission from high ionization stages of Fe and by the continuum. The provisional DEM is shown in Figure 4.
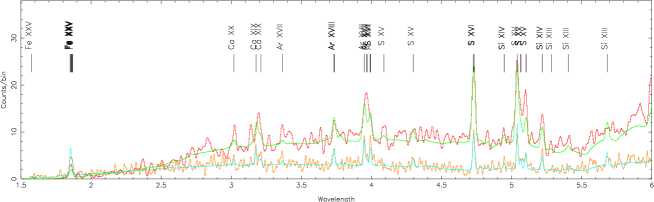
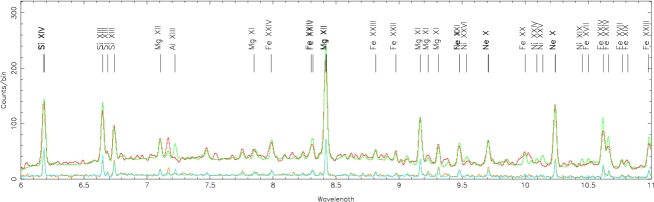
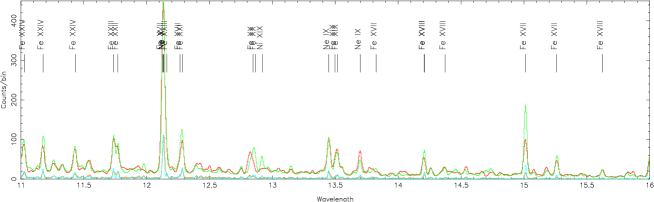
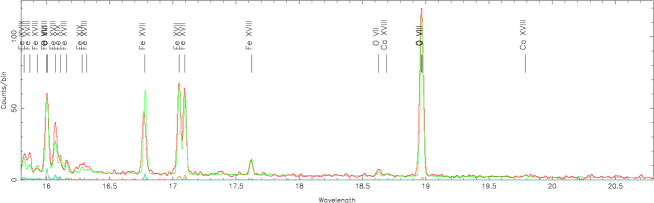
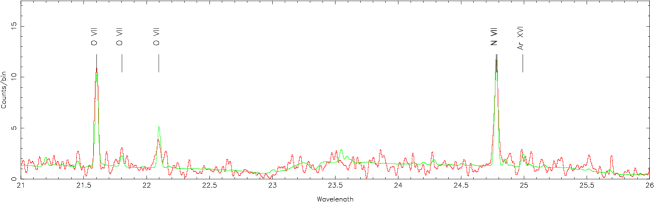
Counts spectra are extracted for the entire 97 ks observation (ObsIDs 6-11), which is shown in Figure 5. Plus and minus 1st orders were summed and smoothed by 0.008 Å (Medium Energy Grating, MEG) or 0.004 Å (High Energy Grating, HEG) for display. The marked lines are the brightest features for the adopted model. The model was binned from the APED (Astrophysical Plasma Emission Database; Smith et al 2001) and folded through the instrumental response.

6. Conclusions
The HETGS spectra show that the coronae of AR Lac are highly variable, present on both stellar components, and asymmetrically distributed. Ionic species detected indicate a broad range in plasma temperatures. Relative abundances are subject to further more detailed analysis, but preliminary results fairly reliably indicate that iron is depleted by about a factor of three relative to neon, based upon Ne ix and Fe xvii ratios, since these ions have similar emissivity functions with temperature. We also detected a possible density enhancement during the flare state.
Acknowledgments.
This work is supported by NASA contract NAS8-38249 (HETG) and SAO SV1-61010 (CXC) to MIT.
References
Hall, D.S. 1976, in “Multiple Periodic Variable Stars,” edited by W. S. Fitch (Dordrecht: Reidel), p 267.
Huenemoerder, D. P. & Ramsey, L. W. 1984, AJ, 89, 549.
Neff, J. E., Walter, F. M., Rodono, M., & Linsky, J. L. 1989, A&A, 215, 79.
Simon, T., and Linsky, J.L. 1980, ApJ, 241, 759.
Smith, R. K., Brickhouse, N. S., Liedahl, D. A., & Raymond, J. C. 2001, ApJ, 556, L91 .
Walter, F. M. & Bowyer, S. 1981, ApJ, 245, 671
Walter, F., Gibson, D., & Basri, G., 1983, ApJ, 267, 665.