The Dust Opacity of Star-Forming Galaxies
Abstract
Presence of dust in galaxies removes half or more of the stellar energy from the UV–optical budget of the Universe and has profound impact on our understanding of how galaxies evolve. Measures of opacity in local galaxies are reviewed together with widely used theoretical and empirical methods for quantifying its effects. Existing evidence shows that the dust content of nearby galaxies depends not only on their morphology, but also on their luminosity and activity level. A digression is devoted to starbursts in view of their potential relevance for measures of opacity in distant galaxies. Scarcity of coherent multiwavelength datasets hampers our ability to derive reliable obscuration estimates in intermediate and high redshift galaxies. This, in turn, limits the reliability of inferred physical quantities, such as star formation rates, stellar population ages, galaxy luminosity functions, and others.
1 Introduction
After IRAS (Soifer, Houck & Neugebauer, 1987) showed that most galaxies in the nearby Universe contain at least some dust, the main question moved from “whether” to “when, where, and how much”. “When” did galaxies started to be enriched in metals and dust and how did their dust content evolve as a function of redshift? “Where” is the dust located within a galaxy and how is it distributed among Hubble types? “How much” dust there is in galaxies, how much stellar light is absorbed by dust and how is it re-emitted?
More than one third of the bolometric luminosity of local galaxies is processed by dust into the infrared. The fraction of stellar radiation reprocessed into the IRAS 8–120 m window is 25%–30% (Soifer & Neugebauer, 1991); this implies an infrared energy fraction around 35%–40% of the total bolometric energy within the local 100 Mpc, once bolometric corrections from the IRAS window to the full infrared range are included (Désert, Boulanger & Puget, 1990; Xu & Buat, 1995; Calzetti et al., 2000). This average value comes with a large variation between galaxies, depending on luminosity, morphological type, and activity level (see section 3).
The cosmic infrared background (CIB) observed by COBE (Puget et al., 1996; Fixsen et al., 1998; Hauser et al., 1998) sets equally stringent limits on the total amount of stellar energy re-processed by dust into the infrared at all redshifts. About half, and possibly more, of the background radiation between 0.1 m and 1000 m is emerging at wavelengths 40 m (Hauser & Dwek, 2001). This implies that at some epoch(s) in the past galaxies have been infrared–luminous at least as much as, and possibly more than, today to produce the observed balance between UV/optical and infrared energy in the cosmic background. Infrared–bright sources are also found to be about two orders of magnitude more numerous in the past than today (section 5.2 and Barger, Cowie & Richards, 2000). The infrared luminosity of a galaxy is related to both its dust content and nuclear/star-formation activity. The lower metal content of distant galaxies does not necessarily make them more transparent systems than galaxies today. The dust content of galaxies is, in fact, proportional to both metallicity and gas content; as stellar populations evolve in time and more gas is locked into stars, the metallicity of a galaxy increases while its gas content decreases. The two trends are opposite to each other, and the dust content reaches a peak sometimes during the evolution of the galaxy. Models predict that galaxies at z1–2 have about twice the dust opacity of local galaxies (Wang, 1991; Edmunds & Phillips, 1997; Calzetti & Heckman, 1999; Pei, Fall & Hauser, 1999). High-redshift, star-forming galaxies are indirectly observed to have large gas column densities; the average SFR per unit galactic area increases by more than an order of magnitude between redshift 0 and 3 (Giavalisco et al., 1996a; Meurer et al., 1997; Lanzetta et al., 1999), which is indication of a similar increase in the average gas column density via the global Schmidt law (Kennicutt, 1998).
The presence of dust in galaxies limits our ability to interpret the local and distant Universe, because dust extinction dims and redden the galaxy light in the traditional UV–to–near-IR windows, where the vast majority of the data have been obtained. Dust effects hamper the interpretation of galaxies SEDs in terms of their fundamental parameters, such as age, stellar population mix, star formation rates (SFRs), and stellar Initial Mass Function (IMF). Since young stellar populations are on average more deeply embedded in dust clouds than older stars, dust opacity variations within a galaxy impact the derivation of a galaxy’s star formation history, by altering the census of the populations in the different age bins. Heavy dust extinction in nearby starburst galaxies still prevents establishing whether the stellar IMF in these systems is different from that of more quiescent environments (Rieke et al., 1980, 1993; Alonso-Herrero et al., 2001). The increase of dust content with luminosity in spirals may be responsible for the non-linear behavior of the Tully-Fisher relation, and this translates into biased distance estimates (Giovanelli et al., 1995). Determinations of luminosity functions, mass-to-light ratios, and number counts, especially at short wavelengths, suffer from both the presence of dust and the variations of dust content from galaxy to galaxy. Light dimming by dust biases measurements of galaxies’ SFRs, both locally (Bell & Kennicutt, 2001; Sullivan et al., 2000) and at high redshift (Glazebrook et al., 1999; Madau et al., 1996; Steidel et al., 1999), and is the cause of uncertain cross-calibrations between different indicators. The evolution with redshift of the SFR of galaxies per unit comoving volume is still debated: unclear is whether it has a peak around z1–3 (Madau et al., 1996; Blain et al., 1999b) or is mostly flat between z1 and z4 (Steidel et al., 1999; Barger, Cowie & Richards, 2000). Answering this question, which requires understanding the dust opacity characteristics and the nature of high redshift galaxies, can discriminate between different flavors of galaxy formation scenarios (White & Frenk, 1991; Ortolani et al., 1995; Baugh et al., 1998). Finally, measuring the fraction of metals locked into dust at different epochs is a crucial ingredient for tracing the chemical evolution of galaxies.
The quantification of the dust opacity of galaxies of all types and at all redshifts as a function of wavelength has required the collective effort of many investigators over the last 10–15 years and is still, in many aspects, an on-going process. This review attempts to capture the main results obtained so far; it concentrates on star-forming galaxies, because of their key role for intepreting the star formation history and evolution of galaxies. The topic has acquired with time large breadth and numerous publications have appeared in the field; despite the effort to include as many relevant results as possible, some important contributions may have been inadvertenly overlooked.
After IRAS, the Infrared Space Observatory (ISO) continued to shed light on the dust emission properties of galaxies, and comprehensive reviews are given in Genzel & Cesarsky (2000) and in the Proceedings of the 1998 Paris conference ‘The Universe as Seen by ISO’ (Cox & Kessler, 1999). The status of the topic before ISO is reported in the Proceedings of the 1994 Cardiff (U.K.) conference ‘The Opacity of Spiral Disks’ (Davies & Burstein, 1995) and of the 1996 Johannesburg (South Africa) conference ‘New Extragalactic Perspectives in the New South Africa’ (Block & Greenberg, 1996).
Throughout the following, the adopted cosmology is a flat Universe with =0 and Hubble constant Ho=65 km s-1 Mpc-1. ‘Local Universe’ refers to a sphere of 100–200 Mpc radius centered on the Milky Way.
2 The Radiative Transfer of Dust in Galaxies
The transfer of radiation through dust is governed by the well-known equation (e.g., Chandrasekhar, 1960; Sobolev, 1963):
| (1) |
where Iλ(s, ) is the radiation intensity, ds is the element of linear distance along the direction of propagation, is the element of solid angle as seen by the dust grain, is the opacity (absorption plus scattering) of the dust per unit separation s, is the emissivity of the sources along the direction of propagation, is the albedo, i.e. the fraction of the opacity due to scattering, and is the phase function of the dust grains expressed as a function of , the angle between the directions determined by the incident radiation () and the scattered radiation (). One commonly used expression of the scattering phase function, the Henyey-Greenstein function (Henyey & Greenstein, 1941), is characterized by a single parameter, the asymmetry parameter =cos(), which is the average of the cosine of the scattering angle.
Determining the dust opacity and recovering the intrinsic physical properties of complex systems like galaxies typically requires the full treatment of the transfer of radiation through dust (equation 1). The efforts to solve the integro-differential equation 1 in the case of galactic environments have generated increasingly sophisticated radiative transfer models and codes to deal with the complexity of both the dust physical properties and the dust/emitter geometry. A representative, although non-exhaustive, list of models and their salient characteristics is given in Table 1. A detailed description and comparison between these models and codes is beyond the scope of the present review and the interested reader is referred to the papers listed in the Table. Although the simplifying assumptions implemented in many cases often appear to yield as good a solution as more complex treatments (see, for instance, Misiriotis et al., 2000), the large number of free parameters is a fundamental shortcoming of radiative transfer models. Workarounds to this shortcoming go from assembling large, coherent sets of independent observational data on just one or a small number of objects to making over-simplistic assumption on the age and metallicity mix of the galaxy stellar populations, and often both. This clearly bears deeply on the generality and applicability of any result and may account to an extent for the wide variety of conclusions on the opacity of galaxies reached by different authors.
2.1 Point Sources and the Interstellar Extinction
A point-like source (a star or an AGN) behind a screen of dust is the simplest source/dust geometry, and equation 1 has solution:
| (2) |
where I and I are the attenuated (observed) and intrinsic radiation intensity, and is the optical depth of the dust screen111see Appendix A for the distinction between A and Aλ that will be used later.. The total-to-selective extinction, i.e. the part of the optical depth which only depends on the physics of the dust grains and, therefore, only on the wavelength, is often expressed as k()=A/E(BV). The color excess E(BV) is defined as Ao(B)Ao(V), hence k(B)k(V)=1.
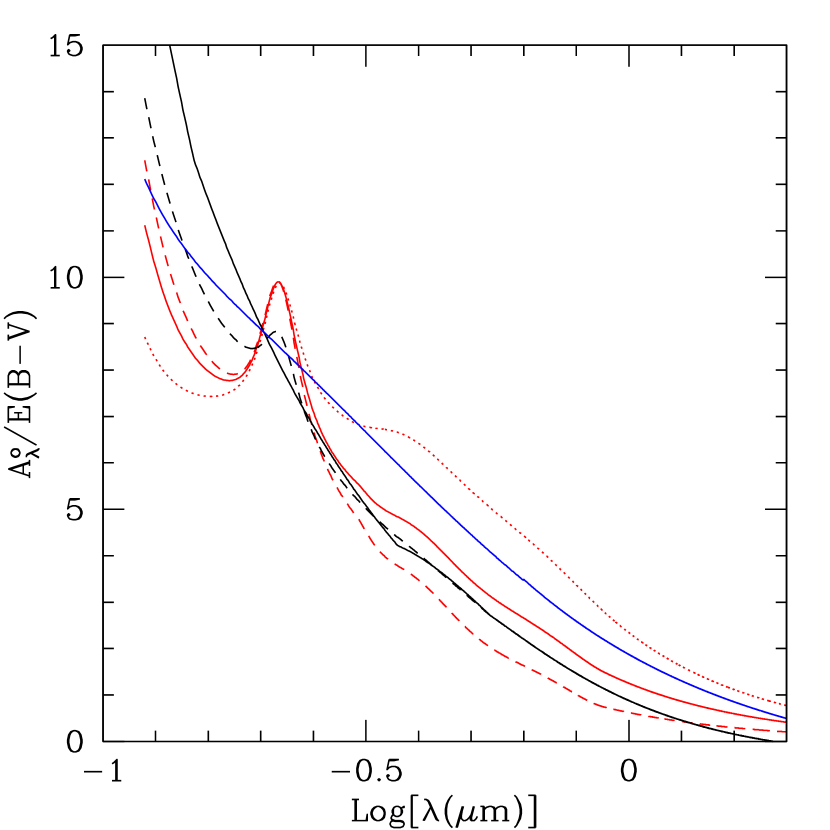
Although many studies traditionally employ a ‘mean Galactic extinction curve’ to correct galactic and extragalactic sources for the effects of dust obscuration, the well-studied Milky Way interstellar extinction has been shown to be spatially variable and highly dependent on the dust grain environment along the line of sight (see reviews of Mathis (1990) and Fitzpatrick (1999)). Cardelli, Clayton & Mathis (1989) demonstrated that the variations can be effectively parametrized by the total-to-selective extinction at V, R(V)=A/E(BV). Both the steepness of the far-UV (0.3 m) rise of the extinction curve and the strength of the 0.2175 m absorption feature decrease for increasing R(V), as schematically shown in Figure The Dust Opacity of Star-Forming Galaxies (Cardelli, Clayton & Mathis, 1989). Most sightlines have R(V)2–6, with the low values corresponding to the diffuse ISM (for which R(V)=3.1 is a reasonable average value, Rieke & Lebofsky (1985, e.g., )) and the high values pertaining to dense clouds. The large values of R(V) in dense clouds, usually accompanied by a gray extinction curve, are consistent with dust grains having systematically larger sizes than in the diffuse medium (Cardelli, Clayton & Mathis, 1989).
The only galaxies external to the Milky Way for which some measurements of the UV extinction curves exist are the Magellanic Clouds (Figure The Dust Opacity of Star-Forming Galaxies; Koornneef & Code, 1981; Nandy et al., 1981; Bouchet et al, 1985; Fitzpatrick, 1986; Gordon & Clayton, 1998; Misselt, Clayton & Gordon, 1999), although tentative measurements in M31 have been made (Bianchi et al., 1996). Despite the large variation of extinction properties found within each of the Magellanic Clouds (Fitzpatrick, 1986; Lequeux et al., 1982; Misselt, Clayton & Gordon, 1999, e.g., ), the average curves of the Clouds appear to have some intrinsic differences from the average Milky Way curve, including a smaller R(V) (R(V)2.4–2.9, Gordon & Clayton (1998); Misselt, Clayton & Gordon (1999)). This has been interpreted as an effect of the lower metallicity in the Clouds, which causes the molecular clouds to be more diffuse (Pak et al., 1998) and, possibly, to produce on average smaller dust grains (Misselt, Clayton & Gordon, 1999). The weak or absent UV absorption ‘bump’ at 0.2175 m in the extinction curves of the LMC 30 Doradus region and of the SMC bar, respectively, (Figure The Dust Opacity of Star-Forming Galaxies) could be related to local processes in these regions, possibly to the ongoing star formation activity (Fitzpatrick, 1986; Gordon & Clayton, 1998; Misselt, Clayton & Gordon, 1999; Reach et al., 2000). Although the bump carriers have not been positively identified yet (e.g., Reach et al., 2000), mid– and far–infrared studies of star forming regions in the Milky Way have provided evidence that the environmental UV energy density level affects the dust properties, such as the grain size distribution, via destruction or coagulation, and/or the dust physical characteristics, via ionization state changes (Boulanger et al., 1988; Cesarsky et al., 1996). Thus, the environmental UV energy density appears to play as important a role as the metallicity in shaping the extinction curve. If confirmed by further observations, this hypothesis may explain the general absence of a 0.2175 m absorption ‘bump’ in the extinction curve of starburst galaxies (section 4.1) and may partially account for its weakness in QSOs (e.g., Jura, 1977; Sprayberry & Foltz, 1992; Yamamoto & Vansevicius, 1999).
In addition to absorbing stellar light, dust manifests itself through emission and absorption features and continuum emission at 1 m. Features in the near/mid-IR include, among others, the silicate absorption at 9.7 and 18 m, H2O and CO2 ice absorption at 3.0 and 4.3 m (see Lutz et al. (1996) and Schutte et al. (1998) for a list of other absorption features), and the emission bands at 3.3, 6.2, 7.7, 8.6, and 11.3 m (Sellgren, 1994, 2000). The continuum emission beyond a few m and up to 40–70 m is considered to be mainly due to discrete photon heating of very small dust grains, the smallest among which are transiently heated up to 1,000 K (e.g., Sellgren, 1984; Draine & Anderson, 1985; Li & Draine, 2001); dust heated by massive stars to temperatures 70 K also contributes to the flux in the wavelength region below 50 m, albeit with decreasing filling factor for increasing temperature (Natta & Panagia, 1976). Beyond 40–70 m, the emission is mainly due to dust grains in nearly steady balance with the average heating by starlight; the transition wavelength between predominance of discrete photon heating versus that of nearly-steady state depends on the average color temperature of the dust and, thus, on the mean UV energy density level of the galaxy (Mezger, Mathis & Panagia, 1982; Mathis, Mezger & Panagia, 1983; Helou, 1986; Chini, Krügel & Kreysa, 1986; Lonsdale-Persson & Helou, 1987; Rowan-Robinson & Crawford, 1989; Désert, Boulanger & Puget, 1990).
The original dust model of bare graphite and silicate grains (Mathis, Rumpl & Nordsieck, 1977; Draine & Lee, 1984) has evolved over time by including more complex grain compositions and extended grain size distributions, to accomodate all the details of the absorption and emission, and the variability of the environment, while at the same time accounting for the constraints imposed by the heavy elements overall abundance (Mathis, 1996, e.g., ). Polycyclic aromatic hydrocarbons (Léger & Puget, 1984; Désert, Boulanger & Puget, 1990; Weingartner & Draine, 2000; Sellgren, 2000), hydrogenated amorphous carbons (Duley et al., 1989; Furton, Laiho & Witt, 1999), icy and organic refractory mantles (Greenberg, 1984; Tielens, 1989; Greenberg, 1989; Jenniskens, 1993; Greenberg et al., 2000), composite and/or porous grains (Mathis & Whiffen, 1989; Mathis, 1996; Wolff, Clayton & Gibson, 1998; Voshchinnikov & Mathis, 1999), as well as grain size distributions that significantly depart from the original power law model (Kim, Martin & Hendry, 1994; Weingartner & Draine, 2000), have all been suggested as possible alternatives/complements to the graphite/silicate model.
2.2 Extended Emitting Sources
In the late ’80s, Disney, Davies & Phillips (1989) and Valentijn (1990) revived the decade-long debate on whether galaxy disks are mainly transparent or opaque to dust. Using multi-wavelength information and surface brightness-versus-inclination tests, respectively, the two groups of authors reached the similar conclusion that the disks of galaxies are fairly opaque, with total face-on extinctions in the B band A1 mag222See Appendix A for the definition of Aλ,f.. These results countered earlier findings, also based on the surface brigthness-versus-inclination tests, that galaxy disks are mostly transparent with face-on extinctions at B less than 1 mag (Holmberg, 1958; de Vaucouleurs, 1959a).
The reason why similar approaches can produce very different results can be found in the complexity of the absolute and relative distribution of stars and dust inside galaxies. When there is a significant departure from the simplest geometry of a point source (a star) behind a homogeneous screen of dust, the dust distribution, rather than the optical depth of the dust layer, becomes the dominant factor in determining the obscuration suffered by the stellar radiation (Natta & Panagia, 1984; Witt, Thronson & Capuano, 1992; Calzetti, Kinney & Storchi-Bergmann, 1994). In particular, differential optical depth effects come into play. If, for instance, the stars are homogeneously mixed with the dust, the shorter the wavelength of the radiation the smaller the optical depth of the dust layer from which it can emerge; thus, an observer will detect blue light only from the closest outer ‘skin’ of the mixed distribution, while redder light will come from deeper layers. An extreme case is that of infinitely optically thick clumps in front of an extended light distribution: the stellar emission will come only from those lines of sight that do not intersect clumps, and the net result will be an unreddened, albeit dimmer than the original, spectral energy distribution (SED). The scattering component of the extinction curve will also modify the general characteristics of the dust obscuration, as light will be scattered into the line of sight as well as out of it. The net result of all these effects is a general blueing of the emerging SED relative to the foreground homogeneous dust screen case, or, in other words, an often much greyer ‘effective extinction’, even in the presence of large dust optical depths333See Appendix A for the relation between optical depth, extinction, and effective extinction. (Bruzual, Magris & Calvet, 1988; Witt, Thronson & Capuano, 1992).
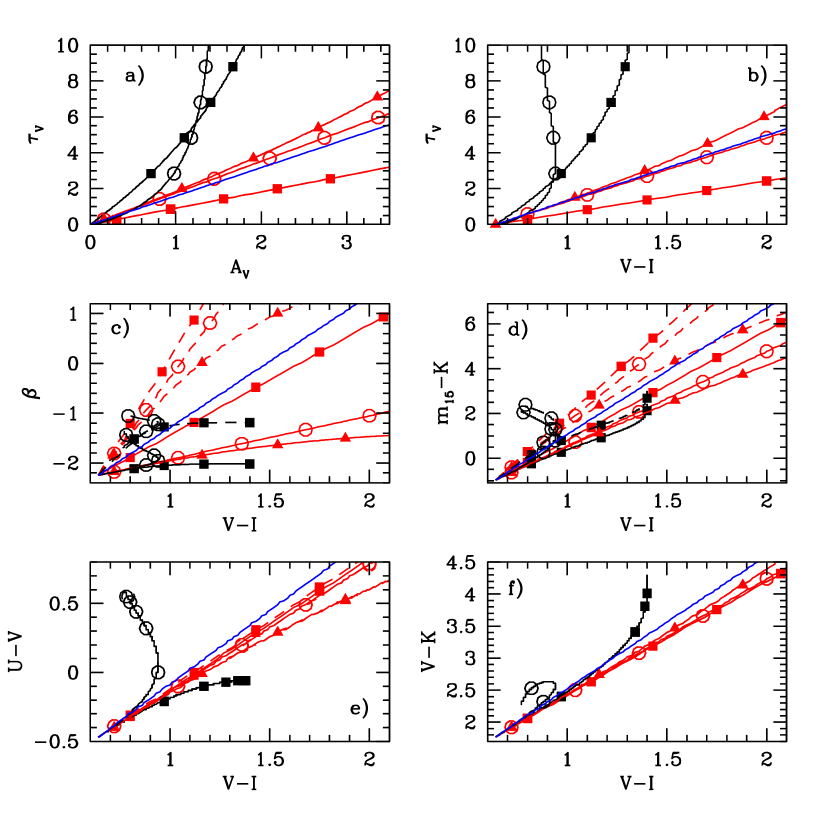
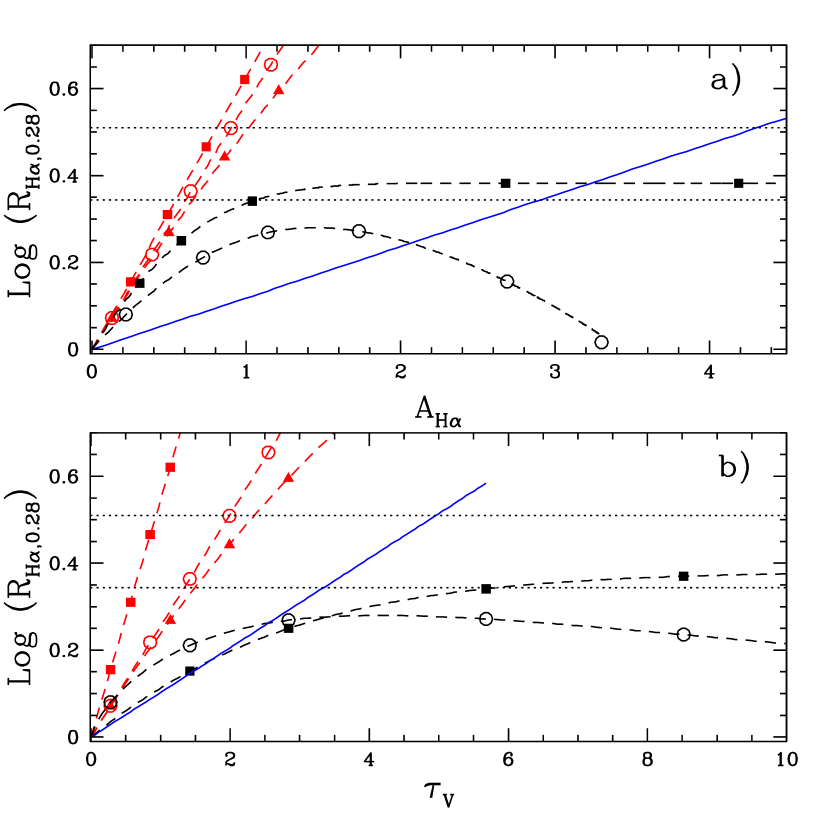
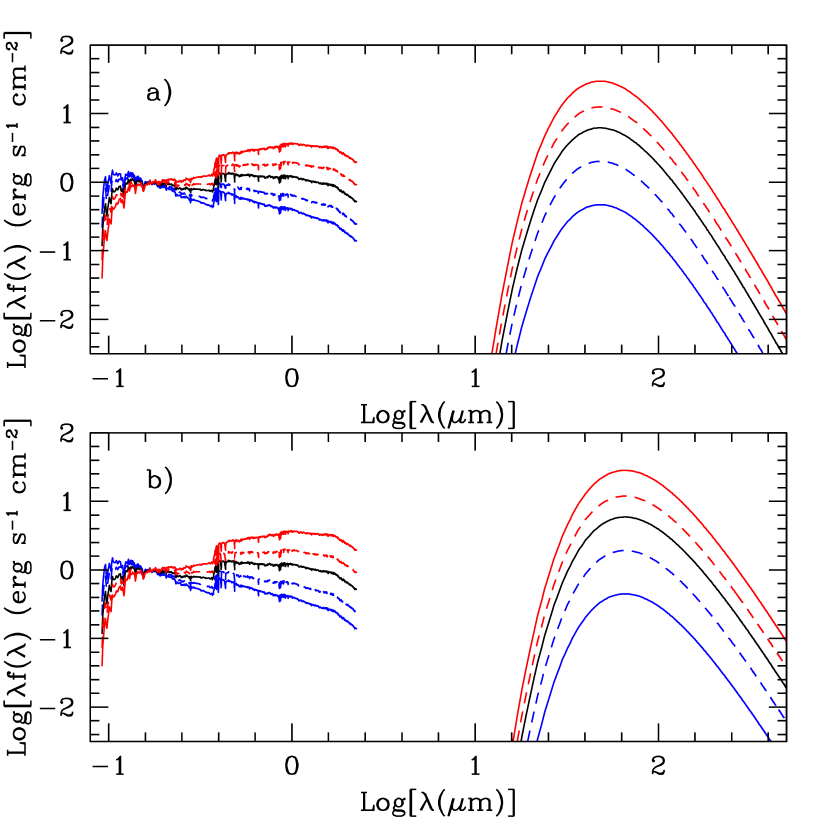
For illustrative purposes, Figures The Dust Opacity of Star-Forming Galaxies and The Dust Opacity of Star-Forming Galaxies show how photometric and spectroscopic quantities are affected by the dust geometry for five ‘toy models’. The models represent plane-parallel geometries of dust and stars (details are given in Natta & Panagia, 1984; Calzetti, Kinney & Storchi-Bergmann, 1994; Wang & Heckman, 1996) for: (1) the simple case of a homogeneous, non-scattering dust screen foreground to the light source; (2) a homogeneous, scattering dust screen foreground to the light source (e.g., a screen in close proximity of the source, so that scattering into the line of sight becomes an important effect); (3) a Poissonian distribution of clumps in front of the light source, with average number =10; (4) a homogeneous mixture of dust and emitters; (5) a homogeneous dust/emitter distribution averaged over all inclination angles, with the UV and ionized gas emission having the same scaleheight of the dust while the scaleheight of the optical light gradually increases to twice that of the dust at V and beyond. Models 2–5 include scattering in the calculations444For the models, the compilation of albedo and asymmetry parameter values of Witt & Gordon (2000) is used. In this compilation, the data are mainly from studies of reflection nebulae, and the 0.2175 m feature is due to pure absorption (no scattering) (Calzetti et al., 1995a). These and values are assumed here to be representative of dust properties, although the following caveats need to be kept in mind: some values, especially for the albedo, are still unsettled (Burgh, 2001); the generalization of the reflection nebulae results (R(V)3.1) to the diffuse dust is not immediate (Witt, Friedmann & Sasseen, 1997; Kim, Martin & Hendry, 1994; Weingartner & Draine, 2000); the UV and values could be lower in the Magellanic Clouds than in the Milky Way (Weingartner & Draine, 2000).. In all cases, the light source is assumed to be extended and to be represented by a 300 Myr old stellar population undergoing constant star formation, with solar metallicity and a Salpeter IMF in the mass range 0.1–100 M⊙ (Leitherer et al., 1999).
The ‘blueing’ effect of geometries more complex than a foreground dust screen is evident from the comparison of the five models. At fixed optical depth (fixed amount of dust), the reddening of the VI color of a stellar population induced by a generic geometry of stars and dust will be less, and the effective extinction AV lower, than that induced by a foreground screen (Figure The Dust Opacity of Star-Forming Galaxies, panels a and b). The same will be true for colors at other wavelengths (Figure The Dust Opacity of Star-Forming Galaxies), where, again, the foreground non-scattering screen will provide the maximum reddening. For mixtures of dust and stars (models 4 and 5), reddening of colors and effective extinction reach asymptotic values; beyond certain values of the optical depth, an increase in corresponds to small or negligible changes in colors and AV. This is due to the fact that the shortest wavelength emission is contributed only by the dust layers closest to the observer. One common consequence of the greyer ’effective extinction’ caused by complex dust/emitter geometries is that a limited number of diagnostics over a small wavelength range will lead to underestimates of the true galaxy opacity, especially if the actual dust geometry is not known and is ‘a priori’ assumed to be foreground (Witt, Thronson & Capuano, 1992).
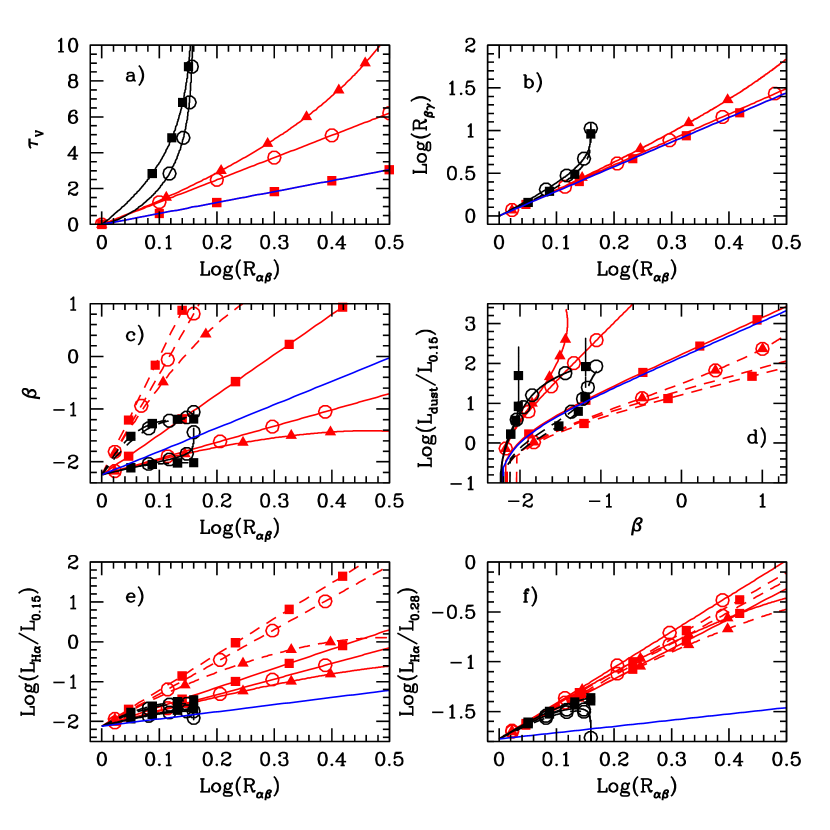
To aid the comparison with data on local starbursts and high-redshift star-foming galaxies (sections 4 and 5), the models shown in Figure The Dust Opacity of Star-Forming Galaxies are a function of the ratio of the attenuated-to-intrinsic Balmer line ratio:
| (3) |
and of the UV spectral slope555see Appendix B for the definition of . . The luminosity ratios of nebular hydrogen lines, like H, H, Pa, Br, etc., are rather insensitive to the details of the underlying stellar population and of the IMF, being affected at the 5%–10% level by variations of the gas physical conditions (e.g., Osterbrock, 1989); they represent, therefore, accurate probes of dust reddening and geometry. Table 2 lists the commonly used hydrogen emission line ratios, and the differential extinction between each pair. When multiple line ratios widely separated in wavelength are available, they can constrain the dust geometry in the sampled wavelength range. The two drawbacks of using nebular lines are: (1) they are produced by ionizing photons, therefore an ionizing stellar population needs to be present in the galaxy; and (2) they only probe the attenuation of the ionized gas, and such attenuation may or may not be directly related to that of the stellar population (section 4). The explicit expression of Rαβ depends on the dust geometry; in the simple case of a foreground, non-scattering screen:
| (4) |
where the values of k(H) and k(H are given in Table 2.
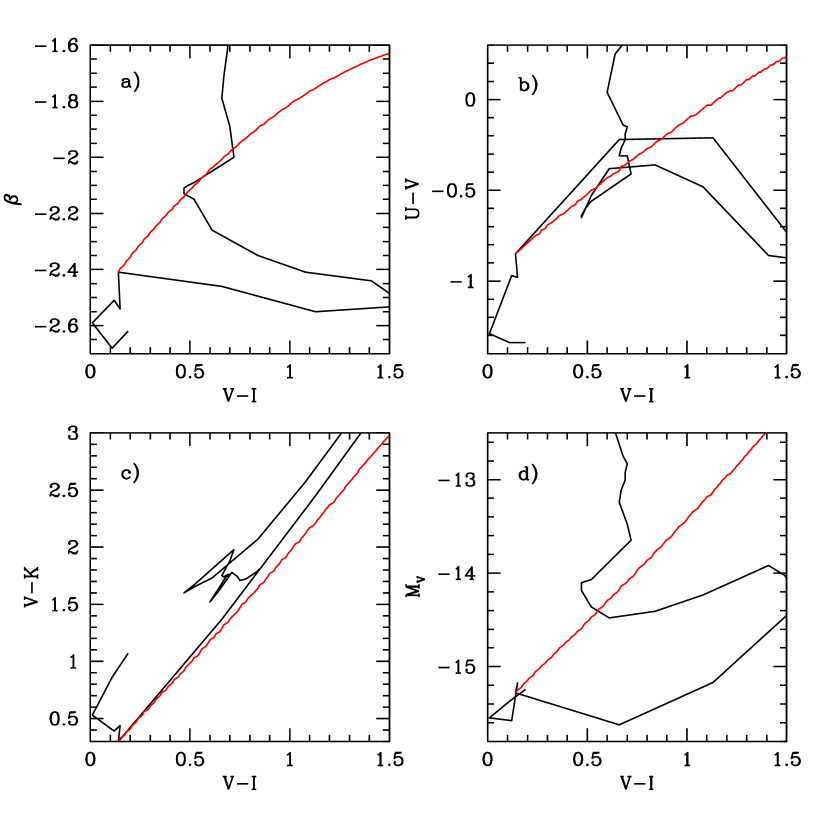
Degeneracies between the reddening induced by dust and that induced by variations in the age, metallicity, and IMF of the stellar populations play an non-negligible role in opacity determinations of galaxies. These effects are especially important when only broad band colors or low resolution spectroscopy are available, and age-sensitive or IMF-sensitive stellar features are not identifiable (e.g., discussion in Papovich, Dickinson, & Ferguson, 2001). For the age-dust degeneracy, an example is given in Figure The Dust Opacity of Star-Forming Galaxies; here, the broad band colors and magnitudes of a dust-free, ageing stellar population produced by an instantaneous burst of star formation are compared with the analogous quantities of an increasingly extincted 6 Myr old stellar population. A clumpy dust distribution with 2 in front of the young population reddens and attenuates it enough that its broad-band UV, optical, and near-IR colors closely resemble those of a 20 Myr old, dust-free population (corresponding to the color VI0.6 in Figure The Dust Opacity of Star-Forming Galaxies). Thus, the dusty, young population can be mistaken for a dust-free population a factor 3 older. This example is just one out of a large range of possibilities in the multi-dimensional dust/age/IMF/metallicity parameter space.
In summary, the grey effective extinction produced by dust geometry and scattering, the age-IMF-metallicity-dust degeneracy, together with uncertainties on the appropriate extinction curve to be applied to different galaxies (section 2.1) and the absence of strong emission and absorption features below 1 m (apart from the 0.22 Å absorption bump which is not universal), all contribute to make dust obscuration measurements very difficult in galaxies.
3 Measurements of Dust Opacity in Local Galaxies
3.1 Spiral Disks
Efforts to determine the dust opacity of local galaxies have spawned the development of a number of independent techniques that have been applied to a large array of samples. The most widely used methods in the case of galaxy disks are tests of the dependence of the surface brightness on inclination, multi-wavelength comparisons, and statistical analysis of the color and number count variations induced by a foreground galaxy onto background sources. Each method has its strengths and weaknesses, as briefly detailed below.
As Burstein, Haynes & Faber (1991), Choloniewski (1991),and Davies et al. (1993) pointed out, probing galaxy dust opacity by measuring the surface brightness dependence of galaxy disks on inclination can suffer from drastic selection biases. For increasing inclination, an apparent-magnitude-limited catalog will mimick the condition for transparent galaxies, with mildly increasing surface brightnesses, increasing diameters, and constant total luminosities. Conversely, an apparent-diameter-limited catalog will mimick the conditions for opaque disks, with roughly constant surface brightnesses, increasing magnitudes and constant diameters as a function of increasing inclination (Burstein, Haynes & Faber, 1991). Selection effects can, however, be controlled by combining different samples and by using galaxy redshifts/distances to discriminate among the different biases, and analysis of large samples of late-type (mainly Sbc and Sc) spirals (Huizinga & van Albada, 1992; Peletier & Willner, 1992; Giovanelli et al., 1994, 1995; Jones, Davies & Trewhella, 1996; Moriondo, Giovanelli & Haynes, 1998) has shown that the central regions of disk galaxies are opaque while the external regions beyond 2–3 scale lengths are almost completely transparent; there is also a trend for luminous galaxies to be more opaque than less luminous galaxies (Giovanelli et al., 1995). In bright, M21 disk galaxies, the observed magnitude correction from edge-on to face-on, m1 mag, corresponds to a face-on central optical depth666The face-on central optical depth is the optical depth of the dust at the geometrical center of the tri-dimensional dust distribution for a face-on disk galaxy. (0)5; this implies effective face-on extinctions A0.4–0.5 mag, A0.2 mag, and A0.1 mag (Peletier & Willner, 1992), for a double exponential distribution of dust and stars, and for practically transparent external galaxy regions (Byun, Freeman & Kylafis, 1994). Less luminous galaxies are progressively less opaque in their central regions, with a edge-on to face-on correction of m0.5 mag at M18, corresponding to effective face-on extinctions A0.1 mag (Giovanelli et al., 1995).
Qualitative results similar to those above have been obtained by Bosma et al. (1992) and Byun (1993) for a small number of edge-on late-type spirals using multi-wavelength kinematic information. The method, proposed by Goad & Roberts (1981), consists of comparing rotation curves of an edge-on galaxy at widely different wavelengths. If the edge-on galaxy is optically thick at a given wavelength, say, H, the rotation curve measured at this wavelength shows apparent solid body rotation throughout the entire disk, because the H emission is coming only from the external regions of the galaxy. A comparison with a mostly unextincted rotation curve measured at a longer wavelength, such as HI, can then establish whether optical thickness at H exists. This method, though fairly direct in principle, may suffer from two limitations: first, dust in galaxies tends to be patchy and the H emission may be detected along the least extincted sight lines even in the presence of considerable opacity; second, the method implicitly assumes that H-emitting regions are uniformly distributed across the disk.
The multi-wavelength comparison method provides an independent approach to the problem of determining the dust opacity of galaxies. In broad terms, the technique consists of using multiwavelength data to solve simultaneously for the intrinsic colors of the stellar populations and for the reddening/attenuation induced by the dust. Generally, broad band images covering as large as possible wavelength baseline, often from B to K band, are used to determine the opacity of the disks, by exploiting the differential extinction property of dust (Rix & Rieke, 1993; Block et al., 1994; Peletier et al., 1995; Emsellem, 1995; Beckman et al., 1996; Kuchinski et al., 1998; Xilouris et al., 1999). Indeed, in face-on quiescent galaxies K-band emission appears negligibly affected by dust obscuration, with 10% of the light lost to dust absorption and scattering (Rix & Rieke, 1993). The multiwavelength technique is the most widely adopted for measuring dust opacity in galaxies, because it employes easily accessible information on diverse galaxy types, and enables detailed modelling of optical depths as a function of galactic region. There are, however, three main weaknesses to the method: first, this technique needs as wide a wavelength coverage as possible, often difficult to obtain, to yield unambiguous results; second, if the dust optical depth exceeds unity at some wavelength, different volumes of the galaxy will be sampled at different wavelengths; third, the need for large datasets and detailed modelling makes obtaining results on large samples relatively cumbersome. Results vary from author to author, due to the different sample selections, galaxy and dust distribution models, and measurement techniques applied. Optical and near-IR image analysis gives typical central optical depths (0) in the range 0.3–2.5 for types Sab-Sc (Peletier et al., 1995; Kuchinski et al., 1998; Xilouris et al., 1999), although higher values have been obtained by Block et al. (1994). For exponential stellar and dust profiles, these values of (0) result in optical depths 1 averaged over the inner 2–3 scale-lengths (Rix & Rieke, 1993; Beckman et al., 1996; Kuchinski et al., 1998), and A0.3–0.4 mag and A0.15 mag over the same area. Much lower values of the optical depth are found for late-type, low surface brightness galaxies, with face-on, central values (0)0.15 (Matthews & Wood, 2001). In galaxy disks, arm regions tend to be opaque, with 1.4–5.5 (A0.2–0.7 mag) and peak values at 10–12, while interarm regions are generally transparent, with 0.3–1.1 (A0.05–0.15 mag, Elmegreen (1980); Rix & Rieke (1993); Beckman et al. (1996), but see the higher interarm extinction values found by Trewhella (1998)).
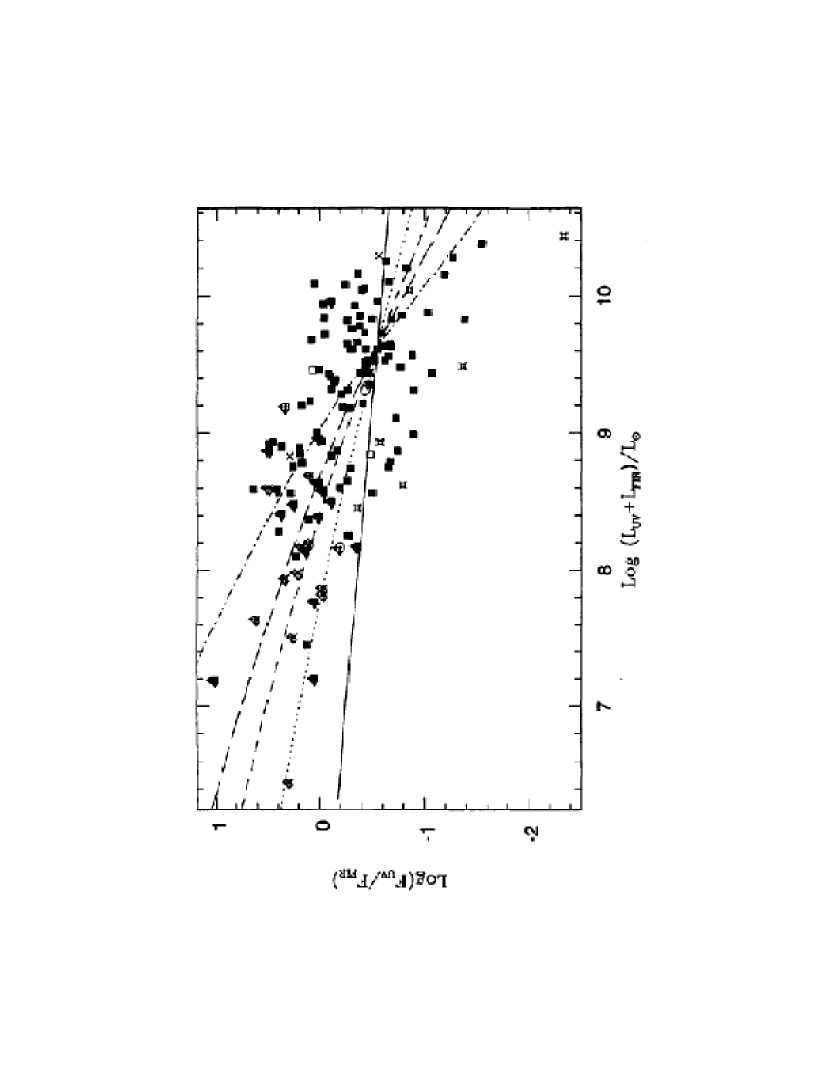
Energy balance estimates between dust absorption and emission can also be classified as a ‘multiwavelength technique’, but it is conceptually different from the one above. This technique employes direct measurements of the dust emission in the infrared to derive an estimate of the total stellar energy absorbed by dust, and then derive opacities at shorter wavelengths; whenever possible, the wavelength baseline is extended to the UV to probe the direct light from massive stellar populations and constrain bolometric quantities (Xu & Buat, 1995; Xu & Helou, 1996; Buat & Xu, 1996; Wang & Heckman, 1996; Trewhella et al., 1997; Trewhella, 1998). By combining UV and infrared (IRAS) data, Xu & Buat (1995), Wang & Heckman (1996), and Buat & Xu (1996) find typically lower values than those derived from optical/near-IR images. This is not incompatible with those results, since Xu & Buat (1995) and Wang & Heckman (1996)’s models assume plane-parallel dust and stars, instead of exponential profiles, and thus the opaque inner regions are averaged with the nearly transparent outer regions (Peletier et al., 1995; Kuchinski et al., 1998). Still, the UV selection of the samples may bias the conclusions towards lower optical depths and the use of IRAS data leaves some uncertainty as to the bolometric correction of the dust emission. The use of ISO data, that extend the infrared wavelength coverage out to 200 m, appear indeed to favor higher values of the effective extinction (Trewhella, 1998). Wang & Heckman (1996) find that opacity in disk galaxies is a function of luminosity (Figure The Dust Opacity of Star-Forming Galaxies), in agreeement with Giovanelli et al. (1995). These authors parametrize the opacity as: =, with =0.6 and LV,∗ the visible luminosity of a L∗ galaxy in the local Universe. Similarly, Buat & Xu (1996) note that Sb–Scd galaxies have 0.8 and are on average 1.5 times more opaque than Sa–Sab, and 3 times more opaque than Sd–Irr galaxies, with effective face-on extinctions A0.3 mag, A0.15 mag, and A0.1 mag for Sb–Scd, Sa–Sab, and Sd-Irr, respectively.
All methods described so far use the stellar radiation of the galaxy itself as light source for the dust, with the complication that intrinsic colors, age and metallicity gradients of the stellar populations and the relative distributions of dust and stars need to be disentangled from the extinction proper. A technique that overcomes these problems is the one that uses background sources as ‘light bulbs’ for the dust in foreground galaxies. In this case, the dust opacity is measured across the full thickness of the foreground galaxy. There are basically two approaches to the technique. In the first approach the foreground galaxy is partially projected onto a nearby background galaxy (Keel, 1983; White & Keel, 1992; White, Keel & Conselice, 2000; Keel & White, 2001a, b; Berlind et al., 1997; Pizagno & Rix, 1998). In general, the background galaxy needs to present a smooth light profile, thus early types and preferably ellipticals are required (see, however, Keel & White, 2001b); the dimming and color changes induced by the foreground galaxy dust onto the isophotes of the background source provides a measurement of dust opacity. The drawbacks of this approach are twofold: (1) there are very few known pairs of galaxies that fullfil all the requirements and (2) the method is limited by the degree of symmetry of both galaxies (White, Keel & Conselice, 2000). The second approach uses distant galaxies as background light sources. Statistical variations in number counts and colors of the background galaxies relative to control fields provide a handle on the total dust optical depth of the foreground galaxy (González et al., 1998). This method overcomes most of the limitations of the first one, but it presents some of its own: (1) high angular resolution images (e.g., from HST) are needed in order to identify background galaxies; (2) even with such images it is often difficult to discriminate background sources from extended regions within the foreground galaxy (e.g., HII regions), especially in crowded areas. Because of these limitations, the second method may also tend to avoid crowded and/or heavily extincted areas, thus biasing the results towards less dusty galactic regions. Results from various authors indicate that the spiral arms of galaxies tend to be opaque with A0.5–2 mag and A0.3–1.5 mag at any radius, while the opacity of interarm regions decreases with increasing distance from the galaxy center, starting at A0.7 mag within 0.3 R25 and decreasing to practically zero at R25 (González et al., 1998; White, Keel & Conselice, 2000; Keel & White, 2001b). The dust masses inferred from these extinction measures agree within a factor 2 with masses derived from the infrared/submm (ISO and SCUBA) dust emission (Domingue et al., 1999). One common trend generally found is the greyer-than-Galactic reddening in the arm regions (see, however, Keel & White, 2001b). The clumpiness of the dust within each resolution bin has been suggested to be responsible for the grey reddening (Berlind et al., 1997; González et al., 1998; White, Keel & Conselice, 2000; Keel & White, 2001a). Less agreement exists on the shape of the reddening curve in the interarm regions, due to the larger uncertainties resulting from the lower extinction values. The measured extinctions are front-to-back, i.e. represent the optical depth of the intervening dust between the observer and the background sources. To relate these numbers to those derived from the inclination and multi-wavelength tests, one has to make assumptions as to the distribution of stars relative to the dust in the foreground galaxy; for a mixed geometry of stars and small dusty clumps, the measured optical depths correspond to effective I extinctions of A0.3–0.4 mag and A0.2 mag for the arms and the interarm regions, respectively.
3.2 Beyond the Optical Disks
Multi-wavelength optical and near-IR imaging of edge-on or nearly edge-on systems indicate that the scalelength of the dust is about 40% larger than the scalelength of the stars (Xilouris et al., 1999), while the dust/stars scaleheight ratio is in the range 0.25–0.75, with a mean value of 0.5, (Kylafis & Bahcall, 1987; Xilouris et al., 1997, 1999) for late-type spirals (Sb and later) and appears to have ratio 1 in early-type spirals (Wainscoat, Hyland & Freeman, 1990). IRAS 100 m (Nelson, Zaritsky & Cutri, 1998) and ISO long wavelength maps (Alton et al., 1998; Davies et al., 1999; Trewhella et al., 2000; Radovich, Kahanpää & Lemke, 2001) confirm that cold dust emission extends beyond the limits of the optical disks along the radial direction, with scales that are 40% larger than those of the B-band emitting stars, but still well within the HI disks (e.g., Martin, 1998). Using statistical measurements of color variations between background galaxies and control fields, Zaritsky (1994) give a 2 detection of A0.04 in galaxy haloes, at a distance of about 60 kpc from the galaxy centers, along the optical major axis.
3.3 Irregular Galaxies
Spiral and irregular galaxies follow a global metallicity-luminosity (and metallicity-mass) relation, where the oxygen abundance increases by a factor 100 for an increase of 104 in absolute blue luminosity (Skillman, Kennicutt & Hodge, 1989; Zaritsky, Kennicutt & Huchra, 1994). Irregulars occupy the low metallicity locus of the relation, with 10 times on average lower oxygen abundance than spirals. Since the HI masses per unit LB in irregulars are a factor 3 larger than in spirals (Roberts & Haynes, 1994; Zaritsky, Kennicutt & Huchra, 1994), the mass in interstellar metals per unit LB is 3 times smaller. Adding the H2 gas into the balance does not change this conclusion, since the H2/HI mass ratio in irregulars appear to be no larger than that in spirals, even accounting for the uncertainties in the CO-to-H2 conversion factor (Verter & Hodge, 1995; Arimoto, Sofue & Tsojimoto, 1996; Wilson, Walker & Thornley, 1997). Measurements give the H2 mass as 25%–50% of the HI mass in late spirals and as 20% of the HI mass in irregulars (Young & Scoville, 1991; Hunter & Sage, 1993; Hunter & Thronson, 1996; Hunter, 1997; Meier et al., 2001). Smaller metal masses for the irregulars translate into smaller dust masses per unit LB, for standard values of the metal-to-dust ratio (van den Bergh, 1974; Lequeux et al., 1984), and into the expectation that irregular galaxies are at least 3 times more transparent at B than spiral galaxies, for similar dust/star geometries.
The analysis of the blue, H, and IRAS-detected infrared emission confirms that irregular galaxies are relatively transparent systems (Hunter et al., 1986, 1989). In a study of the Magellanic Clouds using background galaxies, Dutra et al. (2001) find that the central regions have A0.25 in the LMC and A0.16 in the SMC. In their UV selected samples, Wang & Heckman (1996) find that a 0.1 L∗ galaxy has a mean optical depth about 1/3 of the optical depth of an L∗ galaxy, and Buat & Xu (1996) reach a similar conclusion by comparing Sb-Scd galaxies with Sd-Irr. Thus, if the typical face-on effective extinction for an Sc galaxy is A0.4–0.5 mag, the analogous quantities for an irregular are A0.15 and A0.05–0.10.
3.4 Early Hubble Types
Although early Hubble type galaxies (ellipticals and S0s) do not generally fall under the category of ‘star-forming’ galaxies, they occupy a niche in terms of dust opacity properties that is at the same time opposite and complementary to that of other galaxies. Ellipticals and S0s are at the opposite end of the Hubble classification relative to Irregulars, but they appear to be no more opaque than those late systems.
Early type galaxies cover a metallicity range similar to that of late type spirals (Brodie & Huchra, 1991; Zaritsky, Kennicutt & Huchra, 1994), but have total (HIH2) gas fractions per unit optical luminosity that are 3 times or more smaller (Young & Scoville, 1991; Roberts & Haynes, 1994). Thus, for standard interstellar metal-to-dust ratios, early type galaxies are expected to be more transparent than disk galaxies.
The IRAS survey has shown that between 10% and 50% of all nearby early type systems (45% of ellipticals and 68% of S0s) contain dust (Jura et al., 1987; Knapp et al., 1989; Bregman et al., 1998), although the involved masses are generally modest, typically in the range 105–106 M⊙ or Mdust/L10-5–10-4 M⊙ L (Roberts et al., 1991; Goudfrooij & de Jong, 1995; Wise & Silva, 1996; Bregman et al., 1998). The exact fraction of dusty systems appears to depend upon the adopted detection threshold (Bregman et al., 1998), but it is likely a lower bound to the actual value, given the limits in the IRAS sensitivity. The 50% figure seems in agreement with the results of optical surveys: at least 40% of the local ellipticals and S0s show presence of disks, lanes and/or patchy distributions of dust in visual images (Ebneter & Balick, 1985; Sadler & Gerhard, 1985; Ebneter, Djorgovski & Davis, 1988; Goudfrooij et al., 1994). About 40–50%, and possibly as many as 80%, of ellipticals also show evidence for circumnuclear dust on scales 100 pc, as seen in HST images; the small-scale dust is mostly associated with nuclear radio activity (van Dokkum & Franx, 1995; Lauer et al., 1995; Forbes, Franx, & Illingworth, 1997; Carollo et al., 1997; Tran et al., 2001).
Despite the abundance of evidence for dust, optical extinction determinations of dust features in ellipticals generally account for only 1/10 to 1/5 of the dust mass measured from the infrared (IRAS) emission; the remaining 80%–90% of the dust mass is probably associated with a component smoothly distributed across the galaxy, and thus difficult to detect with standard techniques (Goudfrooij & de Jong, 1995; Wise & Silva, 1996; Bregman et al., 1998; Merluzzi, 1998). Limited data from ISO in the wavelength range 120–200 m confirm these findings (Haas, 1998). Using the elliptical galaxy model of Witt, Thronson & Capuano (1992), Goudfrooij & de Jong (1995) determine that the observed infrared luminosities are compatible with central optical depths of the diffuse component (0)0.7, with a typical value (0)0.2–0.3 (see, however, the somewhat larger values predicted by the models of Wise & Silva (1996)). The corresponding effective extinction is A0.05–0.10 mag and A0.02–0.04 mag.
The giant ellipticals found at the centers of cooling flow clusters are often surrounded by extended, 10–100 kpc, filamentary, and dusty emission-line nebulae, with a higher frequency in those clusters with cooling times shorter than a Hubble time (Heckman et al., 1989; Sparks, Macchetto & Golombek, 1989; Hu, 1992; Voit & Donahue, 1997; Donahue et al., 2000). Dust lanes in the central galaxies have, indeed, been directly observed (Pinkney et al., 1996). Optical and UV emission line studies give extinction values in the range A0.3–2 mag for the dust associated with the nebula (Sparks, Macchetto & Golombek, 1989; Hu, 1992; Allen, 1995; Voit & Donahue, 1997; Donahue et al., 2000); infrared and sub–mm measurements give dust masses of the order of 107–108 M⊙, or Mdust/L10-4–10-3 M⊙ L, for these systems (Cox, Bregman & Schombert, 1995; Edge et al., 1999). The existing controversy on the origin of the dust associated with the central galaxies of cooling flow clusters will be briefly reviewed in section 6. Such galaxies are, however, not a statistically significant component of ellipticals in general, thus their contribution to the dust mass budget of early type galaxies is small.
3.5 Infrared-Bright Galaxies
The galaxies discussed so far tend to be mostly ‘quiescent’, i.e. their bolometric output is not dominated by a single region of active star formation or by nuclear non-thermal activity, and have modest infrared outputs. Their infrared luminosities in the 3–1000 m band are typically 109 L⊙ and less than 4–61010 L⊙, with infrared-to-blue luminosity ratios LIR/L0.4–0.5 (de Jong et al., 1984; Soifer, Houck & Neugebauer, 1987; Devereux & Young, 1991; Soifer & Neugebauer, 1991; Hunter & Thronson, 1996), and 1/2 or less of the stellar bolometric luminosity converted into infrared emission via dust reprocessing777The total infrared output LIR of the dust emission is derived from the infrared luminosity measured in the 8–120 m or 40–120 m IRAS window (Helou et al., 1988; Sanders & Mirabel, 1996) multiplied by 1.4 or 2.2, respectively, to account for bolometric correction factors as modeled by Dale et al. (2001) from ISO data. The blue luminosity is L(0.44 m). (see Table 3).
Galaxies with L61010 L⊙ and LIR/L1 are progressively associated with dustier and more active systems for increasing values of the infrared luminosity (Rieke & Lebofsky, 1986). The brightest infrared sources are not necessarily associated with the most massive galaxies, despite the existence of a relation between a galaxy luminosity (mass) and its dust content (Wang & Heckman, 1996). Infrared luminosity is a combination of dust content and activity: brighter sources have larger amounts of star formation and/or non-thermal activity embedded in dust. Most of the luminosity from galaxies with LL1011 L3–4 L∗ appears associated with sources heavily obscured by dust (Sanders & Mirabel, 1996). At the bright end of the infrared luminosity function (Soifer, Houck & Neugebauer, 1987; Soifer & Neugebauer, 1991; Kim & Sanders, 1998) are the Ultraluminous Infrared Galaxies (ULIRGs) with luminosities from L1012 L⊙ up to 81012 L⊙ (Soifer, Houck & Neugebauer, 1987; Kim & Sanders, 1998), infrared-to-blue ratios around 30–400 (Sanders & Mirabel, 1996; Clements et al., 1996), and optical extinctions in excess of 10–40 magnitudes (Genzel et al., 1998; Murphy et al., 2001). These sources show a continumm of properties as a function of increasing luminosity, with the fraction of starburst-dominated ULIRGs going from 80%–85% at the low luminosity end to 50% for L21012 L⊙, and the remaining fraction being AGN-dominated (Genzel et al., 1998; Lutz et al., 1998; Veilleux, Kim & Sanders, 1999). Comprehensive reviews of the properties of ULIRGs are given in Sanders & Mirabel (1996) and Genzel & Cesarsky (2000).
Despite their large luminosities, bright infrared sources do not represent a major contributor to the energy budget of galaxies in the present-day Universe. Such objects are relatively rare within the local 100–200 Mpc: galaxies with L1011 L⊙ and with L1012 L⊙ represent 6% and 1%, respectively, of the total infrared emission in the local Universe (Soifer, Houck & Neugebauer, 1987; Sanders & Mirabel, 1996; Kim & Sanders, 1998; Yun, Reddy & Condon, 2001). However, the contribution of infrared–bright sources to the galaxy energy budget increases with redshift (see section 5.2), as does their relevance in the framework of galaxy evolution.
3.6 Summary
Although the issue of dust opacity of galaxies is far from settled, an overall picture is apparent: galaxies in the local Universe are only moderately opaque, and extreme values of the opacity are only found in the statistically non-dominant, more active systems.
Table 3 summarizes the main conclusions of this section, by listing the effective extinction values for local galaxies according to morphological type. For disk and irregular galaxies, both the face-on and the inclination-averaged extinctions are given. For instance, in Sb-Scd galaxies, the typical inclination-averaged extinctions are 0.6–0.65 mag larger than face-on at 0.15 m, 0.4 mag at B, 0.25 mag at I, and 0.1 mag at K, for a stellar to dust scaleheight ratio that varies between 1 in the UV and 2 in the I and K bands (model 5 of section 2.2).
Among the non-active galaxies, luminous Sb–Scd galaxies contain the largest amounts of dust, which absorb 1/2 of their bolometric light. For comparison, dust emission represents between 35% and 40% of the bolometric luminosity of our Milky Way galaxy (Cox, Krügel & Mezger, 1986; Sodroski et al., 1994). The dust content generally decreases in less luminous galaxies and for earlier and later type galaxies; dust absorbs less than 15% of the bolometric light in E/S0 galaxies, and the fraction rises to 30% in irregulars (Table 3).
Interpolating from Table 3, the inclination-averaged effective extinction of the stellar emission in late spiral galaxies at the restframe wavelength of H is A0.60 mag. This value should be compared with the effective extinction measured for the H line emission, A0.8–1.1 mag, from the ratio of the line to the reddening-free thermal radio emission (Kennicutt, 1983; Niklas, Klein & Wielebinski, 1997; Kennicutt, 1998; Bell & Kennicutt, 2001). Althought there are relatively large uncertainties associated with both numbers, the two extinction values suggest that the nebular emission is more reddened than the stellar continuum, with A1.5 A0.6563. Studies of controlled samples indicate a value of 2 as more typical for the ratio between the dust attenuation of the ionized gas and that of the stellar continuum, both in the case of spirals and irregulars (Bell, 2001) and in the case of moderate-intensity starbursts (section 4).
4 A Case Study in the Local Universe: Starburst Galaxies
Among local galaxies, starbursts occupy a special niche. The average UV and infrared luminosities (both proxies for SFR) per unit comoving volume increase with redshift by roughly an order of magnitude up to z1–2 (Lilly et al, 1996; Cowie, Songaila & Barger, 1999). Active star formation played a larger role in the past than today, and may have been a fundamental ingredient in the shaping of galaxy populations.
Nuclear and circumnuclear starbursts occur in galaxies spanning a wide range of properties, from almost dust-free, infrared-faint, low-mass irregulars (e.g., Tol1924416 and NGC1569) to dust-rich, massive spirals (e.g, NGC5236), to infrared-bright interacting galaxies (e.g., NGC7714 and NGC6090), to mergers and ULIRGs (e.g., NGC4194 and NGC1614; Arp220, Scoville et al., 1998). Nuclear and circumnuclear bursts of star formation can be triggered by a variety of mechanisms, including secular evolution of bars (Friedli & Benz, 1995; Norman, Sellwood & Hasan, 1996) and galaxy interactions and mergers (Larson & Tinsley, 1978; Keel et al., 1985; Sanders et al., 1988; Mihos & Hernquist, 1996; Hibbard, 1997). The latter produce the most luminous starbursts (ULIRGs), which rapidly deplete the molecular gas content of the galaxy as merging progresses (Yu & Solomon, 1999). Less extreme starbursts, hosted in galaxies with L51011 L⊙, obey a positive correlation between the luminosity of the starburst and the luminosity and mass of the host galaxy (Heckman et al., 1998):
| (5) |
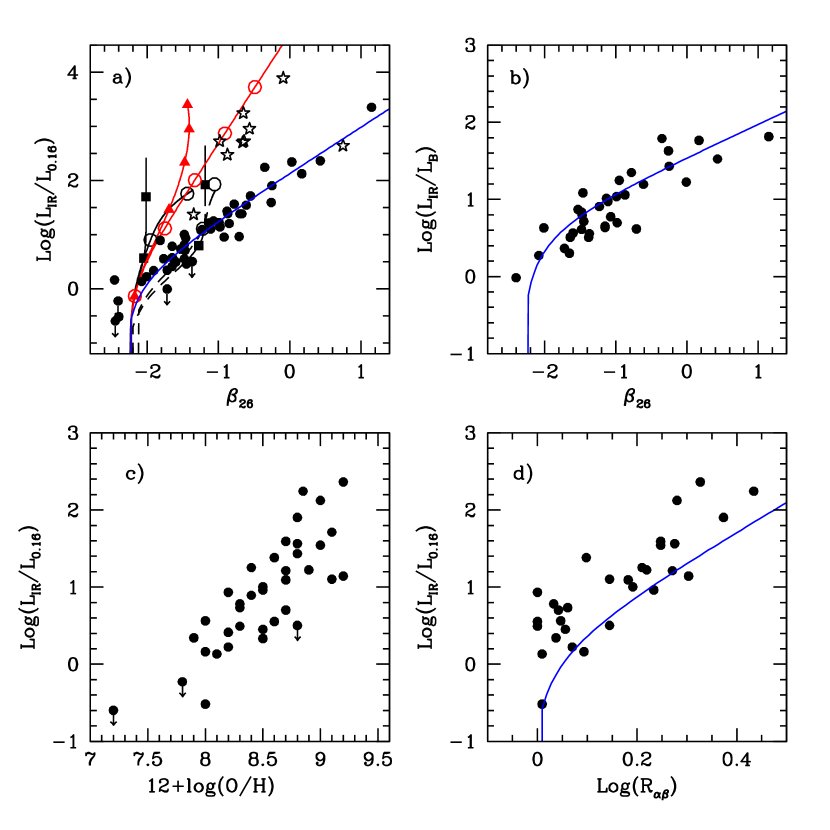
where SFRstarb is in M⊙ yr-1 for a Salpeter IMF in the mass range 0.1–100 M⊙ (from the formulae of Kennicutt, 1998). Equation 5 is probably a consequence of the fact that large SFRs are substained by the massive gas inflows that only a deep potential well can support (Heckman et al., 1998). Indeed, from causality arguments, the maximum luminosity of a starburst scales as v2, with the dispersion velocity of the gas and v the rotation velocity of the host galaxy (Heckman, 1994; Lehnert & Heckman, 1996; Meurer et al., 1997). There are notable exceptions to this average trend: M82 is an example of a dwarf, M1010 M⊙ (Sofue et al., 1992) and L5109 L⊙, galaxy hosting a relatively powerful starburst, with SFR6 M⊙ yr-1 and L31010 L⊙. A secondary effect of both the SFRstarb–host galaxy mass correlation and the mass-metallicity correlation is that the more powerful starbursts are hosted in the more metal-rich and dustier host galaxies (Heckman et al., 1998, also Figure The Dust Opacity of Star-Forming Galaxies, panel c):
| (6) |
(see, also, Hopkins et al., 2001). Although equation 6 is not applicable to ULIRGs, still in the local Universe there are no examples of ‘naked’ Arp220-like galaxies, emitting most of the luminosity produced by their SFR100–200 M⊙ yr-1 directly in the UV. Objects like Arp220 tend to be heavily extincted, with A15–45 mag for Arp220 itself (Scoville et al., 1998; Genzel et al., 1998; Shioya, Trentham & Taniguchi, 2001), and to be bright infrared sources (section 3.5).
The rest of section 4 discusses the dust reddening and obscuration properties of the local starburst galaxies with L51011 L⊙. The specific sample contains starbursts that are UV–luminous enough to have been detected by IUE (Kinney et al., 1993); it will be termed ‘UV-selected’ in what follows. The sample is not statistically complete or rigorously defined; however, it is representative of the broad range of properties of local UV–bright starbursts (Heckman et al., 1998). These galaxies are not as extreme in dust extinction and activity level as ULIRGs. They have SFRs per unit area in the range 0.3–20 M⊙ yr-1 kpc-2 and cover a limited range in the parameter space of optical attenuation, A0–2.5 mag. The attenuation refers to the integrated value across the starburst site; individual regions or clumps can have effective extinctions as high as A30 mag (Beck et al., 1996; Calzetti et al., 1997). The host galaxies cover a wide variety of late type morphologies, from grand design spirals to irregular and amorphous, to distuberd morphologies that result from interactions or merging processes. The starbursts mostly occupy the inner region of solid body rotation of the host galaxy, with sizes 0.5–4 kpc (Lehnert & Heckman, 1996). The UV selection (Kinney et al., 1993; Calzetti, Kinney & Storchi-Bergmann, 1994) aids the discrimination from their more opaque and infrared-brighter counterparts. Although the UV selection results in some limitations to the applicability of the obscuration properties discussed below (see end of section 4.2), it does not entirely exclude dusty systems; the sample contains objects in which up to 90%–95% of the bolometric energy is re-processed by dust. Table 4 gives three representative examples each for both the high-luminosity, dust-rich end and the low-luminosity, dust-poor end of the UV-selected starbursts, together with the average of the sample.
4.1 Dust Obscuration Characteristics of Starbursts
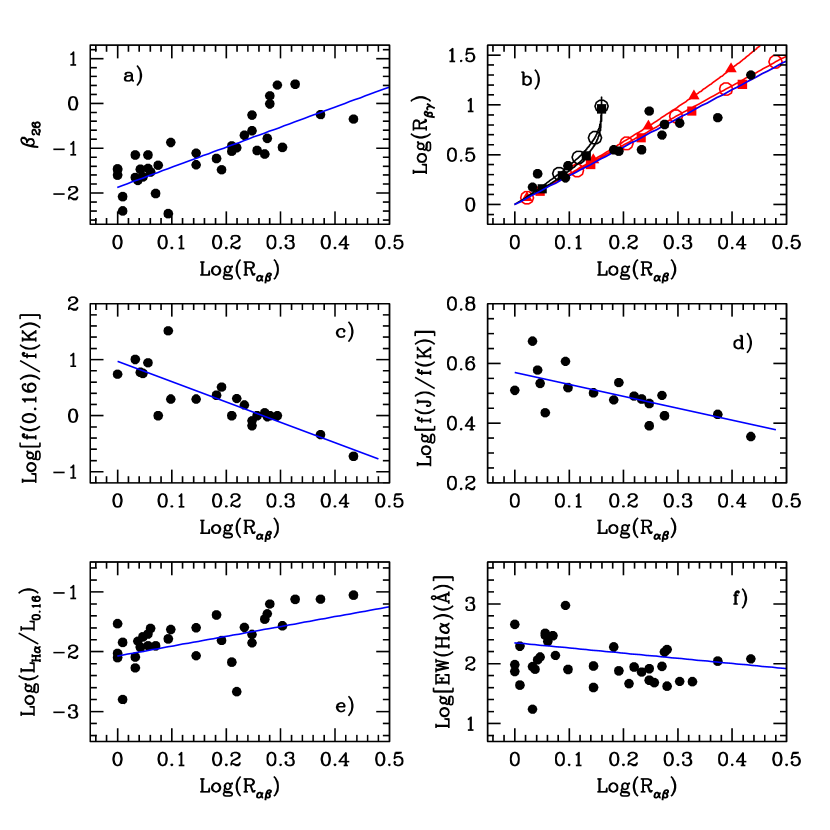
Although the UV-selected starbursts form an heterogeneous set, their dust reddening and obcuration properties are remarkably uniform. Higher dust optical depths produce redder UV–to–near–IR SEDs and nebular emission line ratios (Figure The Dust Opacity of Star-Forming Galaxies), almost independent of the details of the dust distribution and of the intrinsic stellar population (Calzetti, Kinney & Storchi-Bergmann, 1994; Calzetti, 1997a).
The geometry of the dust that best describes the reddening of the ionized gas emission in these systems, in the wavelength range 0.48 m–2.2 m, is that of a foreground–like distribution. Figure The Dust Opacity of Star-Forming Galaxies, panel b, shows the comparison between observations and the models of section 2.2 for the attenuated-to-intrinsic hydrogen line ratios H/H and H/Br. Internal dust does not appear to be a major component in the starburst region(s), and the little present is likely to be in compact clumps (Calzetti et al., 1995b). The main source of opacity appears to be given by dust that is external, or mostly external, to the starburst region (although still internal to the host galaxy), similar to a (clumpy) dust shell surrounding a central starburst. This is, of course, verified only in the B–to–K wavelength range where the reddening of the nebular emission lines has been measured; measurements at longer wavelengths could easily reveal more complex geometries. From a practical point of view, the data in Figure The Dust Opacity of Star-Forming Galaxies, panel b, are well described by a simple foreground, non-scattering dust distribution, with MW extinction curve for the diffuse ISM (R(V)=3.1); the reddening of the ionized gas is thus parametrized by the color excess E(BV)gas (equation 4).
The stellar continuum colors show the trend to become redder for increasing reddening of the hydrogen emission line ratios (Figure The Dust Opacity of Star-Forming Galaxies, panels a–c–d). The implications are twofold: (1) variations of the intrinsic SED from galaxy to galaxy are secondary relative to the trend induced by dust obscuration, and (2) within each starburst, the same foreground–like dust geometry holds for both the ionized gas and the non-ionizing stellar continuum.
The first implication is not surprising, at least at UV wavelengths. Since we are observing the Rayleigh-Jeans part of the massive stars spectrum, the intrinsic UV spectral slope888 and refer to the intrinsic and observed, respectively, UV spectral slope measured between 0.125 m and 0.26m as defined in Calzetti, Kinney & Storchi-Bergmann (1994), see Appendix B for more details. is relatively constant over a fairly large range of ages, with values 2.72.2 for constant star formation over 106 yrage109 yr (see Leitherer & Heckman, 1995, and the Table in Appendix B). In the same conditions, the production of ionizing photons is also constant. In an instantaneous burst of star formation, the ionizing photons are more age-sensitive than the non-ionizing photons that produce the stellar continuum and disappear before appreciable changes in the UV spectral shape can be observed. The observed UV spectral slope of the UV-selected starbursts span the range 2.50.4, much larger than what expected from stellar population variations alone, and increases for increasing values of the attenuated-to-intrinsic hydrogen line ratios (i.e., color excess, Figure The Dust Opacity of Star-Forming Galaxies).
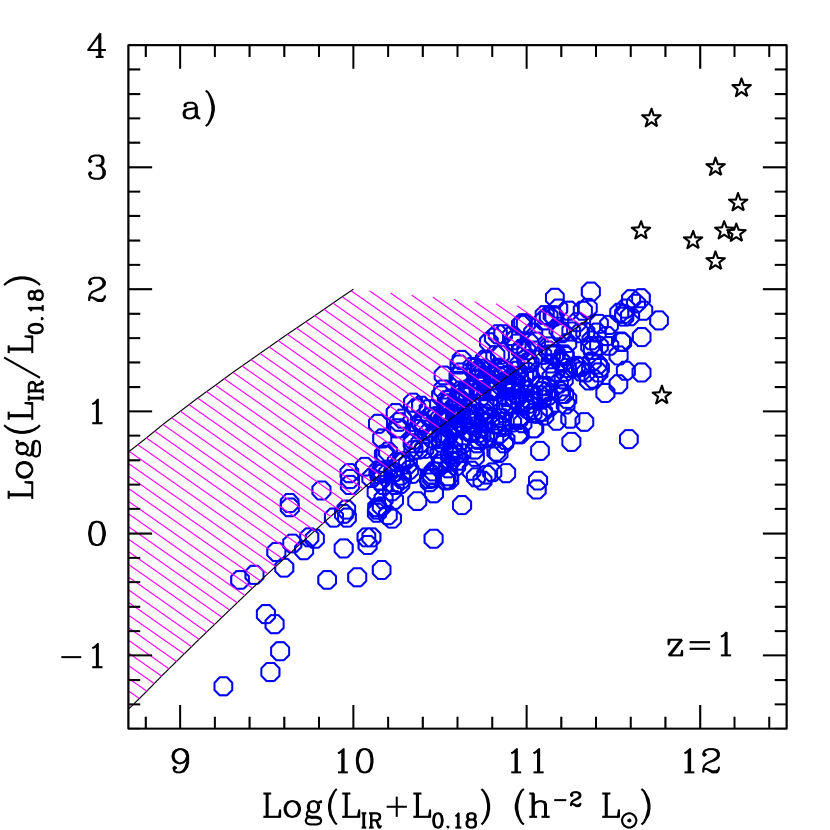
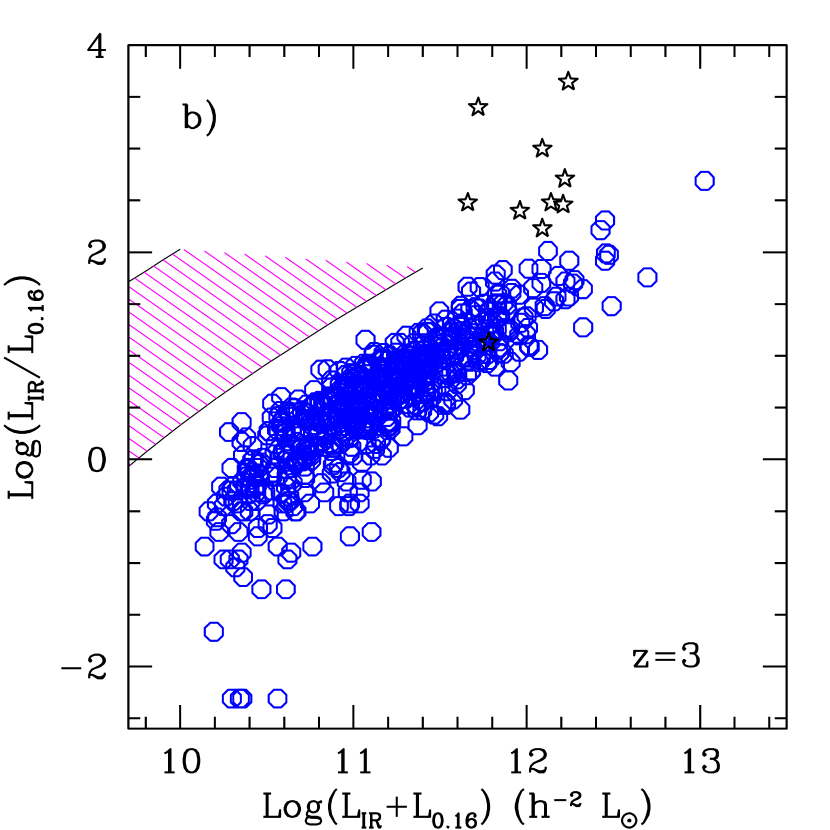
In addition to correlate with the reddening of the ionized gas, the reddening of the UV stellar continuum, as measured by , correlates with the the infrared-to-blue and the infrared-to-UV luminosity ratios, LIR/LB and LIR/L0.16 ((Figure The Dust Opacity of Star-Forming Galaxies and Calzetti et al., 1995b; Meurer et al., 1999). These ratios are a measure of the total dust opacity in the starburst region, because the bulk of the starburst’s energy is coming out in the UV–B. In addition, dust absorption is the main process that removes light from the line of sight (Calzetti et al., 1995b); when large galactic regions are observed light scattered by dust out of the line of sight compensates, on average, that scattered into the line of sight. The opacity–reddening correlation means that measurements of reddening can be used to infer the total dust absorption in UV-selected starbursts (Meurer et al., 1999) with an uncertainty, A0.6 mag for individual objects and 20% when averaged over large samples (Calzetti et al., 2000), that is dominated by variations in the starburst populations and in the details of the dust geometry from galaxy to galaxy. Such a correlation is expected for a foreground-like dust geometry (Figure The Dust Opacity of Star-Forming Galaxies, panel d; see discussion in Gordon et al., 2000).
The slopes of the correlations in Figure The Dust Opacity of Star-Forming Galaxies identify the reddening suffered by the stellar continuum, AAλ2,star=[ke()-ke()]E(BV)gas, with ke() the obscuration curve, while the total obscuration measurements of Figure The Dust Opacity of Star-Forming Galaxies provide the zeropoint for ke() (see, also, Calzetti et al., 2000). The intrinsic starburst flux density f is thus recovered from the observed flux density f via:
| (7) |
where the obscuration curve for the stellar continuum, ke(), is given by (Calzetti et al., 2000):
| (8) | |||||
The above expression folds into a single functional form a variety of effects: extinction proper, scattering, and the geometrical distribution of the dust relative to the emitters. It is derived from the spatially integrated colors of the entire stellar population in the starburst, and represents the ‘net’ obscuration of the population itself. As mentioned above, the obscuration curve has mainly an absorption component, as the effects of scattering are averaged out. Thus, it should not be confused with the extinction curve k() defined in section 2.1. Equation 8 implies that 1 mag of reddening between B and V for the ionized gas, AAV,gas=1 mag, corresponds to AAV,star=0.44 mag of reddening for the stellar continuum. This fact can be alternatively expressed as:
| (9) |
In other words, the stellar continuum suffers roughly half of the reddening suffered by the ionized gas (Calzetti, Kinney & Storchi-Bergmann, 1994; Fanelli, O’Connell & Thuan, 1988; Mas-Hesse, Arnault & Kunth, 1989, see, also, Figure The Dust Opacity of Star-Forming Galaxies, panels e and f). Although E(BV)star parametrizes the amount of reddening of the stellar continuum, it is not a color excess proper as in the case of individual stars, because of the dust geometry effects folded in the expression of ke(). One obvious characteristic of the obscuration curve is the absence of the 0.2175 m bump, which is a prominent feature of the MW extinction curve (Figure The Dust Opacity of Star-Forming Galaxies). Dust/emitter geometries that can dilute the bump include mixed distributions with large optical depths (Natta & Panagia, 1984; Granato et al., 2000; Gordon et al., 2000). However, mixed geometries do not account for the full range of observational data (Figure The Dust Opacity of Star-Forming Galaxies), because the sources that contribute to the emerging SED are located at progressively lower optical depths for decreasing wavelength. In particular, the reddest UV slope produced by mixed geometries is (Charlot & Fall, 2000), to be compared with observed in starburst galaxies (Figure The Dust Opacity of Star-Forming Galaxies, panel a). Thus, the lack of the feature is probably intrinsic to the extinction curve of the starbursts (Gordon, Calzetti & Witt, 1997), and may be due to the high UV energy densities that characterize these regions (sections 2.1 and 4.2).
4.2 The Physical Origin of the Dust Geometry in ‘UV–bright’ Starbursts
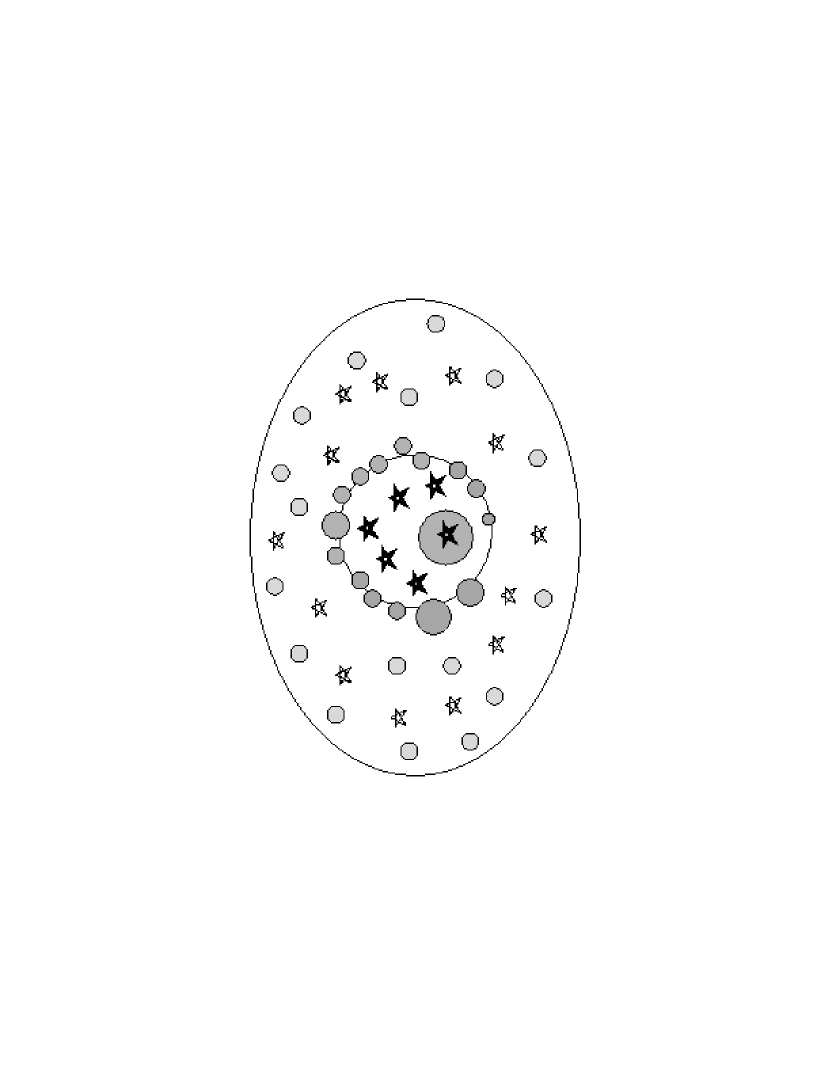
This section describes a dust model that attempts to reconcile two apparently contradictory facts: (1) stars in starbursts are on average a factor 2 less reddened than the ionized gas (equation 9), and (2) both stars and ionized gas are affected by the same foreground-like dust distribution (Figure The Dust Opacity of Star-Forming Galaxies). A schematic representation of a dust/star/gas configuration that can at the same time account for both effects is shown in Figure The Dust Opacity of Star-Forming Galaxies. Stars are born within optically thick molecular clouds, and the short-lived, most massive stars remain closely associated with their parental cloud and the gas they ionize for their entire lifetime (e.g., Walborn et al., 1999). These stars and their surrounding gas will be generally highly attenuated. As the starburst population evolves, the inside of the region of star formation becomes depleted of dust (Calzetti, Kinney & Storchi-Bergmann, 1996). With energy densities 100 times higher than in the local ISM, starburst environments are rather inhospitable to dust. Shocks from supernovae destroy dust grains, via grain-grain collisions and sputtering (Draine & Salpeter, 1979; Jones et al., 1994). The average lifetime of a refractory grain is 8106 yr, for a supernova rate of 0.05 yr-1 and an ISM mass of 5108 M⊙ (e.g., McKee, 1989), about one order of magnitude or more shorter than the typical lifetimes of starbursts (Calzetti, 1997a; Calzetti et al., 1997; Greggio et al., 1998; Aloisi, Tosi & Greggio, 1999). In addition, hot-star-winds- and supernova-driven outflows evacuate both interstellar gas and dust from the region (Heckman, Armus & Miley, 1990; De Young & Heckman, 1994; Mac Low & Ferrara, 1999; Ferrara & Tolstoy, 2000; Heckman et al., 2000). R136, the central cluster in 30 Doradus, is an example of a few million years old cluster surrounded by an evacuating region (Scowen et al., 1998). Ionized gas separated, in projection, from the hot stars has also been observed in nearby starbursts (Hunter & Gallagher, 1997; Wang, Heckman & Lehnert, 1998; Calzetti et al., 1999; Maíz-Apellániz & Walborn, 2000).
The evacuated (clumpy) dust will act as a foreground-like distribution for both the gas (also at the edges of the region) and for the central stars (Figure The Dust Opacity of Star-Forming Galaxies, Calzetti, Kinney & Storchi-Bergmann, 1996; Witt & Gordon, 2000; Gordon et al., 2000); however, the ionized gas will be more obscured than the stars, because of its spatial location and closer association with the dust (Calzetti, 1997a). This gas is more likely to contribute to the nebular emission observed at UV–optical wavelengths than the gas in molecular clouds, because of its milder obscuration. In the presence of multiple generations of starburst populations, the long-lived, non-ionizing stars have time to ‘diffuse’ into regions of lower dust density (Calzetti, Kinney & Storchi-Bergmann, 1994; Charlot & Fall, 2000; Granato et al., 2000), as their native clusters are disrupted by evaporation or by the host galaxy’s gravitational field (Leisawitz & Hauser, 1988; Kim, Morris & Lee, 1999; Tremonti et al., 2001). Cool stellar populations in the LMC have, for instance, been observed to be less embedded in dust than hotter stellar populations (Zaritsky, 1999). A similar trend is observed in the young (20 Myr) open clusters of the Milky Way (Yadav & Sagar, 2001). Massive, non-ionizing stars can still produce significant UV emission. Hence, the integrated UV–optical stellar continuum from the combination of the ageing, diffusing populations and the starburst-embedded young populations will be less obscured than the emission from the nebular gas (Calzetti, Kinney & Storchi-Bergmann, 1994; Gasda & Leitherer, 1996). For the stellar continuum and the ionized gas to have correlated obscuration values (equation 9), multiple starburst generations or long-lasting star formation events (rather than ‘instantaneous’ events) are needed to attain an equilibrium between the number of stars drifting out of molecular clouds/starburst regions and the number of newly-born, dusty stars. Starbursts hosted in dwarf galaxies are observed to have on-going star formation over 200 Myr (Calzetti et al., 1997; Greggio et al., 1998; Aloisi, Tosi & Greggio, 1999), and durations could be as long in more massive starburst galaxies (Calzetti, 1997a).
Although the obscuration curve can be widely applied to UV-selected starbursts, it is not necessarily applicable to systems with different stellar population or ISM characteristics. In the case of non-starburst galaxies there is no obvious mechanism for creating a foreground-dust-like geometry. In extreme starbursts as the ULIRGs, the non-applicability of the obscuration curve has been demonstrated observationally (Goldader et al., 2001, and Figure The Dust Opacity of Star-Forming Galaxies, panel a). In these galaxies, the high central concentration of gas and dust is likely to induce more extreme geometries than in UV-selected galaxies, and to produce combinations of clumpy mixed and foreground distributions. Galaxies whose infrared properties are intermediate between the ULIRGs and the UV-selected galaxies will progressively deviate from the dust geometry of the latter (Alonso-Herrero et al., 2001; Förster Schreiber et al., 2001). Dust in subsonic HII regions is likely to be mixed with the stars, rather than having been pushed away or destroyed as in starbursts, and scattering of stellar light into the line of sight may be an important component in the attenuation budget (Caplan & Deharveng, 1986; Bell et al., 2001). Because of the differences in the physical environment between the two types of objects, the foreground-dust-like approximation no longer holds for subsonic HII regions and equation 8 does not apply. Differences in the star formation history can also contribute to the difference between subsonic HII regions and starbursts, with instantaneous bursts being a better description for the former and extended star formation for the latter; thus, differential attenuation between ionized gas and stars is not necessarily expected in the HII regions. Supersonic HII regions could be at the boundary between the two extremes just discussed; one example is 30 Doradus, that has evolved to the point of resembling a mini-starburst (Walborn, 1991).
To conclude, the starburst obscuration curve is a purely empirical result, and its derivation is independent of any assumption about the starburst’s population, the dust geometry, or the details of the extinction curve. It provides statistical estimates of the reddening and obscuration of local UV-selected starbursts, and deviations as large as 0.6 mag from the mean obscuration at 0.16 m are to be expected on an case-by-case basis. The physics of the starburst environment provides an explanation of the ‘foreground-dust-like’ behavior of the curve, of the correlation between the reddening of the ionized gas and that of the stellar continuum, and of the correlation between reddening and total obscuration. As a sample, local UV-selected starbursts are characterized by modest amounts of reddening and obscuration, that are correlated with the star formation activity (equation 6). The median color excess is E(BV)0.35 (Calzetti, 1997b), corresponding to UV continuum attenuations of A1.6,1.4,1.1 mag at 0.15,0.20,0.30 m, respectively (Table 4 and Buat & Burgarella, 1998; Meurer et al., 1999).
4.3 Useful Expressions
Observables like the UV slope, the colors, and the luminosities and equivalent widths of the hydrogen lines can be readily related to the dust-induced color excess of the ionized gas and, through equation 9, of the stellar continuum. The UV slope is correlated with E(BV)gas (Figure The Dust Opacity of Star-Forming Galaxies panel a), and equation 8 gives:
| (10) |
where a list of values is given in the Table of Appendix B. The slope of the correlation between and E(B-V)gas is somewhat steeper than that measured by Calzetti, Kinney & Storchi-Bergmann (1994) directly from the data (1.880.28), but the two are within 1 of each other. It should also be noted that equation 10 becomes a lower envelope to the data points in Figure The Dust Opacity of Star-Forming Galaxies, panel a, for 2.25, a value appropriate for dust-free, star-forming populations. This indicates that variations of the dust/stars/gas geometry from the schematic model of Figure The Dust Opacity of Star-Forming Galaxies and/or of the stellar population from the theoretical extreme 2.25 has the effect of reddening the UV slope even for E(B-V)0. The vertical scatter in Figure The Dust Opacity of Star-Forming Galaxies, panel a should thus be interpreted as due to such variations from galaxy to galaxy.
Reddening expressions for optical colors can be directly derived from equation 8 (see, also, Figure The Dust Opacity of Star-Forming Galaxies, panels c and d). A mixed UV–optical color, 0.28V, could be useful to infer the reddening of intermediate redshift (z0.6) starburst galaxies observed in B and I, and the reddening of one relative to the other is given by:
| (11) |
Under the assumption that the restframe UV emission and the nebular lines are both due to massive stars, the reddening of the UV continuum relative to the nebular hydrogen emission is given by:
| (12) | |||
| (13) | |||
| (14) |
Figure The Dust Opacity of Star-Forming Galaxies, panel e shows the comparison between data of local galaxies and equation (13) (Calzetti, 1997b). While the agreement between the data in the first four panels of Figure The Dust Opacity of Star-Forming Galaxies and equation 8 is a direct consequence of the fact that those data were used to derive the starburst obscuration curve, the match between data and expected trend in the bottom two panels of the figure is a consistency check, since it was not imposed a priori.
One immediate consequence of the differential reddening between gas and stars is that the equivalent widths of the nebular lines depend on the amount of gas obscuration; for the H and H emission lines the relations are (Calzetti, Kinney & Storchi-Bergmann, 1994):
| (15) | |||
| (16) |
where the attenuated and intrinsic EWs are directly compared. Comparison of these trends with the data points is shown in panel f of Figure The Dust Opacity of Star-Forming Galaxies; the trend given by the obscuration curve marks an upper envelope to the ensemble of observed EWs, because the presence of older stellar populations underlying the starbursts dilutes the contrast between the emission lines and the stellar continuum in the data.
Statistically speaking, the UV slope is a good estimator of the total obscuration affecting the starburst (Meurer et al., 1999, and Figure The Dust Opacity of Star-Forming Galaxies); in particular, the ratio of the dust infrared luminosity, LIR, to the stellar UV or blue luminosity, L0.16 or LB, is related to via:
| (17) | |||
| (18) |
The two constant values on the left-hand-side of equations 17 and 18, 1.68 and 3.85, represent the bolometric corrections of the stellar emission relative to the UV or B. The correction for the B-band is larger and subject to more uncertainties than that for the UV, hence the larger scatter in the data point of Figure The Dust Opacity of Star-Forming Galaxies, panel b. Equation 17 can be rewritten as:
| (19) |
where the equation above represents a lower envelope to the data (Figure (7), panel d and Calzetti et al., 2000), and has a scatter comparable to that of Figure The Dust Opacity of Star-Forming Galaxies, panel a. The nature of the scatter in the vs. E(B-V)gas and in the LIR/L0.16 vs. E(B-V)gas relations is the same: it is due to variations from galaxy to galaxy of the starburst populations and of the dust/star/gas geometry.
5 Measurements of Dust Opacity in High-Redshift Galaxies
As discussed in the Introduction, the energy balance between UV–optical and infrared cosmic background suggests that there have been infrared luminous galaxies at all epochs. The number density of quasars was 100 times higher at z2.5 than today (e.g., Shaver et al., 1999) and star formation activity was 3 to 10 times higher at z1 than at z0 (Lilly et al, 1996; Cowie, Songaila & Barger, 1999), flattening or decreasing only beyond z1–2 (Madau et al., 1996; Steidel et al., 1999). If the association between activity and dust opacity observed in the local Universe (equation 6) holds at high redshift as well, galaxies in the past may have been as dusty as or dustier than today (section 5.2).
Among the methods described in section 3, the multiwavelength comparison is the only practical approach for measuring the dust opacity of galaxies beyond the local few hundred Mpc. However, because of observational difficulties, the wavelength coverage of the typical sample is limited to a few windows, often with little overlap from sample to sample. Measures of the content, nature, and opacity effects of the dust in distant galaxies are therefore still at a very early stage, and the picture is vastly incomplete and controversial.
5.1 Dust in Damped Ly Systems
The very first evidence for presence of dust in high redshift systems came from studies of Damped Ly Systems (DLAs, Meyer & York, 1987; Fall, Pei & McMahon, 1989; Meyer & Roth, 1990; Pettini, Boksenberg & Hunstead, 1990; Pei, Fall & Bechtold, 1991; Pettini et al., 1994; Zuo et al., 1997; Pettini et al., 1997a; Vladilo, 1998; Pettini et al., 2000a; Ge, Bechtold & Kulkarni, 2001). DLAs are the largest HI column density absorption systems seen in the spectra of background quasars, with N(HI)1020.3 cm-2. Their metallicities cover the range 1/100–1/10 solar for z0.5–4, with a mean value 1/13 solar at z0.5–3 and little evidence for evolution with redshift (Prochaska & Wolfe, 2000; Pettini et al., 1999, 1997b; Lu et al., 1996). Selection biases against the dustiest, and most metal-rich DLAs and problems with dust depletion corrections have been advocated as possible reasons for the observed weak metallicity evolution (Fall & Pei, 1993; Boissé et al., 1998; Savaglio, Panagia & Stiavelli, 2000, see, however, Ellison et al. (2001)). The dust fraction in DLAs is measured by comparing the abundance of dust-depleted metals such as Cr II, Fe II, and Si II against that of a metallicity tracer such as Zn II, all of them producing rest-frame UV absorption lines (Meyer & York, 1987). The dust-to-metals ratio in DLAs is in the range 50%–60% of the Milky-Way value; this, combined with the generally low metallicities, indicates that DLAs are relatively transparent systems, with dust-to-gas ratios between 2% and 25% of the Milky-Way value (Fall, Pei & McMahon, 1989; Pei, Fall & Bechtold, 1991; Pettini et al., 1997a; Vladilo, 1998). The absence of the 0.2175 m dust absorption associated with DLAs led Pei, Fall & Bechtold (1991) to conclude that the extinction curve in these systems is probably similar to the one observed in the Magellanic Clouds. More recently, though, Malhotra (1997) reported a 3 detection of the dust absorption feature in the composite spectra of MgII absorbers. Although presence of modest quantities of dust is well established in DLAs, the weak or absent evolution of the metal content and of the cosmological mass density with redshift (Rao & Turnshek, 2000) questions their relationship to luminous galaxies, and favors the interpretation that DLAs preferentially trace galaxies with extended gas distributions and low metal and dust contents (Le Brun et al., 1997; Turnshek, Rao & Nestor, 2001) and the unevolved outskirts of galaxies (Ferguson, Gallagher & Wyse, 1998).
5.2 Dust Emission from Distant Star-Forming Galaxies
In recent years, facilities/instruments like ISO and the Sub-millimeter Common User Bolometer Array (SCUBA) at the James Clerk Maxwell Telescope (JCMT) have achieved high enough sensitivities in the mid– and far–infrared to detect dust emission beyond a few m from statistically significant samples of galaxies at cosmological distances. Studies on the ISO and SCUBA surveys, especially the identification of the optical/near–IR counterparts to the infrared sources and the redshift measurements, are still ongoing and the results described below should be considered in many instances preliminary.
ISO surveys have yielded 1,500 sources in the redshift range 0z1.5, down to a sensitivity limit of 0.1 mJy in the mid–IR (6.75 m, 12 m, and 15 m) and 0.1 Jy in the far–IR (90 m and 175 m, Rowan-Robinson et al., 1997; Oliver et al., 1997; Taniguchi et al., 1997; Kawara et al., 1998; Clements et al., 1999; Altieri et al., 1999; Aussel et al., 1999; Flores et al., 1999a, b; Puget et al., 1999; Serjeant et al., 2000; Scott et al., 2000; Efstathiou et al., 2000; Dole et al., 2001). Full lists of all surveys are given in Rowan-Robinson et al. (1999) and Elbaz (1999). The number counts at 175 m account for 10% of the CIB (Puget et al., 1999; Dole et al., 2001), showing that the bulk of the background has not been resolved yet at these wavelengths. Neverthless, the number counts at mid– and far–IR wavelengths are about 3–10 times above the no-evolution extrapolation of the local IRAS counts (Elbaz et al., 1999; Aussel et al., 1999; Puget et al., 1999; Serjeant et al., 2000; Efstathiou et al., 2000). The implication is a strong luminosity evolution, L(1z)4.5, or a combination of luminosity and density evolution of the infrared sources out to z1 (Clements et al., 1999; Xu, 2000; Chary & Elbaz, 2001; Franceschini et al., 1994; Guiderdoni et al., 1998), that is comparable to or stronger than the luminosity evolution observed at restframe UV wavelengths out to the same redshift (Lilly et al, 1996; Cowie, Songaila & Barger, 1999; Sullivan et al., 2000). The ISO counts are thus dominated by luminous infrared galaxies at z1, with LL1011 h L⊙ (Rowan-Robinson et al., 1997; Elbaz, 1999; Xu, 2000). Although this conclusion is based on the highly uncertain conversion of the 15 m emission999At z1 the flux density at 15 m is centered on the restframe emission of the aromatic features that dominate the region between 6 m and 12 m; the relation between the intensity of the features and the total infrared emission is still unsettled (Boselli et al., 1998; Dale et al., 2001). to a total infrared luminosity, it is qualitatively supported by the optical counterparts of the ISO sources. Close to 100 mid–IR sources, with median redshift z0.7–0.8 have been so far identified at optical/near–IR wavelengths (Aussel et al., 1999; Flores et al., 1999b; Rigopoulou et al., 2000) [z0.1–0.2 for the 12m sample (Clements, Desert & Franceschini, 2001)]. Many of the restframe optical spectra show characteristics of dusty luminous starbursts, with current bursts of star formation superimposed on a prominent population of A stars, and with attenuation values A0.5–1.8 mag (Flores et al., 1999b; Rigopoulou et al., 2000; Poggianti & Wu, 2000).
At the time of writing, SCUBA surveys at 850 m of ‘blank’ fields and targeted lensed objects have detected a total of 100 sources with flux densities in the range 0.5 mJy to 10 mJy and redshifts between z1 and 3, although sources as far away as z5 may be present (Smail, Ivison & Blain, 1997; Hughes et al., 1998; Barger et al., 1998; Smail et al., 1998; Eales et al., 1999; Lilly et al., 1999; Smail et al., 1999; Barger et al., 1999b; Barger, Cowie & Richards, 2000; Smail et al., 2000; Eales et al., 2000; Chapman et al., 2001; Fox et al., 2001; Scott et al., 2001). The number counts down to 2 mJy and to 0.5 mJy account for 20%–30% and more than 90%, respectively, of the CIB (Hughes et al., 1998; Barger et al., 1998; Eales et al., 1999; Barger, Cowie & Sanders, 1999a; Eales et al., 2000; Blain et al., 1999c). However, the latter fraction is potentially affected by small number statistics: so far only a few sources have flux densities below 2 mJy, the SCUBA confusion limit in blank fields, all of them from the survey of lensed galaxies (Blain et al., 1999a). Observations at 850 m probe the Raileigh-Jeans tail of the thermal dust emission of galaxies at least to redshift 5–7. A source at z1 and with an 850 m flux density of 2 mJy corresponds to a luminosity L21012 h L⊙, for typical SEDs of local infrared–selected galaxies (Lisenfeld, Isaak & Hills, 2000; Dunne et al., 2000; Dunne & Eales, 2001); this is roughly the luminosity of a ULIRG like Arp220. The few optical/near–IR counterparts which have been identified are faint, often with I24 and K20–21 (Smail et al., 1998; Barger et al., 1999b; Smail et al., 1999; Lilly et al., 1999; Ivison et al., 2000); in most cases the ratio LIR/L0.05, where LR is the luminosity in the observer–frame R band, and the infrared emission accounts for more than 95%–99% of the bolometric luminosity. It is indeed widely accepted, also on the basis of the few available multi-wavelength SEDs, that the SCUBA sources are ‘cosmological ULIRGs’ (Hughes et al., 1998; Barger et al., 1998; Lilly et al., 1999; Smail et al., 1998; Ivison et al., 2000), although this generalization has been recently questioned (Eales et al., 2000). The median redshift of the surveys is z2.5 (Lilly et al., 1999; Smail et al., 1999; Barger et al., 1999b; Barger, Cowie & Richards, 2000; Eales et al., 2000; Smail et al., 2000; Chapman et al., 2001; Fox et al., 2001); however, 10% of all the sources have reliable redshift determinations from optical/near–IR counterparts, and a total of 50% of the sample have photometric redshifts, most often derived from the radio/sub-mm spectral-index relation of Carilli & Yun (1999). The comoving number density of SCUBA sources in the redshift range z=1–3 brighter than 6 mJy is 3–510-5 h Mpc-3 in our cosmology (Barger, Cowie & Richards, 2000; Scott et al., 2001), about two orders of magnitude larger than the corresponding number density of local ULIRGs brighter than 1012 L⊙ (Kim & Sanders, 1998). A strong luminosity evolution, possibly as strong as L(1z)3 to z2, is also implied by the number counts (e.g., Scott et al., 2001). Although the statistical properties of the sources are often inferred using the star-forming Arp220 as a template, a fraction of AGNs is present in the sample (Ivison et al., 1998; Barger et al., 1999b). Current best estimates, based on the X-ray luminosity of the sources favor an AGN fraction 20% (Severgnini et al., 2000; Hornschemeier et al., 2000; Fabian et al., 2000; Barger et al., 2001); this value will generally depend on the source luminosity range, as it does in the local Universe (Genzel et al., 1998; Lutz et al., 1998; Veilleux, Kim & Sanders, 1999).
5.3 Dust Reddening and Obscuration in Distant Star-Forming Galaxies
Multi-wavelength observations of optically-selected samples of intermediate and high redshift galaxies are generally limited to the rest-frame UV and optical windows, with few exceptions (e.g., Flores et al., 1999b; Chapman et al., 2000). Such surveys suffer the same limitations of local UV–optical samples, with the added complication of the often incomplete wavelength coverage. By probing only the differential attenuation, the UV–optical data provide, in principle, lower limits to the actual dust opacity of the galaxy (section 2.2, but see also section 4). In order to differentiate an ageing stellar population from dust as the cause of the SED reddening, a variety of approaches have been adopted by different authors. Common diagnostics include the Balmer line decrement H/H, line-to-continuum ratios, e.g. H/UV and H/UV, and multi-color SED fitting. Limitations to each of these diagnostics are discussed in section 2.2 and in the sections below, as appropriate.
5.3.1 Galaxies at redshift z2
For a UV-selected sample of star-forming galaxies at z0.2, Sullivan et al. (2000) and Sullivan et al. (2001) derive an average attenuation A0.8 mag and find tentative evidence that those systems follow an obscuration–SFR correlation similar to that observed in more local galaxies (Wang & Heckman, 1996; Heckman et al., 1998; Hopkins et al., 2001). The authors use a combination of UV (0.20 m), optical (H and H) and radio (1.4 GHz) data to analyze their sample, although their reddening estimates are mostly based on the subsample for which they can measure H/H ratios. If the starburst obscuration curve (section 4) applies to z0.2 star-forming galaxies, an attenuation A0.8 mag for the nebular line corresponds to A1.3 and A1.4 for the UV stellar continuum. Although these figures agree with local measurements of the extinction at UV and H in star-forming galaxies (section 3.6 and Table 3), the UV selection of the sample potentially biases the reddening measures towards low values by excluding more heavily extincted galaxies.
The z1 Balmer–Break sample of Adelberger & Steidel (2000) is also a restframe-UV/blue–selected one. Exploiting the presence of the Balmer discontinuity at 0.365 m in galaxy SEDs to select z1 candidates (a derivative of the Lyman-Break technique, see next section), these authors have obtained spectroscopic confirmation for 700 galaxies. The sample contains a large variety of galaxies, from active starbursts to quiescent star-forming to post-starbursts. If the z1 galaxies with blue (0.3) SEDs are analogs of local starbursts and follow the same IR/UV-versus- relation, they also follow an obscuration–SFR relation similar to the local one, with a comparable range of attenuations (Figure The Dust Opacity of Star-Forming Galaxies, panel a). However, for fixed opacity, the z1 galaxies tend to have on average brighter UVIR luminosities (larger SFRs) than the z0 galaxies. Thus, even taking selection effects into account, the distant galaxies are, on average, more actively star-forming for the same amount of obscuration than the local starbursts (Adelberger & Steidel, 2000).
Glazebrook et al. (1999), Yan et al. (1999), and Moorwood et al. (2000) use restframe H observations and H/UV comparisons to infer dust reddening in star-forming galaxies at redshift z1–2.2. The I-band–selected sample of Glazebrook et al. (1999) corresponds to restframe V for a z=1 galaxy: the longer wavelength selection of the samples mitigates, although does not remove completely, the bias against dust obscured galaxies introduced by UV selections [for the Canada-France Redshift Survey employed by Glazebrook et al. (1999), see Lilly et al. (1995), and for the sample used by Yan et al. (1999), see McCarthy et al. (1999)]. The presence of dust reddening in the z1–2.2 samples is derived from the discrepancy between the measured LHα/L0.28 luminosity ratio and the ratio predicted by dust-free models101010Moorwood et al. (2000) measure the restframe LHα/L0.25 ratio; the small extrapolation to LHα/L0.28 is done here assuming a constant star formation population.. Figure The Dust Opacity of Star-Forming Galaxies compares the range of attenuated–to–intrinsic values (LHα/L0.28)a/(LHα/L0.28)o derived from data by the three groups of authors111111The intrinsic ratio (LHα/L0.28)o is an average of H and UV luminosities for a variety of IMFs, star formation histories, and metallicities of stellar populations, see Table 3 in Glazebrook et al. (1999). with predictions from the dust models of section 2.2. Geometries where dust and stars are homogeneously mixed, either in spheroidal or flattened distributions, appear less effective in reproducing the observed H/UV ratios than foreground geometries (Figure The Dust Opacity of Star-Forming Galaxies). If the foreground and starburst distributions bracket the possible range of dust/emitter morphologies for the z1–2 H galaxies, the front-to-back optical depths are 0.6–4.9 mag (Figure The Dust Opacity of Star-Forming Galaxies, bottom panel), and the effective attenuations are A0.6–4.3 mag, A1.5–5 mag, A3–7 mag, for SMC extinction. MW-like and SMC-like extinction curves give results that are less than 0.1 mag apart at 0.28 m, but 1.2 mag different at =0.16 m, with larger obscurations given by the SMC extinction curve. Uncertainties in the metallicity, IMF, and star formation history of the galaxy stellar populations introduce a factor 2 additional scatter on the inferred opacities (Table 3 in Glazebrook et al., 1999). The major limitation is, however, that dust opacities measured from the current H surveys of galaxies are probably not representative of the z1–2 population as a whole. By number, Glazebrook et al. (1999)’s and Moorwood et al. (2000)’s samples are small (13 galaxies and 5 galaxies, respectively); Yan et al. (1999)’s sample, albeit 2.5 times larger than Glazebrook et al. (1999)’s, does not measure the H emission on the same galaxies for which UV is available. For such small samples sensitivity limits induce a strong selection effect: the observed galaxies will be among the brightest in H and, in addition, contamination from AGN/Seyfert nuclei is not excluded (Whittle, 1992). Therefore, such surveys sample the high end of the activity and dust obscuration ranges for optically-detectable systems at z1–2 (Glazebrook et al., 1999; Sullivan et al., 2000, and equation 6).
In summary, the limited information available on galaxies at z1 suggests that dust opacities cover a range similar to that of local star-forming and starburst galaxies; they may follow a similar relation A(SFR)α (see equation 6), with the proportionality constant revised downward relative to the local sample.
5.3.2 Galaxies at redshift z2
To date, the surveys that have most efficiently secured large populations of galaxies beyond z2 are those that exploit the Lyman discontinuity at restframe 0.0912 m to identify high-redshift candidates; these are the so–called Lyman–Break Galaxies (LBGs, Guhathakurta, Tyson & Majewski, 1990; Steidel & Hamilton, 1992; Steidel et al., 1996a, b; Giavalisco, Steidel & Macchetto, 1996b; Lowenthal et al., 1997; Giavalisco et al., 1998; Adelberger et al., 1998; Steidel et al., 1999; Adelberger & Steidel, 2000). So far, there are 1,000 spectroscopically confirmed LBGs at z3, and 70 at z4. The LBG population is a substantial component of the high redshift “zoo”: their comoving number density at z=3 is n(z=3)310-2 h Mpc-3 (Steidel et al., 1999), comparable to the density of local galaxies (Marzke, Huchra & Geller, 1994). By selection, i.e. due to the need of presenting a relatively blue continuum longward of Ly, this high redshift population tends to be biased against systems with predominantly old populations, or systems with large amounts of dust extinction. Indeed, most LBGs show evidence for ongoing or recent star formation activity (Steidel et al., 1996b; Pettini et al., 2000b, 2001; Papovich, Dickinson, & Ferguson, 2001). From a purely phenomenological point of view, LBGs resemble local UV-selected starburst galaxies (section 4). The obscuration–corrected SFRs per unit galactic area are 0.2–25 M⊙ yr-1 kpc-2, for a 0.1–100 M⊙ Salpeter IMF (Steidel et al., 1996b, 1999; Papovich, Dickinson, & Ferguson, 2001; Shapley et al., 2001), corresponding to 0.5%–50% the maximum SFR per unit galactic area measured in the local Universe (Lehnert & Heckman, 1996; Meurer et al., 1997); this is similar to the observed range in nearby UV-selected starbursts. Restframe UV spectra show a wealth of absorption features, and often P-Cygni profiles in the CIV(1550 Å) line (Steidel et al., 1996b), which indicates the predominance of young, massive stars. Nebular emission lines observed in the brightest LBGs (Pettini et al., 1998; Teplitz et al., 2000a; Pettini et al., 2001) have intensities comparable to those of local starbursts (Meurer et al., 1999). The observed blueshifts in the UV interstellar absorption lines relative to the systemic redshifts of LBGs have been interpreted as bulk gas outflows with velocities v200–500 km s-1 (Pettini et al., 1998, 2000b), again very similar to what is observed in nearby starbursts (Heckman et al., 2000). Finally, more luminous LBGs tend to be dustier (Figure The Dust Opacity of Star-Forming Galaxies, panel b and equation 6; Adelberger & Steidel, 2000; Shapley et al., 2001). However, dissimilarities also exist between the two classes of galaxies. Star formation extends over a large fraction of the galactic body in LBGs, typically 5–30 h kpc2 (Giavalisco, Steidel & Macchetto, 1996b; Giavalisco et al., 1998), while it is confined within the inner kpc2 in local starbursts. As a result, LBGs are, on average, more rapidly star-forming than either z0 or z1 galaxies (Figure The Dust Opacity of Star-Forming Galaxies; Adelberger & Steidel, 2000; Shapley et al., 2001). The bulk outflows in LBGs have velocities that are similar to those of local infrared–bright starbursts like NGC6240 and a few times larger than those of HII galaxies (Heckman et al., 2000; Heckman & Leitherer, 1997; Kunth et al., 1998; Gonzalez Delgado et al., 1998). The implications of such differences are not fully understood yet.
Establishing how much dust LBGs contain is the subject of ongoing debate. Metals are definitely present in these systems. Although the exact value of the metallicity has not been constrained, it most likely lies between 0.1 Z⊙ and 0.7 Z⊙ (Pettini et al., 2000b; Leitherer et al., 2001; Pettini et al., 2001). The UV spectral slopes of LBGs have median value 1.5 (Adelberger & Steidel, 2000), significantly redder than the value 2.2–2.7 expected for a dust-free star-forming population (Appendix B). If interpreted in the same fashion as the UV slope of nearby UV-selected starbursts, LBGs suffer from dust obscuration at the level of A1–2 mag (Calzetti, 1997b; Pettini et al., 1998; Dickinson, 1998; Meurer et al., 1999; Steidel et al., 1999; Adelberger & Steidel, 2000), and, possibly, more (Meurer et al., 1997; Sawicki & Yee, 1998). However, a number of uncertainties and systematics limit the usefulness of UV data alone to derive obscuration estimates. First and foremost, the high redshift galaxy for which reddening corrections are sought needs to possess active, on-going star-formation (i.e., not to be a post-starburst); this appears to be true for the LBGs as a population, but may not be true on a individual basis (Papovich, Dickinson, & Ferguson, 2001). Second, for most LBGs the UV slope is derived from photometry alone; the conversion of G colors121212The G and filters have central wavelengths 0.483 m and 0.693 m, respectively (Steidel & Hamilton, 1992). to suffers from uncertainties due to the presence of both intrinsic (stellar lines and Lyman break) and intervening (Lyman Forest) absorption in the photometric filters (Adelberger & Steidel, 2000; Pettini et al., 2001). Finally, because of the age–dust degeneracy, the intrinsic UV slope is a free parameter that can lead to 1 mag difference in the derived obscuration value at 0.16 m (compare Sawicki & Yee, 1998; Steidel et al., 1999).
Supplementing the UV with restframe optical data provides further leverage for determining the level of dust reddening in LBGs. The negligible correlation between LHβ/L0.16 and the UV slope found for a sample of 15 luminous LBGs131313Measures of dust reddening obtained by comparing the UV continuum with the [OIII](0.5007 m) emission line (Teplitz et al., 2000a) are not discussed because of the strong dependence of the nebular line intensity, up to one order of magnitude variation, on the chemical and physical conditions of the gas (Jansen, 2000; Charlot & Longhetti, 2001). supports the notion that LBGs are subject to modest reddening (Pettini et al., 1998; Teplitz et al., 2000a; Pettini et al., 2001). Although this result is still dominated by the large scatter induced by both observational and model uncertainties (Pettini et al., 2001), it is consistent with what is observed in local UV-selected starbursts141414All considerations are based on the assumption that the dust in LBGs is distributed like that of local UV-selected starbursts. If, instead, the most appropriate dust geometry is a homogeneous spheroid or a face-on flattened disk, the average UV slope 1.5 corresponds to obscurations A1.2 mag and A0.50 mag, and a differential obscuration between the two of 0.7 mag; the latter is probably too large to be reconciled with observational data. Highly inclined disks are not considered in the obscuration budget, as they would probably be too dim in the UV to be selected as LBGs., for which an obscuration of 1–2 mag at 0.16 m corresponds to the modest reddening AA0.15–0.3 (section 4.3).
Although the age–dust degeneracy cannot be easily broken even with the addition of long wavelength data, extending the wavelength coverage of LBGs to the restframe optical has helped delimiting the locus of allowed combinations in the age–dust plane (Papovich, Dickinson, & Ferguson, 2001; Shapley et al., 2001). Using complementary datasets of LBGs in terms of luminosity range, Papovich, Dickinson, & Ferguson (2001) and Shapley et al. (2001) have established that there is an inverse correlation between the age of the stellar populations in a galaxy and the amount of dust reddening it suffers: the older the galaxy, the lower its reddening. In agreement with previous results (Sawicki & Yee, 1998), LBGs whose SEDs are compatible with young (108 yr) stellar populations are also dusty. Whatever dust is present, it is not preferentially obscuring selected regions of the galaxies, because of the similarity between the restframe UV and optical morphologies (Bunker, 1999; Dickinson, 2000). A typical LBG obscuration of A1–2 mag, with a median of 1.5 mag and a high-end tail around 4.5–5 mag (Steidel et al., 1999; Papovich, Dickinson, & Ferguson, 2001; Shapley et al., 2001), is currently the most broadly accepted value.
Despite all the uncertainties in estimating dust obscuration in LBGs, the inferred opacity values are modest enough that the high redshift galaxies are expected to be faint sub-mm emitters, with 850 m flux densities at or below the SCUBA detection limit of 1–2 mJy (Adelberger & Steidel, 2000; Peacock et al., 2000). Out of 10 LBGs targeted with SCUBA, only a couple have been detected (Chapman et al., 2000; van der Werf et al., 2001). Table 5 gives three examples (two LBGs and one SCUBA source) of highly reddened z3 galaxies, plus the average values of a typical LBG. The three examples are meant to show some of the most attenuated cases that are also detected at restframe UV. Table 5 demonstrates that the exact prediction of the flux density at restframe 200 m is heavily dependent on the adopted dust temperature(s) and emissivity, because long infrared wavelengths only probe the Raileigh-Jeans tail of the thermal dust emission in galaxies (Figure The Dust Opacity of Star-Forming Galaxies). Local galaxies, although extensively used as analogs of high redshift galaxies, are of limited help in this respect, given the wide range of properties they show. If the flux density of a local galaxy beyond 60–70 m is parametrized by a modified blackbody with dust emissivity :
| (20) |
ULIRGs and bright IR-selected galaxies tend to be well described by either a single-temperature component with T40 K and 1.5 (Lisenfeld, Isaak & Hills, 2000; Blain et al., 1999a) or by a warm/cool two-temperature model with =2 (Dunne & Eales, 2001); however, there is tentative indication that UV–bright, metal-poor starbursts have hotter dust SEDs, with T50 K and =2 (Tol1924–416, Calzetti et al., 2000). Equation 20, which is used for purely illustrative purposes, is clearly an over-simplification of the dust SED in local galaxies, which is characterized by a range of temperatures and, at restframe 40–70 m, by the emission from non-equilibrium dust grains (Sellgren, 1984; Draine & Anderson, 1985; Li & Draine, 2001, see, also, section 2.1). In starbursts, the latter component represents 25% of the total infrared emission. Given the uncertainty of the sub-mm measures and the current poor understanding of the detailed physics of dust emission in both local and high-redshift galaxies, the opacity of LBGs is still relatively unconstrained by sub-mm observations (Ouchi et al., 1999; Sawicki, 2001, and Table 5). Further complications (and uncertainties) arise when the comparison between predictions and observations of infrared flux densities is made for individual objects (van der Werf et al., 2001; Sawicki, 2001; Baker et al., 2001); reddening/obscuration corrections at UV-optical wavelengths are accurate only in a statistical sense and, generally, do not apply on a one-to-one basis to individual objects. For instance, if the dust geometry in a particular system is such that the scattering out of the line of sight is larger than that into the line of sight, the infrared energy, which is due to the absorption part of the extinction only, will be overestimated when derived from UV data.
5.4 Summary
There is so far limited overlap between infrared and optical surveys at intermediate and high redshift (e.g., Aussel et al., 1999; Flores et al., 1999b; Barger et al., 1999b; Rigopoulou et al., 2000; Chapman et al., 2000). Consequently multi-wavelength coverage from the restframe UV–optical to the infrared is available only for a small number of galaxies. To make matters worse, observational limitations lead to vastly different selection criteria for the optical surveys in different redshift bins (Glazebrook et al., 1999; Yan et al., 1999; Moorwood et al., 2000; Steidel et al., 1996b). Thus, conclusions about the dust opacity of galaxy populations as a whole and as a function of redshift are at the moment based on ‘reasonable’ extrapolations of existing data, rather than hard evidence.
Available infrared and optical data support the scenario that z1 star–forming galaxies cover at least the same range of dust opacities as local galaxies. The luminosity (or combined luminosity and density) evolution implied by the ISO counts suggests that luminous infrared galaxies, with LL1011 h L⊙, were common at z1. The range of dust attenuation values at UV wavelengths inferred for optically-selected z1 galaxies is comparable to those of local disk galaxies and UV–selected starbursts (Figure The Dust Opacity of Star-Forming Galaxies), although the distant galaxies tend to be more luminous (more active) on average. Larger samples with more extended wavelength coverage are needed before a more complete picture can be drawn in this redshift range.
The ISM of z3 galaxies has been observed to be metal-polluted to at least 0.1 Z⊙, implying that non-negligible amounts of dust must be present in the galaxy population at large by z=3 and, in many cases, earlier (Shapley et al., 2001). The observed properties of the z1 SCUBA sources and of the LBGs suggest that both objects are the high redshift analogs of local actively star-forming galaxies, where dust content and level of activity determines a continuum of characteristics. The SCUBA sources are at the high end of such continuum, with powerful activity, both thermal and non-thermal, and large dust contents that make them similar to local ULIRGs; more than 95% of their bolometric light is absorbed by dust. LBGs appear to span a larger range of the continuum of dust content and activity level, although they tend to have, on average, lower values than the SCUBA sources. Typical UV attenuations are A1–2 mag, corresponding to 35%–95% of the bolometric light being absorbed by dust.
Assuming the local infrared luminosity function can be applied to high redshift sources as well, the comoving number density of z3 SCUBA galaxies with 850 m flux densities brighter than 2 mJy and 0.5 mJy (corresponding to 21012 L⊙ and 51011 L⊙ for an Arp220-like SED) would be 410-4 h Mpc-3 and 10-2 h Mpc-3, respectively. High-redshift infrared galaxies as bright as Arp220 are almost 100 times less numerous than LBGs; for comparison, in the local Universe ULIRGs are more than 4 orders of magnitude less numerous than optically selected galaxies. At lower 850 m luminosities, z3 SCUBA sources are about as numerous as LBGs at the same redshift, but there could be large overlap between the two samples at the mJy level. LBGs are, in fact, predicted to occupy the faint end of the SCUBA 850 m source counts, with flux densities of a few mJy or less (Adelberger & Steidel, 2000). Thus, although SCUBA sources down to 0.5 mJy at all redshifts already account for 90% of the CIB, a non-negligible fraction of this, at least 25%, could be due to LBGs (Peacock et al., 2000; Adelberger & Steidel, 2000; van der Werf et al., 2001).
6 Intracluster and Intergalactic Dust
Intracluster and intergalactic dust are briefly discussed in view of their potential importance in the interpretation of the intermediate and high redshift Universe. The amount, nature, and sources of the dust in the intracluster (ICM) and intergalactic (IGM) media are still a controversial matter, despite the large number of independent researches tackling the issue.
The metallicity of the present-day ICM is fairly high, about 1/3–1/2 solar, implying that a non-negligible fraction of the gas in the ICM has been ejected from the cluster’s galaxies (Mushotzky et al., 1996; Mushotzky & Loewenstein, 1997; Voit & Donahue, 1997). The high metallicity is not automatically accompanied, however, by a high dust content of the ICM. The ICM hot gas effectively destroys dust through sputtering. The typical timescale for sputtering in a 107 K hot ambient gas is t106a/n, where tsput is measured in yrs, a is the size of the dust grain in m, and n is the density of the ICM in cm-3 (Draine & Salpeter, 1979; Dwek, Rephaeli & Mather, 1990). In the high-density cores of clusters (n10-3 cm-3), a 0.1 m dust grain survives a few times 108 yr, with smaller grains being destroyed on shorter timescales than the large grains (Dwek, Rephaeli & Mather, 1990). Small grains can survive only outside the cores of clusters, i.e., beyond the central Mpc. Dust needs to be constantly replenished in the ICM, and the likely sources are enriched winds from the cluster’s galaxies, intracluster stars, and, in dynamically young clusters, winds from infalling spiral galaxies (Dwek, Rephaeli & Mather, 1990; Popescu et al., 2000). The timescales for the dust injection in the ICM are of order 109 yr or longer, implying that the grain size distribution, and therefore the shape of the extinction curve, depends mainly on the sputtering efficiency at the selected cluster location (Dwek, Rephaeli & Mather, 1990).
Various direct and indirect methods have been employed to detect dust in the ICM. Deficits in background counts of galaxies, quasars, and clusters behind galaxy clusters of various richness have been interpreted as extinction in the range A0.2–0.5, with patches that can exceed A1 mag (Zwicky, 1957; Karachentsev & Lipovetskii, 1969; Bogart & Wagoner, 1973; Boyle, Fong & Shanks, 1988; Szalay, Hollósi & Tóth, 1989; Romani & Maoz, 1992). Conversely, reddening measurements of cluster members (Ferguson, 1993) or background galaxies (Maoz, 1995) give upper limits of A0.2 mag. The two methods thus give contradictory results and neither is completely bias-free: deficits in background counts can be due not only to dust, but also to confusion; low reddening values can be attributed to a gray extinction curve, greyer than a Milky-Way-like curve, because of the selective destruction of small grains in the ICM. Tentative infrared detections of ICM dust emission, using IRAS and ISO data (Wise et al., 1993; Stickel et al., 1998), are either at low significance level, or have been argued to be due to emission from cluster members (Quillen et al., 1999).
Presence of dust is well established in the centers of cooling flow clusters (see discussion in section 3.4), but the issue of its origin is still controversial. In particular, it is not clear whether this is an extended component, such as condensates from the cooled cluster gas or a by-product of star formation triggered by the cooling flow, (Hu et al., 1983; Hu, 1992; Fabian, Johnstone & Daines, 1994; Allen, 1995; Hansen, Jörgensen & Nörgaard-Nielsen, 1995; Crawford et al., 1999; Edge, 2001), or is directly associated with the central galaxy, possibly from a merging event that the galaxy underwent (Sparks, Macchetto & Golombek, 1989; Sparks, Ford & Kinney, 1993; Donahue et al., 2000). The Milky-Way-like form of the extinction curve in the central galaxies has been extensively used as an argument to support the galactic origin of the dust in cooling flow clusters; as remarked above, ICM-processed dust would tend to be depleted in small grains and therefore produce a gray extinction (Sparks, Macchetto & Golombek, 1989; Sparks, Ford & Kinney, 1993; Donahue et al., 2000). However, if soft X-ray absorption is present in the centers of the clusters, dust absorption in the cooling flow would appear to be the direct physical explanation (Voit & Donahue, 1995). The tentative detection of the neutral oxygen edge, and thus of dust, in the Perseus cluster (Arnaud & Mushotzky, 1998) and the widespread presence of CO emission in low-radio-emitting cooling flow clusters (Edge, 2001) are countered by XMM data that do not support the presence of large amounts of cool gas in the center of some of the clusters and, therefore, do not require a large amount of dust to explain the soft X-ray spectral shape (Tamura et al., 2001; Kaastra et al., 2001; Peterson et al., 2001).
At present times, the presence and nature of dust in the IGM is even more uncertain than that in the ICM, though it is widely accepted that the IGM is metal-enriched. Hydrodynamical CDM simulations identify the Ly forest as the IGM, i.e., modest baryon density fluctuations in a ionizing background (Cen et al., 1994; Petitjean, Muecket & Kates, 1995; Zhang, Anninos & Norman, 1995; Hernquist et al., 1996; Theuns et al., 1998). The Ly forest accounts for a significant fraction, 50%, of the baryons at z3 (Rauch et al., 1997); its metallicity at z2.5–3 is 0.2–1% Z⊙ down to column densities N(HI)1014.5 cm-2 (Tytler et al., 1995; Songaila & Cowie, 1996; Ellison et al., 1999), while metallicity values at lower column densities remain uncertain (Ellison et al., 2000). These values could be lower limits to the IGM metallicity, if there is a ‘missing metals’ problem as pointed out by Renzini (1999) and Pettini (1999) on the basis of the metals produced by star formation by z2.5. The metallicity of the Ly forest increases for decreasing redshift, being 10 times more metal rich at z0.5 than at z2.5–3 (Barlow & Tytler, 1998). In the local Universe, the Ly forest accounts for only 20% of the baryons (Penton, Shull & Stocke, 2000) and matter associated with galaxies and clusters for another 25%–30% (Fukugita, Hogan & Peebles, 1998; Cen & Ostriker, 1999); thus, 50% of the baryons at z=0, and possibly of the metals, are contained in a yet undetected phase of the IGM, proposed to be hot gas (Cen & Ostriker, 1999). Various mechanisms have been considered for the metal, and possibly dust, pollution of the IGM; they include supernova ejecta from galaxies and/or subgalactic structures, dynamical encounters between galaxies, ram-pressure stripping, and population III stars (Ostriker & Gnedin, 1996; Nath & Trentham, 1997; Gnedin, 1998; Ferrara, Pettini & Shchekinov, 2000; Cen & Bryan, 2001; Madau, Ferrara & Rees, 2001; Aguirre et al., 2001). The different mechanisms are non-exclusive, although each one could be dominant relative to the other at specific cosmological epochs.
Early attempts to detect diffuse dust in the IGM investigated the evolution of the mean quasar spectral index with redshift (Wright, 1981; Cheng, Gaskell & Koratkar, 1991), with the basic result that presence of IGM dust is negligible for Milky-Way-like extinction, up to at least z2 (Cheng, Gaskell & Koratkar, 1991). Milky-Way-like IGM dust should also leave an imprint on the Cosmic Microwave Background, as it would re-emit in the sub-mm/mm regime the absorbed background radiation (Rowan-Robinson, Negroponte & Silk, 1979; Wright, 1981; Bond, Carr & Hogan, 1991). The tight COBE upper limit to deviations from blackbody emission (Fixsen et al., 1996) limits the IGM dust to A0.3 mag to z=5, with negligible value to z=3 (Loeb & Haiman, 1997; Ferrara et al., 1999b). However, if sputtering is efficient in the hot IGM, dust has a greyer extinction than Milky-Way-like (Aguirre, 1999, for a challenge to the sputtering argument see Simonsen & Hannestad (1999)). Gray IGM dust can be present in larger quantities than Milky-Way-like dust without violating the COBE limits, but its emission would represent 75% of the CIB at 850 m (Aguirre & Haman, 2000). Source counts with SCUBA account already for 90% of the CIB (section 5.2), which challenges the case for large amounts of gray dust. So far, the strongest limits have come from observations of cosmological supernovae. For gray dust with minimum grain size 0.1 m, Aguirre (1999)’s model gives AB-A0.01 and AB-A0.2 for A0.2–0.3 to z=0.5; at z=2, A0.6–0.7 mag. Using observations of Type 1a supernovae at z0.5 and z1.7, Riess et al. (2000) and Riess et al. (2001) have placed a limit of A0.1–0.15 to the amount of diffuse, gray IGM dust to z=0.5. In summary, although the actual numbers are still not settled, IGM dust is likely to produce small attenuations at most redshifts.
7 Conclusions and Future Developments
Current observational data indicate that the population of local galaxies is characterized by modest values of the dust opacity. Typically, 50% or less of the total stellar energy is absorbed by dust. The same evidence points out that the definition of ‘modest opacity’ is wavelength-dependent; for example, in the UV, at 0.15 m, a non–active galaxy can lose up to 80% of its energy to dust. Luminous, intermediate–to–late type spirals are dustier than ellipticals, by 1.0–1.4 mag in the UV, and than irregulars, by 0.5–0.8 mag. Luminous galaxies are on average more metal–rich and dust–rich than their faint counterparts. Dust opacity also increases with thermal and non-thermal activity, with the high-end of the distribution given by the ULIRGs.
Although the wealth of data and wavelength coverage for local galaxies has started to uncover the dust opacity of these systems, we are still missing a few crucial pieces of the puzzle. The largest among these is the one-to-one relation between absorbed stellar SEDs and dust emission SEDs. At first order, hotter stars are expected to heat the dust to higher temperatures than cooler stars (Helou, 1986), but we don’t have yet the direct link between individual dust emission and heating components; we don’t know the dependence of the dust SED on parameters like metallicity, radiation field, gas density, galactic environment, etc.; and questions still surround the relation between radiation intensity and PAH emission, despite the progresses made with ISO (Cesarsky et al., 1996; Genzel & Cesarsky, 2000; Dale et al., 2001). The main reason for these limitations to our comprehension of the dust absorption–emission relationship is the large mismatch in angular resolution between UV-to-near–IR observations and current mid/far–infrared data. While observations probing the direct stellar light can easily reach sub-arcsecond resolution, existing data on dust emission are at the arcminute resolution level, especially at wavelengths above 40 m where the bulk of the energy from dust emerges. Upcoming infrared missions like SIRTF (the Space InfraRed Telescope Facility), SOFIA (the Stratospheric Observatory for Infrared Astronomy), and FIRST (now the Herschel Space Observatory) promise to bridge this gap. They will also push the wavelength coverage all the way to 600–700 m, thus probing the cold dust emission in local galaxies, which is the repository of most of the dust mass.
UV– and optical–selected, intermediate and high redshift, galaxy surveys carry the inherent limitation that physical parameters directly derived from the observations are affected by dust in a non-easily quantifiable way. This is further complicated by the fact that instrumental sensitivity limits favor detection of the luminous representatives of any galaxy class, that may tend to have relatively high dust content. Estimates of the SFRs in intermediate and high redshift galaxies using Balmer lines (Glazebrook et al., 1999; Yan et al., 1999; Moorwood et al., 2000) and infrared emission (Flores et al., 1999b; Blain et al., 1999d; Barger, Cowie & Richards, 2000) are generally a few times higher than the analogous estimates using the restframe UV emission (Lilly et al, 1996; Madau et al., 1996; Steidel et al., 1999). As discussed in section 5, presence of dust in galaxies at cosmological distances is reasonably established, but the quantification of its effects as a function of redshift is still an ongoing process. Linked to this is the puzzle of the nature of the UV–selected and IR–selected sources, and of their relationship: whether they represent overlapping populations, or the two ends of a continuum of properties possibly parametrized by activity and dust content is still an open question.
The absence of full characterization of the dust emission and absorption in distant galaxies is mostly due to the scant overlap between optically–selected and infrared–selected surveys. This is due to sensitivity limitations at both ends of the spectrum, to angular resolution limitations at long wavelengths, to the small number of objects in some of the samples, and to the sparse wavelength coverage of the dust emission SED by current sub-mm/radio instrumentation. SIRTF and FIRST initially, and then ALMA (the Atacama Large Millimeter Array) and NGST (the Next Generation Space Telescope) will be able to fill the gaps. In particular the last two instruments, with their sub-arcsecond resolution and high sensitivities, should mark a break-through in our understanding of the high redshift Universe and of its stellar, gas, and dust content up to z20.
Appendix A Adopted nomenclature for extinction and obscuration
The dimming effects of light are generally termed ‘extinction’ only in the simple geometrical case of a point source behind a dust screen (section 2.1), where the attenuation suffered by the source can be directly related to the optical depth of the dust screen. In this review, the extinction at wavelength is indicated as:
| (A1) |
(equation 2). The dimming of background galaxies due to the dust in a foreground galaxy can generally be considered extinction, because the foreground galaxy can be modeled in first approximation as a homogeneous screen in front of point sources (section 3.1).
For more general distributions of dust and emitters, the dimming and reddening of the light is no longer directly related to the extinction or the optical depth of the dust layer, and is called indiscriminately ‘effective extinction’, ‘obscuration’, or ‘attenuation’. The effective extinction Aλ is defined as:
| (A2) |
where mλ,o is the magnitude of the dust–free source and mλ,a is the measured (attenuated) magnitude; Aλ measures the magnitudes of attenuation suffered by an extended source at the specified wavelength/band. By definition, AA for a foreground, homogeneous, non-scattering dust screen.
For dust/emitter distributions that do not have spherical symmetry, such as spiral galaxies, the face-on effective extinction is termed Aλ,f, while Aλ indicates the effective extinction averaged over all inclinations.
Appendix B The definition of the UV spectral slope
Throughout this review, two different definitions of the UV spectral slope, and have been used. In this context, the spectral slope is derived from the fit f() within a specified wavelength range, with f() the flux density of the source. The various definitions reflect historical reasons driven mostly by observational constraints.
The default adopted in this review (section 2.2) is measured between 0.125 m and 0.30m, using a set of wavelength windows that avoid the strong stellar and interstellar absorption features. An example of such windows is given in Calzetti, Kinney & Storchi-Bergmann (1994), although the ones used to derive here are better tuned for use with model spectra rather than with observed spectra, and extend all the way to 0.3 m. This definition of has been adopted to ensure an appropriate comparison between different extinction curves and dust models, as in Figures The Dust Opacity of Star-Forming Galaxies and The Dust Opacity of Star-Forming Galaxies, because the fitting windows are selected to avoid the strong and wide dust feature at 0.2175 m.
The UV slope used in section 4 is a fit through the 10 windows of Calzetti, Kinney & Storchi-Bergmann (1994), and corresponds to deriving the slope in the wavelength range 0.125–0.26 m, using spectral regions mostly devoid of strong absorption lines. This definition of the UV slope is observation-driven, as it was used to obtain measurements from IUE spectra of a local UV-selected starburst sample. The wavelength range is bluer than that of above, and was chosen by Calzetti, Kinney & Storchi-Bergmann (1994) to avoid including in the fits the older stellar populations underlying the starbursts. These older populations can contribute to the spectra starting around 0.27–0.28 m, when the fluxes of F-stars become non-negligible. For reference, a list of values for dust-free stellar populations, both for instantanous burst and for constant star formation, is given in Table 6.
An convenient definition of the UV-slope for studies of high-redshift galaxies is , measured roughly between 0.12 m and 0.18m. At z3, the optical window give information shortward of 0.2 m, thus forcing the UV slope fitting to a much shorter range than possible with local galaxies. The details of the actual wavelength range vary with redshift and with the observing technique (whether spectroscopy or imaging, and depending on the filters used).
The relation between the three quantities, as given by models of stellar populations reddened by the starburst obscuration curve of section 4, is:
| (B1) |
| (B2) |
The error bar following each coefficient refers to the maximum variance observed by varying a number of parameters in the models and fits: (a) stellar populations from both Leitherer et al. (1999) and Bruzual & Charlot (2001) models; (b) stellar populations with constant star formation in the range 5–1000 Myr, and instantaneous bursts in the age range 5–12 Myr; (c) both 0.2 Z⊙ and Z⊙ metallicities; (d) fitting windows that progressively include or exclude weak absorption lines in the spectra. The latter turns out to be the main driver of the variance, while changes in the characteristics of the stellar populations have only a small impact. The relations between the three slopes would, however, change from equations (B1)–(B2) if more extreme cases of stellar population mix, such as the addition of an old (age1 Gyr) component, were considered; in this case, and would be strongly affected, because of the long wavelength baseline.
Of interest for high-redshift studies is the consideration that while and follow each other closely, is always redder (more positive) than the other two, and the discrepancy increases for increasing value of the slopes. The reason for this counter-intuitive behavior is the presence of the well-known ‘iron curtain’ at long UV wavelengths: this is a wide dip in the 0.23–0.28 m range of the UV spectra due to the presence of a large number of closely spaced Fe absorption lines (Leitherer et al., 1999). The UV slopes fitted with the longer wavelength baseline have windows in this continuum-depressed region, hence their more negative values. Increasing dust obscuration affects the short-wavelength slope more than the long-wavelength ones; hence the trend for to become progressively redder than as their values increase (i.e., as the UV spectra become more dust reddened).
Meurer et al. (1999) derive an empirical relation between and a short-wavelength UV slope (close, but not identical, to ) from IUE spectra of the UV-selected starbursts. Their findings, that =0.16, are consistent with the long wavelength slope being bluer than the short wavelength one. However, they do not measure an increasingly redder for increasing values of both slopes. A possible reason is that noise in the IUE data may have prevented the detection of such effect. In this review, it is assumed that equations (B1)–(B2) are valid for UV-selected starbursts.
References
- Adelberger & Steidel (2000) Adelberger, K.L., & Steidel, C.C., 2000, ApJ, 544, 218
- Adelberger et al. (1998) Adelberger, K.L., Steidel, C.C., Giavalisco, M., Dickinson, M.E., Pettini, M., & Kellogg, M. 1998, ApJ, 505, 18
- Aguirre (1999) Aguirre, A. 1999, ApJ, 525, 583
- Aguirre & Haman (2000) Aguirre, A., & Haman, Z. 2000, ApJ, 532, 28
- Aguirre et al. (2001) Aguirre, A., Hernquist, L., Schaye, J., Katz, N., Weinberg, D.H., & Gardner, J. 2001, ApJ, accepted (astroph/0105065)
- Allen (1995) Allen, S.W. 1995, MNRAS, 276, 947
- Aloisi, Tosi & Greggio (1999) Aloisi, A., Tosi, M., & Greggio, L. 1999, AJ, 118, 302
- Alonso-Herrero et al. (2001) Alonso-Herrero, A., Engelbracht, C.W., Rieke, M.J., Rieke, G.H., & Quillen, A.C. 2001, ApJ, 546, 952
- Altieri et al. (1999) Altieri, B, Metcalfe, L., Kneib, J.P., McBreen, B., Aussel, H. et al. 1999, A&A, 343, L65
- Alton et al. (1998) Alton, P.B., Trewhella, M., Davies, J.I., Evans, R., Bianchi, S., Gear, W., Thronson, H.A., Valentijn, E., & Witt, A.N., 1998, A&A, 335, 807
- Arimoto, Sofue & Tsojimoto (1996) Arimoto, N., Sofue, Y., & Tsojimoto, T. 1996, PASJ, 48, 275
- Arnaud & Mushotzky (1998) Arnaud, K.A., & Mushotzky, R.F. 1998, ApJ, 501, 119
- Aussel et al. (1999) Aussel, H., Cesarsky, C.J., Elbaz, D., & Starck, J.L. 1999, A&A, 342, 313
- Baker et al. (2001) Baker, A.J., Lutz, D., Genzel, R., Tacconi, L.J., & Lehnert, M.D. 2001, A&A, in press (astroph/0104345)
- Barger et al. (2001) Barger, A.J., Cowie, L.L., Mushotzky, R.F., & Richards, E.A. 2001, AJ, 121, 662
- Barger, Cowie & Richards (2000) Barger, A.J., Cowie, L.L., & Richards, E.A., 2000, AJ, 119, 2092
- Barger, Cowie & Sanders (1999a) Barger, A.J., Cowie, L.L., & Sanders, D.B. 1999a, ApJ, 518, L5
- Barger et al. (1998) Barger, A.J., Cowie, L.L., Sanders, D.B., Fulton, E., Taniguchi, Y., Sato, Y., Kawara, K., & Okuda, H. 1998, Nature, 294, 248
- Barger et al. (1999b) Barger, A.J., Cowie, L.L., Smail, I., Ivison, R.J., Blain, A.W., & Kneib, J.-P. 1999b, AJ, 117, 2656
- Barlow & Tytler (1998) Barlow, T.A., & Tytler, D. 1998, AJ, 115, 1725
- Baugh et al. (1998) Baugh, C.M., Cole, S., Frenk, C.S., & Lacey, C.G. 1998, ApJ, 498, 504
- Beck et al. (1996) Beck, S.C., Turner, J.L., Ho, P.T., Lacy, J.H., & Kelly, D.M. 1996, ApJ, 457, 610
- Beckman et al. (1996) Beckman, J.E., Peletier, R.F., Knapen, J.H., Corradi, R.L.M., & Gentet, L.J. 1996, ApJ, 467, 175
- Bell (2001) Bell, E.F. 2001, private communication
- Bell et al. (2001) Bell, E.F., Gordon, K.D., Kennicutt, R.C. Jr., & Zaritsky D. 2001, in prep.
- Bell & Kennicutt (2001) Bell, E.F., & Kennicutt, R.C. Jr. 2001, ApJ, in press (astroph/0010340)
- Berlind et al. (1997) Berlind, A.A., Quillen, A.C., Pogge, R.W., & Sellgren, K. 1997, AJ, 114, 107
- Bianchi et al. (1996) Bianchi, L., Clayton, G.C., Bohlin, R.C., Hutchings, J.B., & Massey, P. 1996, ApJ, 471, 203
- Bianchi et al. (2000) Bianchi, S., Ferrara, A., Davies, J.I., & Alton, P.B. 2000, MNRAS, 311, 601
- Blain et al. (1999a) Blain, A.W., Ivison, R.J., Kneib, J.-P., & Smail, I. 1999a, in The Hy-Redshift Universe, ed. A.J. Bunker & W.J.M. van Breugel, ASP Conf. Ser. 193 (ASP: San Francisco), 246
- Blain et al. (1999b) Blain, A.W., Jameson, A., Smail, I., Longair, M.S., Kneib, J.-P., & Ivison, R.J. 1999b, MNRAS, 309, 715
- Blain et al. (1999c) Blain, A.W., Kneib, J.-P., Ivison, R.J., & Smail, I. 1999c, ApJ, 512, L87
- Blain et al. (1999d) Blain, A.W., Smail, I., Ivison, R.J., & Kneib, J.-P. 1999d, MNRAS, 302, 632
- Block & Greenberg (1996) Block, D.L., & Greenberg, J.M. 1996, New Extragalactic Perspectives in the New South Africa (Dordrecht: KAP)
- Block et al. (1994) Block, D.L., Witt, A.N., Grosbol, P., Stockton, A., & Moneti, A. 1994, A&A, 288, 383
- Bogart & Wagoner (1973) Bogart, R., & Wagoner, R. 1973, ApJ, 181, 609
- Boissé et al. (1998) Boissé, P., Le Brun, V., Bergeron, J., & Deharveng, J.-M. 1998, A&A, 333, 841
- Bond, Carr & Hogan (1991) Bond, J.R., Carr, B.J., & Hogan, C.J. 1991, ApJ, 367, 420
- Boselli et al. (1998) Boselli, A., Lequeux, J., Sauvage, M., Boulade, O., Boulanger, F., et al. 1998, A&A, 335, 53
- Bosma et al. (1992) Bosma, A., Byun, Y., Freeman, K.C., & Athanassoula, E. 1992, ApJ, 400, L21
- Bouchet et al (1985) Bouchet, P., Lequeux, J., Maurice, E., Prevot, L., & Prevot-Burnichon, M.L. 1985, A&A, 149, 330
- Boulanger et al. (1988) Boulanger, F., Beichman, C., Désert, F.X., Helou, G., Pérault, M., & Ryter, C. 1988, ApJ, 332, 328
- Boyle, Fong & Shanks (1988) Boyle, B.J., Fong, R., & Shanks, T. 1988, MNRAS, 231, 897
- Bregman et al. (1998) Bregman, J.N., Snider, B.A., Grego, L., & Cox, C.V. 1998, ApJ, 499, 670
- Brodie & Huchra (1991) Brodie, J.P., & Huchra, J.P.1991, ApJ, 379, 157
- Bruzual & Charlot (2001) Bruzual, G., & Charlot, S. 2001, in preparation
- Bruzual, Magris & Calvet (1988) Bruzual, G.A., Magris, G.C., & Calvet, N. 1988, ApJ, 333, 673
- Buat & Burgarella (1998) Buat, V., & Burgarella, D. 1998, A&A, 334, 772
- Buat & Xu (1996) Buat, V., & Xu, C. 1996, A&A, 306, 61
- Bunker (1999) Bunker, A.J. 1999, in Photometric Redshifts and High Redshift Galaxies, Conf. Ser. 191, eds. R.J. Weymann, L.J. Storrie-Lombardi, M. Sawicki, & R.J. Brunner (San Francisco: ASP), 317
- Burgh (2001) Burgh, E.B. 2001, PhD Thesis (The Johns Hopkins University, U.S.A.)
- Burstein, Haynes & Faber (1991) Burstein, D., Haynes, M.P., & Faber, S.M. 1991, Nature, 353, 515
- Byun (1993) Byun, Y.I. 1993, PASP, 105, 993
- Byun, Freeman & Kylafis (1994) Byun, Y.I., Freeman, K.C., & Kylafis, N.D. 1994, ApJ, 432, 114
- Calzetti (1997a) Calzetti, D., 1997a, AJ, 113, 162
- Calzetti (1997b) Calzetti, D. 1997b, in The Ultaviolet Universe at Low and High Redshift, eds. W.H. Waller, M.N. Fanelli, J.E. Hollis, & A.C. Danks, AIP Conf. Proc. 408 (AIP: Woodbury), 403
- Calzetti et al. (2000) Calzetti, D., Armus, L., Bohlin, R.C., Kinney, A.L., Koornneef, J. & Storchi-Bergmann, T. 2000, ApJ, 533, 682
- Calzetti et al. (1995a) Calzetti, D., Bohlin, R.C., Gordon, K.D., Witt, A.N., & Bianchi, L. 1995a, ApJ, 446, L97
- Calzetti et al. (1995b) Calzetti, D., Bohlin, R.C., Kinney, A.L., Storchi-Bergmann, T., & Heckman, T.M. 1995b, ApJ, 443, 136
- Calzetti et al. (1999) Calzetti, D., Conselice, C.J., Gallagher, J.S., & Kinney, A.L. 1999, AJ, 118, 797
- Calzetti & Heckman (1999) Calzetti, D., & Heckman, T.M. 1999, ApJ, 519, 27
- Calzetti, Kinney & Storchi-Bergmann (1994) Calzetti, D., Kinney, A.L., & Storchi-Bergmann, T. 1994, ApJ, 429, 582
- Calzetti, Kinney & Storchi-Bergmann (1996) Calzetti, D., Kinney, A.L., & Storchi-Bergmann, T. 1996, ApJ, 458, 132
- Calzetti et al. (1997) Calzetti, D., Meurer, G.R., Bohlin, R.C., Garnett, D.R., Kinney, A.L., Leitherer, C., & Storchi-Bergmann, T. 1997, AJ, 114, 1834
- Caplan & Deharveng (1986) Caplan, J., & Deharveng, L. 1986, A&A, 155, 297
- Cardelli, Clayton & Mathis (1989) Cardelli, J.A., Clayton, G.C., & Mathis, J.S. 1989, ApJ, 345, 245
- Carilli & Yun (1999) Carilli, C.L., & Yun, M.S. 1999, ApJ, 513, L13
- Carollo et al. (1997) Carollo, C.M., Franx, M., Illingworth, G.D., & Forbes, D.A. 1997, ApJ, 481, 710
- Cen & Bryan (2001) Cen, R., & Bryan, G.L. 2001, ApJ, 546, L81
- Cen et al. (1994) Cen, R., Miralda-Escudé, J., Ostriker, J.P., & Rauch, M. 1994, ApJ, 437, L9
- Cen & Ostriker (1999) Cen, R., & Ostriker, J.P. 1999, ApJ, 514, 1
- Cesarsky et al. (1996) Cesarsky, D., Lequeux, J., Abergel, A., Perault, M., Palazzi, E., & Tran, D. 1996, A&A, 315, L305
- Chandrasekhar (1960) Chandrasekhar, S. 1960, Radiative Trnasfer, New York: Dover
- Chapman et al. (2001) Chapman, S.C., Richards, E.A., Lewis, G.F., Wilson, G., & Barger, A.J. 2001, ApJ, 548, L147
- Chapman et al. (2000) Chapman, S.C., Scott, D., Steidel, C.C., Borys, C., Halpern, M., et al. 2000, MNRAS, 319, 318
- Charlot & Fall (2000) Charlot, S., & Fall, S.M. 2000, ApJ, 539, 718
- Charlot & Longhetti (2001) Charlot, S., & Longhetti, M. 2001, MNRAS, in press (astroph/0101097)
- Chary & Elbaz (2001) Chary, R., & Elbaz, D. 2001, ApJ, in press (astroph/0103067)
- Cheng, Gaskell & Koratkar (1991) Cheng, F.H., Gaskell, C.M., & Koratkar, A.P. 1991, ApJ, 370, 487
- Chini, Krügel & Kreysa (1986) Chini, R., Krügel, E., & Kreysa, E. 1986, A&A, 167, 315
- Choloniewski (1991) Choloniewski, J. 1991, MNRAS, 250, 486
- Clements, Desert & Franceschini (2001) Clements, D.L., Désert, F.-X., & Franceschini, A. 2001, MNRAS, in press (astroph/0103242)
- Clements et al. (1999) Clements, D.L., Désert, F.-X., Franceschini, A., Reach, W.T., Baker, A.C., Davies, J.K., & Cesarsky, C. 1999, A&A, 346, 383
- Clements et al. (1996) Clements, D.L., Sutherland, W.J., Saunders, W., Efstathiou, G.P., McMahon, R.G. et al. 1996, MNRAS, 279, 459
- Corradi, Beckman & Simonneau (1996) Corradi, R.L.M., Beckman, J.E., & Simonneau, E. 1996, MNRAS, 282, 1005
- Cowie, Songaila & Barger (1999) Cowie, L.L, Songaila, A., & Barger, A.J. 1999, AJ, 118, 603
- Cox, Bregman & Schombert (1995) Cox, C.V., Bregman, J.N., & Schombert, J.M. 1995, ApJS, 99, 405
- Cox & Kessler (1999) Cox, P., & Kessler, M.F. 1999, The Universe as Seen by ISO (Noordwijk: ESA Publications Division)
- Cox, Krügel & Mezger (1986) Cox, P., Krügel, E., & Mezger, P.G. 1986, A&A, 155, 380
- Crawford et al. (1999) Crawford, C.S., Allen, S.W., Ebeling, H., Edge, A.C., & Fabian, A.C. 1999, MNRAS, 306, 857
- Dale et al. (2001) Dale, D.A., Helou, G., Contursi, A., Silbermann, N.A., & Kolhatkar, S. 2001, ApJ, 549, 215
- Davies et al. (1999) Davies, J.I., Alton, P.B., Trewhella, M., Evans, R., & Bianchi, S. 1999, MNRAS, 304, 495
- Davies & Burstein (1995) Davies, J.L., & Burstein, D. 1995, The Opacity of Spiral Disks (Dordrecht: KAP)
- Davies et al. (1993) Davies, J.I., Phillips, S., Booyce, P.J., & Disney, M.J. 1993, MNRAS, 260, 491
- Désert, Boulanger & Puget (1990) Désert, F.-X., Boulanger, F., & Puget, J.L. 1990, A&A, 237, 215
- de Jong et al. (1984) de Jong, T., Clegg, P.E., Soifer, B.T., Rowan-Robinson, M., Habing, H.J., Houck, J.R., Aumann, H.H., & Raimond, E. 1984, ApJ, 278, L67
- de Vaucouleurs (1959a) de Vaucouleurs, G. 1959a, AJ, 64, 397
- de Vaucouleurs (1959b) de Vaucouleurs, G. 1959b, Handb der Physik, 53, 311
- Devereux & Young (1991) Devereux, N.A., & Young, J.S. 1991, ApJ, 371, 515
- Di Bartolomeo, Barbaro & Perinotto (1995) Di Bartolomeo, A., Barbaro, G., & Perinotto, M. 1995, MNRAS, 277, 1279
- De Young & Heckman (1994) De Young, D.S., & Heckman, T.M. 1994, ApJ, 431, 598
- Dickinson (1998) Dickinson, M.E. 1998, in The Hubble Deep Field, STScI May Symposium, eds. M. Livio, S.M. Fall & P. Madau (Cambridge:CUP), 219
- Dickinson (2000) Dickinson, M.E. 2000, Phil. Trans. Royal Soc. Lond. A, 358, 2001
- Disney, Davies & Phillips (1989) Disney, M., Davies, J., & Phillips, S. 1989, MNRAS, 239, 939
- Dole et al. (2001) Dole, H., Gispert, R., Lagache, G., Puget, J.-L., Bouchet, F.R., et al. 2001, A&A, in press (astroph/0103434)
- Domingue et al. (1999) Domingue, D.L., Keel, W.C., Ryder, S.D., White, R.E. 1999, AJ, 118, 1542
- Donahue et al. (2000) Donahue, M., Mack, J., Voit, G.M., Sparks, W., Elston, R., & Maloney, P.R. 2000, ApJ, 545, 670
- Draine & Anderson (1985) Draine, B.T., & Anderson, N. 1985, ApJ, 292, 494
- Draine & Lee (1984) Draine, B.T., & Lee, H.M. 1984, ApJ, 285, 89
- Draine & Salpeter (1979) Draine, B.T., & Salpeter, E.E. 1979, ApJ, 231, 77
- Duley et al. (1989) Duley, W.W., Jones, A.P., & Williams, D.A. 1989, MNRAS, 236, 709
- Dunne et al. (2000) Dunne, L., Eales, S., Edmunds, M., Ivison, R., Alexander, P., & Clements, D.L., 2000, MNRAS, 315, 115
- Dunne & Eales (2001) Dunne, L., & Eales, S.A. 2001, MNRAS, in press (astroph/0106362)
- Dutra et al. (2001) Dutra, C.M., Bica, E., Clariá, J.J., Piatti, A.E., & Ahumada, A.V. 2001, A&A, in press (astroph/0103518)
- Dwek, Rephaeli & Mather (1990) Dwek, E., Rephaeli, Y., & Mather, J.C. 1990, ApJ, 350, 104
- Eales et al. (1999) Eales, S.A., Lilly, S., Gear, W., Dunne, L., Bond, J.R., Hammer, F., Le Fevre, O., & Crampton, D. 1999, ApJ, 515, 518
- Eales et al. (2000) Eales, S.A., Lilly, S., Webb, T., Dunne, L., Gear, W., Clements, D., & Yun, M. 2000, AJ, 120, 2244
- Ebneter & Balick (1985) Ebneter, K., & Balick, B. 1985, AJ, 90, 183
- Ebneter, Djorgovski & Davis (1988) Ebneter, K., Djorgovski, S., & Davis, M. 1988, AJ, 95, 422
- Edge et al. (1999) Edge, A.C., Ivison, R.J., Smail, I., Blain, A.W., & Kneib, J.-P. 1999, MNRAS, 306, 599
- Edge (2001) Edge, A.C., 2001, MNRAS, in press (astroph/0106225)
- Edmunds & Phillips (1997) Edmunds, M.G., & Phillips, S., 1997, MNRAS, 292, 733
- Efstathiou et al. (2000) Efstathiou, A., Oliver, S., Rowan-Robinson, M., Surace, C., Summer, T., et al. 2000, MNRAS, 319, 1169
- Efstathiou, Rowan-Robinson & Siebenmorgen (2000) Efstathiou, A., Rowan-Robinson, M., & Siebenmorgen, R. 2000, MNRAS, 313, 734
- Elbaz (1999) Elbaz, D. 1999, in Building Galaxies: From the Primordial Universe to the Present, eds. F. Hammer, Thuan, T.X., Cayatte, V., Guiderdoni, B., & J. Tran Thanh Van (Singapore: World Scientific Publishing), 195
- Elbaz et al. (1999) Elbaz, D., Cesarsky, C.J., Fadda, D., Aussel, H., Désert, F.X., et al. 1999, A&A, 351, L37
- Ellingson et al. (1996) Ellingson, E., Yee, H.K.C., Bechtold, J., & Elston, R. 1996, ApJ, 466, L71
- Ellison et al. (1999) Ellison, S.L., Lewis, G.F., Pettini, M., Chaffee, F.H., & Irwin, M.J. 1999, ApJ, 520, 456
- Ellison et al. (2000) Ellison, S.L., Songaila, A., Schaye, J., & Pettini, M. 2000, AJ, 120, 1175
- Ellison et al. (2001) Ellison, S.L., Yan, L., Hook, I.M., Pettini, M., Wall, J.V., & Schaver, P. 2001, A&A, submitted
- Elmegreen (1980) Elmegreen, D.M. 1980, ApJS, 43, 37
- Emsellem (1995) Emsellem, E. 1995, A&A, 303, 673
- Fabian, Johnstone & Daines (1994) Fabian, A.C., Johnstone, R.M., & Daines, S.J. 1994, MNRAS, 271, 737
- Fabian et al. (2000) Fabian, A.C., Smail, I., Iwasaka, K., Allen, S.W., Blain, A.W., Crawford, C.S., Ettori, S., Ivison, R.J., Johnstone, R.M., Kneib, J.-P., & Wilman, R.J. 2000, MNRAS, 315, L8
- Fanelli, O’Connell & Thuan (1988) Fanelli, M.N., O’Connell, R.W., & Thuan, T.X. 1988, ApJ, 334, 665
- Fall & Pei (1993) Fall, S.M., & Pei, Y.C. 1993, ApJ, 402, 479
- Fall, Pei & McMahon (1989) Fall, S.M., Pei, Y.C., & McMahon, R.G. 1989, ApJ, 341, L5
- Ferguson (1993) Ferguson, H.C. 1993, MNRAS, 263, 343
- Ferguson, Gallagher & Wyse (1998) Ferguson, A.M.N., Gallagher, J.S., & Wyse, R.F.G. 1998, AJ, 116, 673
- Ferrara et al. (1999a) Ferrara, A., Bianchi, S., Cimatti, A., & Giovanardi, C. 1999a, ApJS, 123, 437
- Ferrara et al. (1999b) Ferrara, A., Nath, B., Sethi, S.K., Shchekinov, Y. 1999b, MNRAS, 303, 301
- Ferrara, Pettini & Shchekinov (2000) Ferrara, A., Pettini, M., & Shchekinov, Y. 2000, MNRAS, 319, 539
- Ferrara & Tolstoy (2000) Ferrara, A., & Tolstoy, E. 2000, MNRAS, 313, 291
- Fitzpatrick (1986) Fitzpatrick, E.L. 1986, AJ, 92, 1068
- Fitzpatrick (1999) Fitzpatrick, E.L. 1999, PASP, 111, 63
- Fixsen et al. (1996) Fixsen, D.J., Cheng, E.S., Gales, J.M., Mather, J.C., Shafer, R.A., & Wright, E.L. 1996, ApJ, 473, 576
- Fixsen et al. (1998) Fixsen, D.J., Dwek, E., Mather, J.C., Bennett, C.L., & Shafer, R.A. 1998, ApJ, 508, 123
- Flores et al. (1999a) Flores, H., Hammer, F., Désert, F.X., Cesarsky, C.J., Thuan, T., et al. 1999a, A&A, 343, 389
- Flores et al. (1999b) Flores, H., Hammer, F., Thuan, T.X., Cesarsky, C.J., Désert, F.X., et al. 1999b, ApJ, 517, 148
- Forbes, Franx, & Illingworth (1997) Forbes, D.A., Franx, M., & Illingworth, G.D. 1995, AJ, 109, 1988
- Förster Schreiber et al. (2001) Förster Schreiber, N.M., Genzel, R., Lutz, D., Kunze, D., & Sternberg, A. 2001, ApJ, 552, 544
- Fox et al. (2001) Fox, M.J., Efstathiou, A., Rowan-Robinson, M., Dunlop, J.S., Scott, S. et al. 2001, MNRAS, submitted (astroph/0107585)
- Franceschini et al. (1994) Franceschini, A., Mazzei, P., deZotti, G., & Danese, L. 1994, ApJ, 427, 140
- Friedli & Benz (1995) Friedli, D., & Benz, W. 1995, A&A, 301, 649
- Fukugita, Hogan & Peebles (1998) Fukugita, M., Hogan, C.J., & Peebles, P.J.E. 1998, ApJ, 503, 518
- Furton, Laiho & Witt (1999) Furton, D.G., Laiho, J.W., & Witt, A.N. 1999, ApJ, 526, 752
- Gasda & Leitherer (1996) Gasda, S., & Leitherer, C. 1996, in From Stars to Galaxies: The Impact of Stellar Physics on Galaxy Evolution, eds. C. Leitherer, U. Fritze-von Alvensleben & J. Huchra, ASP Conf. Ser. 98 (ASP: San Francisco), 451
- Ge, Bechtold & Kulkarni (2001) Ge, J., Bechtold, J., & Kulkarni, V.P. 2001, ApJ, 547, L1
- Genzel & Cesarsky (2000) Genzel, R., & Cesarsky, C.J. 2000, ARA&A, in press
- Genzel et al. (1998) Genzel, R., Lutz, D., Sturm, E., Egami, E., Kunze, D., Moorwood, A.F.M., Rigopoulou, D., Spoon, H.W.W., Sternberg, A., Tacconi-Garman, L.E., Tacconi, L., & Thatte, N. 1998, ApJ, 498, 579
- Giavalisco et al. (1996a) Giavalisco, M., Livio, M., Bohlin, R.C., Macchetto, F.D., & Stecher, T.P. 1996a, AJ, 112, 369
- Giavalisco et al. (1998) Giavalisco, M., Steidel, C.C., Adelberger, K.L., Dickinson, M.E., Pettini, M., & Kellogg, M. 1998, ApJ, 503, 543
- Giavalisco, Steidel & Macchetto (1996b) Giavalisco, M., Steidel, C.C., & Macchetto, F.D., 1996b, ApJ, 470, 189
- Giovanelli et al. (1994) Giovanelli, R., Haynes, M.P., Salzer, J.J., Wegner, G., da Costa, L.N., & Freudling, W. 1994, AJ, 107, 2036
- Giovanelli et al. (1995) Giovanelli, R., Haynes, M.P., Salzer, J.J., Wegner, G., da Costa, L.N., & Freudling, W. 1995, AJ, 110, 1059
- Glazebrook et al. (1999) Glazebrook, K., Blake, C., Economou, F., Lilly, S., & Colless, M. 1999, MNRAS, 306, 843
- Gnedin (1998) Gnedin, N.Y. 1998, MNRAS, 294, 407
- Goad & Roberts (1981) Goad, J.W., & Roberts, M.S. 1981, ApJ, 250, 79
- Goldader et al. (2001) Goldader, J.D., Meurer, G.R., Heckman, T.M., Seibert, M., Sanders, D., Calzetti, D., & Steidel, C.C. 2001, in prep.
- González et al. (1998) González, R.A., Allen, R.J., Dirsch, B., Ferguson, H.C., Calzetti, D., & Panagia, N. 1998, ApJ, 506, 152
- Gonzalez Delgado et al. (1998) Gozalez Delgado, R.M., Leitherer, C., Heckman, T.M., Lowenthal, J.D., Ferguson, H.C., & Robert, C. 1998, ApJ, 495, 698
- Gordon, Calzetti & Witt (1997) Gordon, K.D., Calzetti, D., & Witt, A.N. 1997, ApJ, 487, 625
- Gordon & Clayton (1998) Gordon, K.D., & Clayton, G.C. 1998, ApJ, 500, 816
- Gordon et al. (2000) Gordon, K.D., Clayton, G.C., Witt, A.N., & Misselt, K.A. 2000, ApJ, 533, 236
- Gordon et al. (2001) Gordon, K.D., Misselt, K.A., Witt, A.N., & Clayton, G.C. 2001, ApJ, in press (astroph/0011575)
- Goudfrooij et al. (1994) Goudfrooij, P., Hansen, L., Jorgensen, H.E., & Norgaard-Nielsen, H.U. 1994, A&AS, 105, 341
- Goudfrooij & de Jong (1995) Goudfrooij, P., & de Jong, T. 1995, A&A, 298,784
- Granato et al. (2000) Granato, G.L., Lacey, C.G., Silva, L., Bressan, A., Baugh, C.M., Cole, S., & Frenk, C.S. 2000, ApJ, 542, 710
- Greenberg (1984) Greenberg, J.M. 1984, Sci. Am., 250, no. 6, 124
- Greenberg (1989) Greenberg, J.M. 1989, in Interstellar Dust, IAU Symp. no. 135, eds. L.J. Allamandola & A.G.G.M. Tielens (Dordrecht: KAP), 239
- Greenberg et al. (2000) Greenberg, J.M., Gillette, J.S., Munõz Caro, G.M., Mahajan, T.B., Zare, R.N., et al. 2000, ApJ, 531, L71
- Greggio et al. (1998) Greggio, L., Tosi, M., Clampin, M., De Marchi, G., Leitherer, C., Nota, A., & Sirianni, M. 1998, ApJ, 504, 725
- Guhathakurta, Tyson & Majewski (1990) Guhathakurta, P., Tyson, J.A., & Majewski, S.R. 1990, ApJ, 357, L9
- Guiderdoni et al. (1998) Guiderdoni, B., Hivon, E., Bouchet, F.R., & Maffei, B. 1998, MNRAS, 295, 877
- Haas (1998) Haas, M. 1998, A&A, 337, L1
- Hansen, Jörgensen & Nörgaard-Nielsen (1995) Hansen, L., Jörgensen, H.E., & Nörgaard-Nielsen, H.U. 1995, A&A, 297, 13
- Hauser et al. (1998) Hauser, M.G., Arendt, R.G., Kelsall, T., Dwek, E., Odegard, N., et al. 1998, ApJ, 508, 25
- Hauser & Dwek (2001) Hauser, M.G., & Dwek, E. 2001, ARA&A, in press.
- Heckman (1994) Heckman, T.M. 1994, in Mass-Transfer-Induced Activity in Galaxies, ed. I. Shloshman (Cambridge: CUP), 234
- Heckman (1998) Heckman, T.M., in Origins, eds. C.E. Woodward, J.M. Shull, & H.A. Thronson (San Francisco: ASP Conf. Series) 148, 127
- Heckman, Armus & Miley (1990) Heckman, T.M., Armus, L., & Miley, G.K. 1990, ApJS, 74, 833
- Heckman et al. (1989) Heckman, T.M., Baum, S.A., Van Breugel, W.J.M., & McCarthy, P. 1989, ApJ, 338, 48
- Heckman & Leitherer (1997) Heckman, T.M., & Leitherer, C. 1997, AJ, 114, 69
- Heckman et al. (2000) Heckman, T.M., Lehnert, M.D., Strickland, D.K., & Armus, L. 2000, ApJS, 129, 493
- Heckman et al. (1998) Heckman, T.M., Robert, C., Leitherer, C., Garnett, D.R., & van der Rydt, F. 1998, ApJ, 503, 646
- Helou (1986) Helou, G. 1986, ApJ, 311, L33
- Helou et al. (1988) Helou, G., Khan, I.R., Malek, L., & Boehmer, L. 1988, ApJS, 68, 151
- Henyey & Greenstein (1941) Henyey, L.G., & Greenstein, J.L. 1941, ApJ, 93, 70
- Hernquist et al. (1996) Hernquist, L., Katz, N., Weinberg, D.H., & Miralda-Escudé, J. 1996, ApJ, 457, L51
- Hibbard (1997) Hibbard, J.E. 1997, in Star Formation Near and Far, the 7th Annual Astrophysics Conference in Maryland, eds. S.S. Holt & L.G. Mundy (Woodbury: AIP) 393, 259
- Holmberg (1958) Holmberg, E. 1958, Medd. Lunds Astr. Obs. Ser. II, No. 136
- Hornschemeier et al. (2000) Hornschemeier, A.E., Brandt, W.N., Garmire, G.P., Schneider, D.P., Broos, P.S., Townsley, L.K., Bautz, M.W., Burrows, D.N., Chartas, G., Feigelson, E.D., Griffith, R., Lumb, D., Nousek, J.A., & Sargent, W.L.W. 2000, ApJ, 541, 49
- Hopkins et al. (2001) Hopkins, A.M., Connolly, A.J., Haarsma, D.B., & Cram, L.E. 2001, AJ, in press (astroph/0103253)
- Hu (1992) Hu, E.M. 1992, ApJ, 391, 608
- Hu et al. (1983) Hu, E.M., Cowie, L.L., Kaaret, P., Jenkins, E.B., York, D.G., & Roesler, F.L. 1983, ApJ, 275, L27
- Hughes et al. (1998) Hughes, D.H., Serjeant, S., Dunlop, J., Rowan-Robinson, M., Blain, A., Ivison, R., et al. 1998, Nature, 394, 241
- Huizinga & van Albada (1992) Huizinga, E., & van Albada, T.S. 1992, MNRAS, 254, 677
- Hunter (1997) Hunter, D.A. 1997, PASP, 109, 937
- Hunter & Gallagher (1997) Hunter, D.A., & Gallagher, J.S. 1997, ApJ, 475, 65
- Hunter et al. (1989) Hunter, D.A., Gallagher, J.S., Rice, W.L., & Gillett, F.C. 1989, ApJ, 336, 152
- Hunter et al. (1986) Hunter, D.A., Gillett, F.C., Gallagher, J.S., Rice, W.L., & Low, F.J., 1984, ApJ, 303, 171
- Hunter et al. (2001) Hunter, D.A., Kaufman, M., Hollenbach, D.J., Rubin, R.H, Malhotra, S., Dale, D.A., Brahuer, J.R., Silbermann, N.A., Helou, G., Contursi, A. & Lord, S.D. 2001, ApJ, in press (astroph/0012354)
- Hunter & Sage (1993) Hunter, D.A., & Sage, L. 1993, PASP, 105, 374
- Hunter & Thronson (1996) Hunter, D.A., & Thronson, H.A. 1996, ApJ, 461, 202
- Ivison et al. (2000) Ivison, R.J., Smail, I., Barger, A.J., Kneib, J.-P., Blain, A.W., Owen, F.N., Kerr, T.H., & Cowie, L.L. 2000, MNRAS, 315, 209
- Ivison et al. (1998) Ivison, R.J., Smail, I., Le Borgne, J.-F., Blain, A.W., Kneib, J.-P., Bezecourt, J., Kerr, T.H., & Davies, J.K. 1998, MNRAS, 298, 583
- Jansen (2000) Jansen, R.A. 2000, PhD Thesis
- Jenniskens (1993) Jenniskens, P. 1993, A&A, 274, 653
- Jones, Davies & Trewhella (1996) Jones, H., Davies, J.I., & Trewhella, M. 1996, MNRAS, 283, 316
- Jones et al. (1994) Jones, A.P., Tielens, A.G.G.M., Hollenbach, D.J., & McKee, C.F. 1994, ApJ, 433, 797
- Jura (1977) Jura, M. 1977, Nature, 266, 702
- Jura et al. (1987) Jura, M., Kim, D.W., Knapp, G.R., & Guhathakurta, P. 1987, ApJ, 312, L11
- Kaastra et al. (2001) Kaastra, J.S., Ferrigno, C., Tamura, T., Paerels, F.B.S., Peterson, J.R., & Mittaz, J.P.D. 2001, A&A, 365, L99
- Karachentsev & Lipovetskii (1969) Karachentsev, I.D., & Lipovetskii, V.A. 1969, Sov. Astron., 12, 909
- Kawara et al. (1998) Kawara, K., Sato, Y., Matsuhara, H. Taniguchi, Y., Okuda, H. et al. 1998, A&A, 336, L9
- Keel (1983) Keel, W.C. 1983, AJ, 88, 1579
- Keel et al. (1985) Keel, W.C., Kennicutt, R.C., Hummel, E., & van der Hulst, J.M. 1985, AJ, 90, 708
- Keel & White (2001a) Keel, W.C., & White, R.E. 2001a, AJ, in press (astroph/0011370)
- Keel & White (2001b) Keel, W.C., & White, R.E. 2001b, AJin press (astroph/0106056)
- Kennicutt (1983) Kennicutt Jr., R.C. 1983, ApJ, 272, 54
- Kennicutt (1998) Kennicutt Jr., R.C. 1998, ARA&A, 36, 189
- Kim, Martin & Hendry (1994) Kim, S.-H., Martin, P.G., & Hendry, P.D. 1994, ApJ, 422, 164
- Kim, Morris & Lee (1999) Kim, S.S., Morris, M., & Lee, H.M. 1999, ApJ, 525, 228
- Kim & Sanders (1998) Kim, D.C., & Sanders, D.B. 1998, ApJS, 119, 41
- Kinney et al. (1993) Kinney, A.L., Bohlin, R.C., Calzetti, D., Panagia, N., & Wyse, R.F.G., ApJS, 86, 5
- Knapp et al. (1989) Knapp, G.R., Guhathakurta, P., Kim, D.W., & Jura, M. ApJS, 70, 329
- Koornneef & Code (1981) Koornneef, J., & Code, A.D. 1981, ApJ, 247, 860
- Kuchinski et al. (1998) Kuchinski, L.E., Terndrup, D.M., Gordon, K.D., & Witt, A.N. 1998, AJ, 115, 1438
- Kunth et al. (1998) Kunth, D., Mas-Hesse, J.M., Terlevich, E., Terlevich, R., Lequeux, J., & Fall, S.M. 1998, A&A, 334, 11
- Kylafis & Bahcall (1987) Kylafis, N.D., & Bahcall, J.N. 1987, ApJ, 317, 637
- Lanzetta et al. (1999) Lanzetta, K.M., Chen, H.-W., Fernández-Soto, A., Pascarelle, S., Yahata, N., & Yahil, A. 1999, in The Hy-Redshift Universe: Galaxy Formation and Evolution at High Redshift, eds. A.J. Bunker & W.J.M. van Breugel (ASP: San Francisco), 544
- Larson & Tinsley (1978) Larson, R.B., & Tinsley, B.M. 1978, ApJ, 219, 46
- Lauer et al. (1995) Lauer, T.R., Ajhar, E.A., Byun, Y.-I., Dressler, A., Faber, S.M., Grillmair, C.,Kormendy, J., Richstone, D., & Tremaine, S. 1995, AJ, 110, 2622
- Le Brun et al. (1997) Le Brun, V., Bergeron, J., Boissé, P., & Deharveng, J.-M. 1997, A&A, 321, 733
- Léger & Puget (1984) Léger, A., & Puget, J.L. 1984, A&A, 137, L5
- Lehnert & Heckman (1996) Lehnert, M.D., & Heckman, T.M. 1996, ApJ, 472, 546
- Leisawitz & Hauser (1988) Leisawitz, D., & Hauser, M.G. 1988, ApJ, 332, 954
- Leitherer & Heckman (1995) Leitherer, C., & Heckman, T.M. 1995, ApJS, 96, 9
- Leitherer et al. (2001) Leitherer, C., Leao, J., Heckman, T.M., Lennon, D., Pettini, M., & Robert, C. 2001, ApJ, 550, in press
- Leitherer et al. (1999) Leitherer, C., Schaerer, D., Goldader, G.D., Gonzalez Delgado, R.M., Robert, C., Kune, D.F., de Mello, D.F., Devost, D., & Heckman, T.M. 1999, ApJS, 123, 3
- Lequeux et al. (1982) Lequeux, J., Maurice, E., Prevot-Burnichon, M.L., Prevot, L., & Rocca-Volmerange, B. 1982, A&A, 113, L15
- Lequeux et al. (1984) Lequeux, J., Maurice, E., Prevot, L., Prevot-Burnichon, M.-L., & Rocca-Volmerange, B. 1984, Structure and Evolution of the Magellanic Clouds, I.A.U. Symposium no. 108, S. van den Bergh & K.S. de Boer eds. (Dordrecht: Reidel), 405
- Li & Draine (2001) Li, A., & Draine, B.T. 2001, ApJ, 554, 778
- Lilly et al. (1999) Lilly, S.J., Eales, S.A., Gear, W.K.P., Hammer, F., Le Fevre, O., Crampton, D., Bond, J.R., & Dunne, L. 1999, ApJ, 518, 641
- Lilly et al. (1995) Lilly, S.J., LeFevre, O., Crampton, D., Hammer, F., & Tresse, L. 1995, ApJ, 455, 50
- Lilly et al (1996) Lilly, S.J., LeFevre, O., Hammer, F., & Crampton, D. 1996, ApJ, 460, L1
- Lisenfeld, Isaak & Hills (2000) Lisenfeld, U., Isaak, K.G., & Hills, R. 2000, MNRAS, 312, 433
- Loeb & Haiman (1997) Loeb, A., & Haiman, Z. 1997, ApJ, 490, 571
- Lonsdale-Persson & Helou (1987) Londale-Persson, C.J., & Helou, G. 1987, ApJ, 314, 513
- Lowenthal et al. (1997) Lowenthal, J.D., Koo, D.C., Guzman, R., Gallego, J., Phillips, A.C., et al. 1997, ApJ, 481, 673
- Lu et al. (1996) Lu, L., Sargent, W.L.W., Barlow, T.A., Churchill, C.W., & Vogt, S.S. 1996, ApJS, 107, 475
- Lutz et al. (1996) Lutz, D., Feuchtgruber, H., Genzel, R., Kunze, D., Rigopoulou, D., et al. 1996, A&A, 315, L269
- Lutz et al. (1998) Lutz, D., Spoon, H.W.W., Rigopoulou, D., Moorwood, A.F.M., & Genzel, R. 1998, ApJ, 505, L103
- Mac Low & Ferrara (1999) Mac Low, M.-M., & Ferrara, A. 1999, ApJ, 513, 142
- Madau et al. (1996) Madau, P. Ferguson, H.C., Dickinson, M.E., Giavalisco, M., Steidel, C.C., & Fruchter, A. 1996, MNRAS, 283, 1388
- Madau, Ferrara & Rees (2001) Madau, P., Ferrar, A., & Rees, M.J. 2001, ApJ, in press
- Maíz-Apellániz & Walborn (2000) Maíz-Apellániz, J., & Walborn, N.R. 2000, poster presented at the IAU XXIVth General Assembly, Manchester
- Malhotra (1997) Malhotra, S. 1997, ApJ, 488, L101
- Maoz (1995) Maoz, D. 1995, ApJ, 455, L115
- Martin (1998) Martin, M.C. 1998, A&AS, 131, 77
- Marzke, Huchra & Geller (1994) Marzke, R.O., Huchra, J.P., & Geller, M.J. 1994, ApJ, 428, 43
- Mas-Hesse, Arnault & Kunth (1989) Mas-Hesse, J.M., Arnault, P., & Kunth, D. 1989, Ap&SS, 157, 131
- Mathis (1990) Mathis, J.S. 1990, ARAA, 28, 37
- Mathis (1996) Mathis, J.S. 1996, ApJ, 472, 643
- Mathis, Mezger & Panagia (1983) Mathis, J.S., Mezger, P.G., & Panagia, N. 1983, A&A, 128, 212
- Mathis, Rumpl & Nordsieck (1977) Mathis, J.S., Rumpl, W., & Nordsieck, K.H. 1977, ApJ, 217, 425
- Mathis & Whiffen (1989) Mathis, J.S., & Whiffen, G. 1989, ApJ, 341, 808
- Matthews & Wood (2001) Matthews, L.D., & Wood, K. 2001, ApJ, 548, 150
- McCarthy et al. (1999) McCarthy, P.J., Yan, L., Freudling, W., Teplitz, H.I., Malumuth, E.M., et al. 1999, ApJ, 520, 548
- McKee (1989) McKee, C.F. 1989, in Interstellar Dust, IAU Symposium 135, eds. L.J. Allamandola & A.G.G.M. Tielens (Dordracht: KAP), 431
- McQuade, Calzetti & Kinney (1995) McQuade, K., Calzetti, D., & Kinney, A.L. 1995, ApJS, 97, 331
- Meier et al. (2001) Meier, D.S., Turner, J.L., Crosthwaite, L.P., & Beck, S.C. 2001, AJ, in press (astroph/0011582)
- Merluzzi (1998) Merluzzi, P. 1998, A&A, 338, 807
- Meurer et al. (1999) Meurer, G.R., Heckman, T.M., & Calzetti, D. 1999, ApJ, 521, 64
- Meurer et al. (1997) Meurer, G.R., Heckman, T.M., Lehnert, M.D., Leitherer, C., & Lowenthal, J. 1997, AJ, 114, 54
- Meyer & York (1987) Meyer, D.M., & York, D.G. 1987, ApJ, 319, L45
- Meyer & Roth (1990) Meyer, D.M., & Roth, K.C. 1990, ApJ, 363, 57
- Mezger, Mathis & Panagia (1982) Mezger, P.G., Mathis, J.S., & Panagia, N. 1982, A&A, 105, 372
- Mihos & Hernquist (1996) Mihos, J.C., & Hernquist, L. 1996, ApJ, 464, 641
- Misiriotis et al. (2000) Misiriotis, A., Kylafis, N.D., Papamastorakis, J., Xilouris, E.M. 2000, A&A, 353, 117
- Misselt, Clayton & Gordon (1999) Misselt, K.A., Clayton, G.C., & Gordon, K.D. 1999, ApJ, 515, 128
- Misselt et al. (2001) Misselt, K.A., Gordon, K.D., Clayton, G.C., & Wolff, M.J. 2001, ApJ, in press (astroph/0011576)
- Moorwood et al. (2000) Moorwood, A.F.M., van der Werf, P.P., Cuby, J.C., & Oliva, E. 2000, A&A, 362, 9
- Moriondo, Giovanelli & Haynes (1998) Moriondo, G., Giovanelli, R., & Haynes, M.P. 1998, å, 338, 795
- Murphy et al. (2001) Murphy, T.W., Soifer, B.T., Matthews, K., Armus, L., & Kiger, J.R. 2001, AJ, 121, 97
- Mushotzky et al. (1996) Mushotzky, R.F., Loewenstein, M., Arnaud, K.A., Tamura, T., Fukazawa, Y., Matsushita, K., Kikuchi, K., & Hatsukade, I. 1996, ApJ, 466, 686
- Mushotzky & Loewenstein (1997) Mushotzky, R.F., & Loewenstein, M., 1997, ApJ, 481, L63
- Nandy et al. (1981) Nandy, K., Morgan, D.H., Willis, A.J., Wilson, R., Gondhalekar, P.M. 1981, MNRAS, 196, 955
- Nath & Trentham (1997) Nath, B.B., & Trentham, N. 1997, MNRAS, 291, 505
- Natta & Panagia (1976) Natta, A., & Panagia, N. 1976, A&A, 50, 191
- Natta & Panagia (1984) Natta, A., & Panagia, N. 1984, ApJ, 287, 228
- Nelson, Zaritsky & Cutri (1998) Nelson, A.E., Zaritsky, D., & Cutri, R.M. 1998, AJ, 115, 2273
- Niklas, Klein & Wielebinski (1997) Niklas, S., Klein, U., & Wielebinski, R. 1997, A&A, 322, 19
- Norman, Sellwood & Hasan (1996) Norman, C.A, Sellwood, J.A., & Hasan, H. 1996, ApJ, 462, 114
- Oliver et al. (1997) Oliver, S.J., Goldschmidt, P., Franceschini, A., Serjeant, S.B.G., Efstathiou, A., et al. 1997, MNRAS, 289, 471
- Ortolani et al. (1995) Ortolani, S., Renzini, A., Gilmozzi, R., Marconi, G., Babuy, B., Bica, E., & Rich, M.R. 1995, Nature, 377, 701
- Osterbrock (1989) Osterbrock, D.E. 1989, Astrophysics of Gaseous Nebulae and Active Galactic Nuclei (Mill Valley: University Science Books)
- Ostriker & Gnedin (1996) Ostriker, J.P., & Gnedin, N.Y. 1996, ApJ, 472, L63
- Ouchi et al. (1999) Ouchi, M., Yamada, T., Kawai, H., & Ohta, K. 1999, ApJ, 517, L19
- Pak et al. (1998) Pak, S., Jaffe, D.T., van Dishoeck, E.F., Johansson, L.E.B., & Booth, R.S., 1998, ApJ, 498, 735
- Papovich, Dickinson, & Ferguson (2001) Papovich, C., Dickinson, M., & Ferguson, H.C. 2001, ApJ, in press
- Peacock et al. (2000) Peacock, J.A., Rowan-Robinson, M., Blain, A.W., Dunlop, J.S., Efstathiou, A., et al. 2000, MNRAS, 318, 535
- Pei, Fall & Bechtold (1991) Pei, Y.C., Fall, S.M., & Bechtold, J. 1991, ApJ, 378, 6
- Pei, Fall & Hauser (1999) Pei, Y.C, Fall, S.M., & Hauser, M.G. 1999, ApJ, 522, 604
- Peletier et al. (1995) Peletier, R.F., Valentijn, E.A., Moorwood, A.F.M., Freudling, W., Knapen, J.H., & Beckman, J.E. 1995, A&A, 300, L1
- Peletier & Willner (1992) Peletier, R.F., & Willner, S.P. 1992, AJ, 103, 1761
- Penton, Shull & Stocke (2000) Penton, S.V., Shull, J.M., & Stocke, J.T. 2000, ApJ, 544, 150
- Peterson et al. (2001) Peterson, J.R., Paerels, F.B.S., Kaastra, J.S., Arnaud, M., Reiprich, T.H., Fabian, A.C., Mushotzky, R.F., Jernigan, J.G., & Sakelliou, I. 2001, A&A, 365, L104
- Petitjean, Muecket & Kates (1995) Petitjean, P., Muecket, J.P., & Kates, R.E. 1995, A&A, 295, L9
- Pettini (1999) Pettini, M. 1999, in Chemical Evolution from Zero to High Redshift, ed. J. Walsh & M. Rosa (Berlin:Springer), 233
- Pettini, Boksenberg & Hunstead (1990) Pettini, M., Boksenberg, A., & Hunstead, R.W., 1990, ApJ, 348, 48
- Pettini et al. (2000a) Pettini, M., Ellison, S.L., Steidel, C.C., Shapley, A.E., & Bowen, D.V. 2000a, ApJ, 532, 65
- Pettini et al. (1999) Pettini, M., Ellison, S.L., Steidel, C.C., & Bowen, D.V. 1999, ApJ, 510, 576
- Pettini et al. (1998) Pettini, M., Kellogg, M., Steidel, C.C., Dickinson, M.E., Adelberger, K.L., & Giavalisco, M. 1998, ApJ, 508, 539
- Pettini et al. (1997a) Pettini, M., King, D.L., Smith, L.J., & Hunstead, R.W. 1997a, ApJ, 478, 536
- Pettini et al. (2001) Pettini, M., Shapley, A.E., Steidel, C.C., Cuby, J.-G., Dickinson, M., Moorwood, A.F.M., Adelberger, K.L., & Giavalisco, M. 2001, ApJ, 554, 981
- Pettini et al. (1994) Pettini, M., Smith, L.J., Hunstead, R.W., & King, D.L. 1994, ApJ, 426, 79
- Pettini et al. (1997b) Pettini, M., Smith, L.J., King, D.L., & Hunstead, R.W., & King, D.L. 1997b, ApJ, 486, 665
- Pettini et al. (2000b) Pettini, M., Steidel, C.C., Adelberger, K.L., Dickinson, M.E., & Giavalisco, M. 2000b, ApJ, 528, 96
- Pinkney et al. (1996) Pinkney, J., Holtzman, J., Garasi, C., et al. 1996, ApJ, 468, L13
- Pizagno & Rix (1998) Pizagno, J., & Rix, H.-W. 1998, AJ, 116, 2191
- Poggianti & Wu (2000) Poggianti, B.M., & Wu, H. 2000, ApJ, 529, 157
- Popescu et al. (2000) Popescu, C.C., Tuffs, R.J., Fischera, J., & Völk, H. 2000, A&A, 354, 480
- Prochaska & Wolfe (2000) Prochaska, J.X., & Wolfe, A.M. 2000, ApJ, 533, L5
- Puget et al. (1996) Puget, J.-L., Abergel, A., Bernard, J.-P., Boulanger, F., Burton, W.B., Desert, F.-X., & Hartmann, D. 1996, A&A, 308, L5
- Puget et al. (1999) Puget, J.L., Lagache, G., Clements, D.L, Reach, W.T., Aussel, H., et al. 1999, A&A, 345, 29
- Quillen et al. (1999) Quillen, A.C., Rieke, G.H., Rieke, M.J., Caldwell, N., & Engelbracht, C. 1999, ApJ, 518, 632
- Radovich, Kahanpää & Lemke (2001) Radovich, M., Kahanpää, J., & Lemke, D. 2001, A&A, in press (astroph/0108075)
- Rao & Turnshek (2000) Rao, S.M., & Turnshek, D.A. 2000, ApJS, 130, 1
- Rauch et al. (1997) Rauch, M., Miralda-Escudé, J., Sargent, W.L.W., Barlow, T.A., Weinberg, D.H., Hernquist, L., Katz, N., Cen, R., & Ostriker, J.P. 1997, ApJ, 489, 7
- Reach et al. (2000) Reach, W.T., Boulanger, F., Contursi, A., & Lequeux, J., 2000, A&A, 361, 895
- Renzini (1999) Renzini, A. 1999, in Chemical Evolution from Zero to High Redshift, ed. J. Walsh & M. Rosa (Berlin:Springer), 185
- Rieke & Lebofsky (1985) Rieke, G.H., & Lebofsky, M.J. 1985, ApJ, 288, 618
- Rieke & Lebofsky (1986) Rieke, G.H., & Lebofsky, M.J. 1986, ApJ, 304, 326
- Rieke et al. (1980) Rieke, G.H., Lebofsky, M.J., Thompson, R. I., Low, F.J., & Tokunaga, A.T. 1980, ApJ, 238, 24
- Rieke et al. (1993) Rieke, G.H., Loken, K., Rieke, M.J., & Tamblyn, P. 1993, ApJ, 412, 99
- Riess et al. (2000) Riess, A., Filippenko, A.V., Liu, M.C., et al. 2000, ApJ, 536, 62
- Riess et al. (2001) Riess, A., Nugent, P., Smith, B., Tonry, J., Gilliland, R., et al. 2001, ApJ, in press
- Rigopoulou et al. (2000) Rigopoulou, D., Franceschini, A., Aussel, H., Genzel, R., van der Werf, P., et al. 2000, ApJ, 537, L85
- Rix & Rieke (1993) Rix, H.-W., & Rieke, M.J. 1993, ApJ, 418, 123
- Roberts & Haynes (1994) Roberts, M.S., & Haynes, M.P. 1994, ARA&A, 32, 115
- Roberts et al. (1991) Roberts, M.S., Hogg, D.E., Bregman, J.N., Forman, W.R., & Jones, C. 1991, ApJS, 75, 751
- Romani & Maoz (1992) Romani, R.W., & Maoz, D. 1992, ApJ, 386, 36
- Rowan-Robinson & Crawford (1989) Rowan-Robinson, M., & Crawford, J. 1989, MNRAS, 238, 523
- Rowan-Robinson & Efstathiou (1993) Rowan-Robinson, M., & Efstathiou, A. 1993, MNRAS, 263, 675
- Rowan-Robinson et al. (1997) Rowan-Robinson, M., Mann, R.G., Oliver, S.G., Efstathiou, A., Eaton, N. et al. 1997, MNRAS, 289, 490
- Rowan-Robinson et al. (1999) Rowan-Robinson, M., Oliver, S., Efstathiou, A., Gruppioni, C., Serjeant, S., et al. 1999, in The Universe as Seen by ISO, eds. P. Cox & M.F. Kessler (Noordwijk: ESA Publications Division) 1011
- Rowan-Robinson, Negroponte & Silk (1979) Rowan-Robinson, M., Negroponte, J., & Silk, J. 1979, Nature, 281, 635
- Sadler & Gerhard (1985) Sadler, E.M., & Gerhard, O.E. 1985, MNRAS, 214, 177
- Sanders & Mirabel (1996) Sanders, D.B., & Mirabel, I.F. 1996, ARA&A, 34, 749
- Sanders et al. (1988) Sanders, D.B., Soifer, B.T., Elias, J.H, Madore, B.F., Matthews, K., Neugebauer, G., & Scoville, N.Z. 1988, ApJ, 325, 74
- Savaglio, Panagia & Stiavelli (2000) Savaglio, S., Panagia, N., & Stiavelli, M. 2000, in Cosmic Evolution and Galaxy Formation: Structure, Interactions, and Feedback, ASP Conf. Ser. 215, eds. J. Franco, E. Terlevich, O. López–Cruz, & I. Aretxaga (ASP: Chelsea), 65
- Sawicki (2001) Sawicki, M. 2001, AJ, in press (astroph/0102208)
- Sawicki & Yee (1998) Sawicki, M., & Yee, H.K.C. 1998, AJ, 115, 1329
- Schutte et al. (1998) Schutte, W.A., van der Hucht, K.A., Whittet, D.C.B., Boogert, A.C.A., Tielens, A.G.G.M., et al. 1998, A&A, 337, 261
- Scott et al. (2000) Scott, D., Lagache, G., Borys, C., Chapman, S.C., Halpern, M., et al. 2000, A&A, 357, L5
- Scott et al. (2001) Scott, S.E., Fox, M.J., Dunlop, J.S., Serjeant, S., Peacock, J.A., et al. 2001, MNRAS, submitted (astroph/0107446)
- Scoville et al. (1998) Scoville, N.Z., Evans, A.S., Dinshaw, N., Thompson, R., Rieke, M.,Schneider, G., Low, F.J., Hines, D., Stobie, E., Becklin, E., & Epps, H. 1998, ApJ, 492, L107
- Scowen et al. (1998) Scowen, P.A., Hester, J.J., Sankrit, R., Gallagher, J.S., Ballester, G.E., et al. 1998, AJ, 116, 163
- Sellgren (1984) Sellgren, K. 1984, ApJ, 277, 623
- Sellgren (1994) Sellgren, K. 1994, The First Symposium on the Infrared Cirrus and Diffuse Insterstellar Clouds, Cutri & Latter, San Francisco: ASP, 58, 243
- Sellgren (2000) Sellgren, K. 2000, Spectrochimica Acta A, Feb. 2001, in press (astroph/0010138)
- Serjeant et al. (2000) Serjeant, S., Oliver, S., Rowan-Robinson, M., Crockett, H., Missoulis, V., et al. 2000, MNRAS, 316, 768
- Severgnini et al. (2000) Severgnini, P., Maiolino, R., Salvati, M., Axon, D., Cimatti, A., Fiore, F., Gilli, R., La Franca, F., Marconi, A., Matt, G., Risaliti, G., & Vignali, C. 2000, A&A, 360, 457
- Shapley et al. (2001) Shapley, A.E., Steidel, C.C., Adelberger, K.L., Dickinson, M., Giavalisco, M., & Pettini, M. 2001, in prep.
- Shaver et al. (1999) Shaver, P.A., Hook, I.M., Jackson, C.A., Wall, J.V., & Kellermann, K.I. 1999, in Highly Redshifted Radio Lines, ASP Conf. Ser. 156, ed. C.L. Carilli, S.J.E. Radford, K.M. Menten & G.I. Langston (ASP: San Francisco), 163
- Shioya, Trentham & Taniguchi (2001) Shioya, Y., Trentham, N., & Taniguchi, Y. 2001, ApJ, in press (atroph/0011467)
- Silva et al. (1998) Silva, L., Granato, G.L., Bressan, A., & Danese, L. 1998, ApJ, 509, 103
- Simonsen & Hannestad (1999) Simonsen, J.T., & Hannestad, S. 1999, A&A, 351, 1
- Skillman, Kennicutt & Hodge (1989) Skillman, E.D., Kennicutt, R.., & Hodge, P.W. 1989, ApJ, 347, 875
- Smail, Ivison & Blain (1997) Smail, I., Ivison, R.J., & Blain, A.W. 1997, ApJ, 490, L5
- Smail et al. (1998) Smail, I., Ivison, R.J., Blain, A.W., & Kneib, J.-P. 1998, ApJ, 507, L21
- Smail et al. (1999) Smail, I., Ivison, R.J., Kneib, J.-P., Blain, A.W., Barger, A.J., Owen, F.N., & Morrison, G. 1999, MNRAS, 308, 1061
- Smail et al. (2000) Smail, I., Ivison, R.J., Owen, F.N., Blain, A.W., & Kneib, J.-P. 2000, ApJ, 528, 612
- Sobolev (1963) Sobolev, V.V. 1963, A Treatise on Radiative Transfer, Princeton: Van Nostrand
- Sodroski et al. (1994) Sodroski, T.J., Bennett, C., Boggess, N., Dwek, E., Franz, B.A., Hauser, M.G., Kelsall, T., Moseley, S.H., Odegard, N., Silverberg, R.F., & Weiland, J.L. 1994, ApJ, 428, 638
- Sofue et al. (1992) Sofue, Y., Reuter, H.-P., Krause, M., Wielebinski, R., & Nakai, N. 1992, ApJ, 395, 126
- Soifer, Houck & Neugebauer (1987) Soifer, B.T., Houck, J.R., & Neugebauer, G. 1987, ARA&A, 25, 187
- Soifer & Neugebauer (1991) Soifer, B.T., & Neugebauer, G. 1991, AJ, 101, 354
- Songaila & Cowie (1996) Songaila, A. & Cowie, L.L. 1996, AJ, 112, 335
- Sparks, Ford & Kinney (1993) Sparks, W.B., Ford, H.C., & Kinney, A.L. 1993, ApJ, 413, 531
- Sparks, Macchetto & Golombek (1989) Sparks, W.B., Macchetto, F., & Golombek, D. 1989, ApJ, 345, 153
- Sprayberry & Foltz (1992) Sprayberry, D., & Foltz, C.B. 1992, ApJ, 390, 39
- Steidel et al. (1999) Steidel, C.C., Adelberger, K.L., Giavalisco, M., Dickinson, M.E., & Pettini, M. 1999, ApJ, 519, 1
- Steidel et al. (1996a) Steidel, C.C., Giavalisco, M., Dickinson, M.E., & Adelberger, K.L. 1996a, AJ, 112, 352
- Steidel et al. (1996b) Steidel, C.C., Giavalisco, M., Pettini, M., Dickinson, M., & Adelberger, K. 1996b, ApJ, 462, L17
- Steidel & Hamilton (1992) Steidel, C.C., & Hamilton, D. 1992, AJ, 104, 941
- Stickel et al. (1998) Stickel, M., Lemke, D., Mattila, K., Haikala, L.K., & Haas, M. 1998, A&A, 329, 55
- Storchi-Bergmann, Kinney & Challis (1995) STorchi-Bergmann, T., Kinney, A.L., & Challis, P. 1995, ApJS, 98, 103
- Sullivan et al. (2000) Sullivan, M., Treyer, M.A., Ellis, R.S., Bridges, T.J., Milliard, B., & Donas, J. 2000, MNRAS, 312, 442
- Sullivan et al. (2001) Sullivan, M., Mobasher, B., Chan, B., Cram, L., Ellis, R., Treyer, M., & Hopkins, A. 2001, ApJ, in press (astroph/0104425)
- Szalay, Hollósi & Tóth (1989) Szalay, A.S., Hollósi, J., & Tóth, G. 1989, ApJ, 339, L5
- Tamura et al. (2001) Tamura, T., Kaastra, J.S., Peterson, J.R., Paerels, F.B.S., Mittaz, J.P.D., Trudolyubov, S.P., Stewart, G., Fabian, A.C., Mushotzky, R.F., Lumb, D.H., & Ikebe, Y. 2001, A&A, 365, L87
- Taniguchi et al. (1997) Taniguchi, Y., Cowie, L.L., Sato, Y., Sanders, D.B., Kawara, K. et al. 1998, A&A, 328, L9
- Teplitz et al. (2000a) Teplitz, H.I., Malkan, M.A., Steidel, C.C., McLean, I.S., Becklin, E.E., et al. 2000a, ApJ, 542, 18
- Teplitz et al. (2000b) Teplitz, H.I., McLean, I.S., Becklin, E.E., Figer, D.F., Gilbert, A.M., et al. 2000b, ApJ, 533, L65
- Theuns et al. (1998) Theuns, T., Leonard, A., Efstathiou, G., Pearce, F.R., & Thomas, P.A. 1998, MNRAS, 301, 478
- Tielens (1989) Tielens, A.G.G.M. 1989, in Interstellar Dust, IAU Symp. no. 135, eds. L.J. Allamandola & A.G.G.M. Tielens (Dordrecht: KAP), 239
- Tran et al. (2001) Tran, H., Tsvetanov, Z., Ford, H.C., Davies, J., Jaffe, W., van den Bosch, F.C., & Rest, A. 2001, AJ, accepted (astroph/0102292)
- Tremonti et al. (2001) Tremonti, C.A., Calzetti, D., Leitherer, C., & Heckman, T.M. 2001, ApJ, in press (astroph/0103432)
- Trentham, Kormendy & Sanders (1999) Trentham, N., Kormendy, J.K., & Sanders, D.B. 1999, AJ, 117, 2152
- Trewhella (1998) Trewhella, M. 1998, MNRAS, 297, 807
- Trewhella, Madore & Kuchinski (1999) Trewhella, M., Madore, B., & Kuchinski, L. 1999, Observational Cosmology: The Development of Galaxy Systems, Giuricin, Mezzetti & Salucci, San Francisco: ASP, 176, 454
- Trewhella et al. (2000) Trewhella, M., Davies, J.I., Alton, P.B., Bianchi, S., & Madore, B.F. 2000, ApJ, 543, 153
- Trewhella et al. (1997) Trewhella, M., Davies, J.I., Disney, M.J., & Jones, H.G.W. 1997, MNRAS, 288, 397
- Turnshek, Rao & Nestor (2001) Turnshek, D.A., Rao, S.M., & Nestor, D.B. 2001, in Extragalactic Gas at Low Redshift, ASP Conf. Ser., J. Mulchaey and J. Stocke eds. (ASP: …), in press (astroph/0108142)
- Tytler et al. (1995) Tytler, D., Fan, X.M., Burles, S., Cottrell, L., Davis, C., Kirkman, D., & Zuo, L. 1995, in QSO Absorption Lines, ed. G. Meylan (Garching:ESO), 289
- Valentijn (1990) Valentijn, E.A. 1990, Nature, 346, 153
- van den Bergh (1974) van den Bergh, S., 1974, ApJ, 193, 63
- van der Werf et al. (2001) Van der Werf, P.P., Kraiberg Knudsen, K., Labbé, I., & Franx, Marijn 2001, in The Far-Infrared and SubmillimeterSpectral Energy Distributions of Active and Starburst Galaxies, eds. P. Barthel, B. Wilkes, & I. van Bemmel (Elsevier: The Netherlands), …
- van Dokkum & Franx (1995) van Dokkum, P.G. & Franx, M. 1995, AJ, 110, 2027
- Városi & Dwek (1999) Városi, F., & Dwek, E. 1999, ApJ, 523, 265
- Veilleux, Kim & Sanders (1999) Veilleux, S., Kim, D.-C., & Sanders, D.B. 1999, ApJ, 522, 113
- Verter & Hodge (1995) Verter, F., & Hodge, P. 1995, ApJ, 446, 616
- Vladilo (1998) Vladilo, G. 1998, ApJ, 493, 583
- Voit & Donahue (1995) Voit, G.M., & Donahue, M. 1992, ApJ, 452, 164
- Voit & Donahue (1997) Voit, G.M., & Donahue, M. 1997, ApJ, 486, 242
- Voshchinnikov & Mathis (1999) Voshchinnikov, N.V. & Mathis, J.S. 1999, ApJ, 526, 257
- Wainscoat, Hyland & Freeman (1990) Wainscoat, R.J, Hyland, A.R., & Freeman, K.C. 1990, ApJ, 348, 85
- Walborn (1991) Walborn, N.R. 1991, in Massive Stars in STarbursts, eds. C. Leitherer, N.R. Walborn, T.M. Heckman, & C.A. Norman (Cambridge: CUP), 145
- Walborn et al. (1999) Walborn, N.R., Barbá, R.H., Brandner, W., Rubio, M., Grebel, E.K., & Probst, R.G. 1999, AJ, 117, 225
- Wang (1991) Wang, B. 1991, ApJ, 383, L37
- Wang & Heckman (1996) Wang, B., & Heckman, T.M. 1996, ApJ, 457, 645
- Wang, Heckman & Lehnert (1998) Wang, J., Heckman, T.M., & Lehnert, M.D. 1998, ApJ, 515, 97
- Weingartner & Draine (2000) Weingartner, J.C., & Draine, B.T. 2001, ApJ, 548, 296
- White & Frenk (1991) White, S.D.M., & Frenk, C.S. 1991, ApJ, 379, 52
- White & Keel (1992) White, R.E., & Keel, W.C. 1992, Nature, 359, 129
- White, Keel & Conselice (2000) White, R.E., Keel, W.C., & Conselice, C.J. 2000, ApJ, 542, 761
- Whittle (1992) Whittle, M. 1992, ApJS, 79, 49
- Wilson, Walker & Thornley (1997) Wilson, C.D., Walker, C.E., & Thornely, M.D. 1997, ApJ, 483, 210
- Wise et al. (1993) Wise, M.W., O’Connell, R.W., Bregman, J.N., & Roberts, M.S. 1993, ApJ, 405, 94
- Wise & Silva (1996) Wise, M.W., & Silva, D.R. 1996, ApJ, 461, 155
- Witt, Friedmann & Sasseen (1997) Witt, A.N., Friedmann, B.C., & Sasseen, T.P. 1997, ApJ, 481, 809
- Witt & Gordon (1996) Witt, A.N, & Gordon, K.D. 1996, ApJ, 463, 681
- Witt & Gordon (2000) Witt, A.N., & Gordon, K.D. 2000, ApJ, 528, 799
- Witt, Thronson & Capuano (1992) Witt, A.N., Thronson, H.A., & Capuano, J.M. 1992, ApJ, 393, 611
- Wolff, Clayton & Gibson (1998) Wolff, M.J., Clayton, G.C., & Gibson, S.J. 1998, ApJ, 503, 815
- Wright (1981) Wright, E.L. 1981, ApJ, 250, 1
- Xilouris et al. (1997) Xilouris, E.M., Kylafis, N.D., Papamastorakis, J., Paleologou, E.V., & Haerendel, G. 1997, A&A, 325, 135
- Xilouris et al. (1999) Xilouris, E.M., Byun, Y.I., Kylafis, N.D., Paleologou, E.V., & Papamastorakis, J., 1999, A&A, 344, 868
- Xu (2000) Xu, C. 2000, ApJ, 541, 134
- Xu & Buat (1995) Xu, C., & Buat, V. 1995, A&A, 293, L65
- Xu & Helou (1996) Xu, C., & Helou, G. 1996, ApJ, 456, 163
- Yadav & Sagar (2001) Yadat, R.K.S., & Sagar, R. 2001, MNRAS, in press
- Yamamoto & Vansevicius (1999) Yamamoto, T.M., & Vansevicius, V. 1999, PASJ, 51, 405
- Yan et al. (1999) Yan, L., McCarthy, P.J., Freudling, W., Teplitz, H.J., Malumuth, E.M., Weymann, R.J., & Malkan, M.A. 1999, ApJ, 519, L47
- Young & Scoville (1991) Young, J.S., & Scoville, N.Z. 1991, ARA&A, 29, 581
- Yu & Solomon (1999) Yu, G. & Solomon, P.M. 1999, ApJ, 512, L99
- Yun, Reddy & Condon (2001) Yun, M.S., Reddy, N.A., & Condon, J.J. 2001, ApJ, accepted (astroph/0102154)
- Zaritsky (1994) Zaritsky, D. 1994, AJ, 108, 1619
- Zaritsky (1999) Zaritsky, D. 1999, AJ, 118, 2824
- Zaritsky, Kennicutt & Huchra (1994) Zaritsky, D., Kennicutt, R.C., & Huchra, J.P. 1994, ApJ, 420, 87
- Zhang, Anninos & Norman (1995) Zhang, Y., Anninos, P., & Norman, M.L. 1995, ApJ, 453, L57
- Zuo et al. (1997) Zuo, L., Beaver, E.A., Burbidge, E.M., Cohen, R.D., Junkkarinen, V.T., & Lyons, R.W. 1997, ApJ, 477, 568
- Zwicky (1957) Zwicky, F., 1957, in Morphological Astronomy (Berlin: Springer-Verlag), 101
Examples of extinction curves in local galaxies. The Milky-Way extinction curve is shown for three different values of R(V), 3.1 (continuos red line), 5.0 (dashed red line), and 2.0 (dotted red line) (Cardelli, Clayton & Mathis, 1989; Fitzpatrick, 1999). The extinction curve of the Large Magellanic Cloud’s 30 Doradus region (dashed black line) and of the Small Magellanic Cloud’s bar (continuous black line) are reported for R(V)=2.7 (Gordon & Clayton, 1998; Misselt, Clayton & Gordon, 1999). The starburst obscuration curve (section 4) is shown (blue line) here for a purely illustrative comparison. The comparison should not be taken at face value, because the dust obscuration of galaxies is conceptually different from the dust extinction of stars. The latter measures strictly the optical depth of the dust between the observer and the star, while the former expresses a more general attenuation, in that it folds in one expression effects of extinction, scattering, and the geometrical distribution of the dust relative to the emitters (section 4).
Predicted reddening and attenuation values for five simple models of plane-parallel dust/emitter distributions (section 2.2 and Natta & Panagia, 1984; Calzetti, Kinney & Storchi-Bergmann, 1994; Wang & Heckman, 1996): a homogeneous, non-scattering dust screen foreground to the light source (red squares); a homogeneous, scattering dust screen foreground to the light source (red circles); a Poissonian distribution of clumps in front of the light source, with average number =10 (red triangles); an homogeneous mixture of dust and emitters (black squares); a homogeneous distribution averaged over all inclination angles, with increasing star-to-dust scaleheight ratio from UV (and ionized gas emission) to K (black circles). Both the MW extinction curve for diffuse ISM (continuous lines) and the SMC-bar extinction curve (dashed lines) are used in the models. The reddening and attenuation given by the starburst obscuration curve (section 4) are also shown for comparison (blue line). is the front-to-back optical depth of the dust layer. Panels a and b show the relation between and the effective extinction AV and color VI. Panels c–f show the effects of dust reddening on the UV, optical, and near–IR colors of a stellar population. The default population is a 300 Myr constant star formation one. U, V, I are standard Johnson magnitudes; K has central wavelength 2.163 m and zeropoint 26. m0.15 is defined as , where f(0.15) is the flux density at 0.15 m.
The same models of Figure The Dust Opacity of Star-Forming Galaxies for additional spectroscopic and photometric quantities. The dust optical depth is defined in the previous figure. Rαβ and Rβγ are the attenuated-to-intrinsic H/H and H/Br ratios, respectively (equation 3 and Table 2). The UV spectral slope is defined in Appendix B. Ldust is the dust luminosity, corresponding to the stellar light removed (absorbed and scattered) by dust from the line of sight. This is generally larger than the dust infrared luminosity, which only includes the absorbed fraction of the energy, unless scattering in and out of the line of sight compensate each other. The latter can be often safely adopted for large samples of galaxies with random inclinations (exemplified by the fifth model). LHα is the luminosity of the nebular emission at H. Continuum luminosities at 0.15 m and 0.28 m are given as L4Df(), where D is the galaxy distance and f() is the flux density at wavelength ; the reference wavelengths are chosen to span the UV spectrum while avoiding prominent absorption lines (including the broad 0.2175 m bump in the MW extinction curve). The large deviation of the starburst reddening curve from the other models in the last two panels is due to the differential obscuration between ionized gas and stellar continuum (section 4).
The comparison of colors and absolute magnitude between an ageing instantaneous burst of star formation in the range 1-80 Myr (black line) and a fixed-age (6 Myr) stellar population subject to increasing dust obscuration (red line). The model used for the dust obscuration is a foreground clumpy distribution, with optical depth range 0–6.3.
The UV to IR flux ratio as a function of the sum of the UV and IR luminosities for star-forming galaxies (reproduction of Figure 4 of Wang & Heckman (1996)). The UV flux is centered at 0.20 m and is defined as FUV=f(). The IR emission in this figure (called ‘FIR’) is the integrated emission in the 40–120 m IRAS window, which contains roughly between 35% and 60% of the dust bolometric emission (Dale et al., 2001). The ratio UV/IR is a measure of the total opacity of a star-forming galaxy (see, also, section 4). The plot shows that more luminous galaxies are more opaque. The symbols indicate: spirals (filled squares), irregulars (crosses), elliptical/lenticulars (empty squares), amorphous (stars), unknown (circles). The lines show predictions for a range of parameters from the model described in Wang & Heckman (1996). Figure reproduced with permission from the author and the publishing journal.
Panels a, c, and d show UV-to-near–IR colors of 50 UV-selected starbursts as a function of the attenuated-to-intrinsic hydrogen emission line ratio H/H (filled circles). The relation between Rαβ and the color excess of the ionized gas E(BV)gas (section 4.1) is given by equation 4. The starburst obscuration curve (blue line) is derived from these data. Increasing values of Rαβ, i.e. larger amount of dust intercepted by the gas, correspond to redder colors of the stellar continuum (adapted from Calzetti, Kinney & Storchi-Bergmann, 1994; Calzetti, 1997a). For the definition of see Appendix B; f(0.16), f(J), and f(K) are flux densities at the indicated wavelengths. Panel b shows the correlation between the attenuated-to-intrinsic ratios of the hydrogen line pairs H/H and H/Br; plotted with the data points are trend of the dust models of section 2.2 (with the same coding of Figure The Dust Opacity of Star-Forming Galaxies). Homogeneous mixtures of gas and dust, either face-on or inclination-averaged, are excluded by the data, indicating that there in little internal dust in the starburst site (adapted from Calzetti, Kinney & Storchi-Bergmann, 1996). Panels e and f give for both the luminosity ratio LHα/L0.16 and the equivalent width of H the comparison between data points and expected trend of the starburst obscuration curve.
The dust bolometric luminosity, LIR, normalized to the UV and B stellar luminosities (L0.16 in panel a and LB in panel b, respectively) shown as a function of the UV spectral slope for the same starburst sample of Figure The Dust Opacity of Star-Forming Galaxies (circles) and for nine ULIRGs (stars in panel a; Trentham, Kormendy & Sanders, 1999; Goldader et al., 2001). For most galaxies, where only IRAS measurements are available, the infrared luminosity in the 40–120 m window is transformed into a dust bolometric luminosity using the correction: LIR=1.75 L(40-120) (Calzetti et al., 2000). The blue luminosity is that of the starburst region, from the data of McQuade, Calzetti & Kinney (1995) and Storchi-Bergmann, Kinney & Challis (1995). The luminosity ratios measure the starburst total dust opacity, while the UV slope is a measure of the UV reddening. The correlations imply that measuring the reddening in a UV-bright starburst gives a good handle on its global obscuration (adapted from Calzetti et al., 1995b; Meurer et al., 1999). In panel a the predicted trend from some of the models of section 2.2 (coded in the same fashion as in Figure The Dust Opacity of Star-Forming Galaxies) are reported; in panel b, only the starburst obscuration curve is shown. ULIRGs deviate from the behavior of UV-selected starbursts, and combinations of clumpy distributions and homogeneous mixtures of dust and stars seem to better account for the data. Panels c and d show the same data of panel b, as a function of the galaxy metallicity and of the attenuated-to-intrinsic H/H ratio, respectively. Dust opacity correlates with the metal content in starbursts (Heckman et al., 1998).
A schematic representation of the dust/star distribution in starburst galaxies, that can account for most observational constraints. The starburst region (center of figure) contains the newly formed stellar population, including the short-lived, massive stars (dark starred symbols), some still embedded in the parental clouds. Gas outflows induced by hot star winds and supernova explosions from previous stellar generations have displaced dust and gas (dark-gray circles) to the edges of the region. The ionized gas, located at the boundaries of the site, ‘sees’ the surrounding dust as a ‘foreground distribution’. The galaxy’s diffuse ISM (light-gray circles) is also surrounding the starburst. Both the galactic and the starburst-associated dust are clumpy (Gordon, Calzetti & Witt, 1997; Charlot & Fall, 2000). Thus, the stellar continuum light will often emerge from regions that are not necessarily spatially coincident (in projection) with those of the dust and ionized gas (Calzetti, 1997a). If star formation has been on-going for longer than the lifetime of massive stars (107 yr), the surroundings of the current starburst site become populated by the less massive, long-lived stars from previous starburst generations (light starred symbols), that are diffusing into the less opaque general ISM or have dispersed their parental clouds (Calzetti, Kinney & Storchi-Bergmann, 1994; Charlot & Fall, 2000). This model should be regarded as a simple approximation of the more realistic distribution of emitters and absorbers in starburst galaxies.
The UV to IR luminosity ratio as a function of the total UV plus IR luminosity for star-forming galaxies at z1 (panel a) and z3 (panel b). From Figure 11 of Adelberger & Steidel (2000), with data kindly provided by K. Adelberger (2001, private communication) and modified to our selected cosmology, =1, =0 and Ho=65 km s-1 Mpc-1. The (blue) circles are the high-redshift data, the shaded region shows the locus occupied by the local star-forming and starburst galaxies (Wang & Heckman, 1996; Heckman et al., 1998), the (black) stars are the ULIRGs from Goldader et al. (2001) and Trentham, Kormendy & Sanders (1999). The infrared luminosity of the high redshift galaxies is derived using UV data and the –versus–LIR/LUV correlation (equation 17 and Adelberger & Steidel, 2000). For fixed UV/IR ratio, the faint luminosity end of the high redshift galaxy distributions is determined by selection effects, while the bright luminosity end is free from such effects. Thus, if UV/IR–vs.– relationship holds for the distant star-forming galaxies, more actively star-forming galaxies are on average more opaque, similar to the trend observed in local galaxies (Wang & Heckman, 1996; Heckman et al., 1998, see also Figure The Dust Opacity of Star-Forming Galaxies). It also highlights that at fixed UV/IR ratio (fixed opacity), higher redshift galaxies tend to be brighter at the high luminosity end than local galaxies. Since the sum of the UV and IR luminosities measures the SFR, high redshift galaxies tend to be more actively star forming than local galaxies for fixed dust opacity (Adelberger & Steidel, 2000).
The attenuated-to-intrinsic LHα/L0.28 ratio in z1–2 galaxies, RHα,0.28=(LHα/L0.28)a/(LHα/L0.28)o, as a function of the obscuration at H (panel a) and of the dust optical depth (panel b). The range of observational values is marked by the two horizontal lines. The models of dust/emitter distribution are coded as in Figure The Dust Opacity of Star-Forming Galaxies, but only the case of the SMC extinction curve and of the starburst obscuration curve are shown.
The UV-to-IR SED of a 1 Gyr constant star formation population, attenuated by the starburst obscuration curve (equation 8), is shown for increasing amounts of dust: E(BV)gas=0.05 (blue, continuous), 0.20 (blue dashed), 0.40 (black), 0.55 (red dashed), and 0.75 (red continuous). All SEDs are arbitrarily normalized to the flux density at 0.17 m. The infrared SED is schematically represented by a single-temperature dust component with T=50 K and =2 (panel a) and T=40 K and =1.5 (panel b), to highlight differences in the long–wavelength regime.
| DustaaThe dust geometrical distribution: spherical, plane-parallel slab, double-exponential, or arbitrary. | MediumbbThe structure of the dust, i.e., homogeneous or clumpy (clumpy media can be two-phase or multi-phase). | StellarccThe distribution of the stellar population: central to the dust distribution, diffuse through the spherical dust distribution (with variable scale length), plane-parallel, double-exponential, or arbitrary. In most cases, a single SED is assumed and multiple stellar populations are not included. | Reference | ExtinctionddThe adopted extinction curve(s): MW=Milky Way; LMC=Large Magellanic Cloud; SMC=Small Magellanic Cloud; All=MW,LMC,SMC. | Comments |
|---|---|---|---|---|---|
| Geometry | Structure | Distrib. | Curves | ||
| spherical | homog. | central/ | |||
| spherical | Witt, Thronson & Capuano (1992) | MW | multiple density profiles, | ||
| multiple scale-lengths | |||||
| Rowan-Robinson & Efstathiou (1993) | starburst/IR modelling, | ||||
| central source only | |||||
| Wise & Silva (1996) | multiple scale-lengths | ||||
| Városi & Dwek (1999) | also external source | ||||
| Ferrara et al. (1999a) | MW,SMC | multiple dust/star density | |||
| profiles | |||||
| Efstathiou et al. (2000) | starburst/IR modelling, | ||||
| multiple spheres, central | |||||
| source only | |||||
| Witt & Gordon (2000) | MW,SMC | updated albedo/phase | |||
| function values | |||||
| spherical | clumpy | central/ | |||
| spherical | Witt & Gordon (1996) | MW | central source only | ||
| Városi & Dwek (1999) | also external source | ||||
| Witt & Gordon (2000) | MW,SMC | updated albedo/phase | |||
| function values | |||||
| plane-paral. | homog. | plane-paral. | Bruzual, Magris & Calvet (1988) | MW,LMC | multiple scale-heights |
| Disney, Davies & Phillips (1989) | no scattering | ||||
| Di Bartolomeo, Barbaro & Perinotto (1995) | MW | multiple scale-heights | |||
| Xu & Buat (1995) | multiple scale-heights | ||||
| expon. | homog. | expon. | Kylafis & Bahcall (1987) | MW | edge-on only, isothermal |
| vertical distribution | |||||
| Disney, Davies & Phillips (1989) | no scattering | ||||
| Byun, Freeman & Kylafis (1994) | MW | stellar bulge, multiple | |||
| scale lengths/heights | |||||
| Corradi, Beckman & Simonneau (1996) | MW | face-on only | |||
| Kuchinski et al. (1998) | MW | stellar bulge | |||
| Ferrara et al. (1999a) | MW,SMC | stellar bulge, multiple | |||
| scale lengths/heights | |||||
| expon. | clumpy | expon. | Kuchinski et al. (1998) | MW | stellar bulge |
| Silva et al. (1998) | MW | stellar bulge, IR | |||
| modelling | |||||
| Bianchi et al. (2000) | MW | clumping of stars as well | |||
| arbitrary | homog./ | arbitrary | |||
| clumpy | Trewhella, Madore & Kuchinski (1999) | Multi-phase clumpy medium | |||
| and emitters | |||||
| Gordon et al. (2001); Misselt et al. (2001) | All | Multi-phase clumpy medium | |||
| and emitters, polarization, | |||||
| IR modelling |
| Line | , | L/LaaVariations in the ratio due to variations in the gas temperature between 5000 K and 20000 K amount to 5%–10% (Osterbrock, 1989). | k()k() |
|---|---|---|---|
| Ratio | (m,m) | ||
| H, H | 0.6563,0.4861 | 2.87 | 1.163 |
| H, H | 0.6563,0.4340 | 6.16 | 1.628 |
| Br, H | 2.166,0.4861 | 0.0302 | 3.352 |
| Br, Pa | 2.166,1.282 | 0.175 | 0.457 |
| Pa, H | 1.876,0.6563 | 0.123 | 2.104 |
| Galaxy Type | Ldust/LbolaaFraction of the bolometric radiation absorbed and/or scattered by dust. | A0.15,fbbFace-on attenuation, in magnitudes, at the specified wavelength/band. The B-band and I-band values are derived from various authors (see text). The other wavelengths are from model 4 for E/S0s, and from model 5 of section 2.2 for disks and irregulars. | A0.15ccInclination-averaged attenuation for the disk and irregular galaxies, from model 5 of section 2.2. For observational data at 0.15 m, see Bell & Kennicutt (2001). | AB,fbbFace-on attenuation, in magnitudes, at the specified wavelength/band. The B-band and I-band values are derived from various authors (see text). The other wavelengths are from model 4 for E/S0s, and from model 5 of section 2.2 for disks and irregulars. | ABccInclination-averaged attenuation for the disk and irregular galaxies, from model 5 of section 2.2. For observational data at 0.15 m, see Bell & Kennicutt (2001). | AI,fbbFace-on attenuation, in magnitudes, at the specified wavelength/band. The B-band and I-band values are derived from various authors (see text). The other wavelengths are from model 4 for E/S0s, and from model 5 of section 2.2 for disks and irregulars. | AIccInclination-averaged attenuation for the disk and irregular galaxies, from model 5 of section 2.2. For observational data at 0.15 m, see Bell & Kennicutt (2001). | AK,fbbFace-on attenuation, in magnitudes, at the specified wavelength/band. The B-band and I-band values are derived from various authors (see text). The other wavelengths are from model 4 for E/S0s, and from model 5 of section 2.2 for disks and irregulars. | AKccInclination-averaged attenuation for the disk and irregular galaxies, from model 5 of section 2.2. For observational data at 0.15 m, see Bell & Kennicutt (2001). |
|---|---|---|---|---|---|---|---|---|---|
| E/S0 | 0.05–0.15 | 0.10–0.20 | 0.05–0.10 | 0.02–0.04 | 0.02 | ||||
| Sa–Sab | 0.40–0.65 | 0.90–1.25 | 0.20–0.40 | 0.50–0.75 | 0.10–0.15 | 0.30–0.40 | 0.05 | 0.15 | |
| Sb–Scd | 0.45–0.65 | 0.60–0.80 | 1.20–1.45 | 0.30–0.50 | 0.65–0.95 | 0.15–0.20 | 0.40–0.45 | 0.05–0.10 | 0.15–0.20 |
| Irr | 0.25–0.40 | 0.30–0.45 | 0.60–0.75 | 0.10–0.15 | 0.30–0.40 | 0.05 | 0.15 | 0.02 | 0.06 |
Note. — The table columns list: (1) The pair of hydrogen emission lines; (2) the vacuum wavelengths of the two lines; (3) their intrinsic luminosity ratio for temperature T=10,000 K and case B recombination (Osterbrock, 1989); (4) the differential extinction between the two wavelengths, for a foreground non-scattering dust screen and a MW extinction curve for diffuse ISM (Cardelli, Clayton & Mathis, 1989). Note that k(V)=3.1 and k(H)=2.468.
| Name | D | Morphology | Lbol | SFR | Ldust/Lbol | A0.15 | AB | AI | AHα |
|---|---|---|---|---|---|---|---|---|---|
| (Mpc) | (L⊙) | (M⊙ yr-1) | (mag) | (mag) | (mag) | (mag) | |||
| The Dust-Rich StarburstsaaExamples of three dust-rich (top) and three dust-poor (middle) starbursts in the UV-selected sample of Calzetti, Kinney & Storchi-Bergmann (1994). The obscuration properties of these two extremes can be compared with those of an average UV-selected starburst (last line of Table). Dustier systems are associated with more luminous host galaxies (Heckman et al., 1998). | |||||||||
| NGC1614 | 74. | SBc, merger. | 4.8E+11 | 54.9 | 0.91 | 5.67 | 2.78 | 1.20 | 3.08 |
| NGC4194 | 40. | IBm, merger | 1.1E+11 | 9.9 | 0.86 | 3.20 | 1.57 | 0.68 | 1.74 |
| NGC6090 | 135. | Sd, merger | 4.1E+11 | 52.4 | 0.88 | 3.41 | 1.67 | 0.72 | 1.85 |
| The Dust-Poor StarburstsaaExamples of three dust-rich (top) and three dust-poor (middle) starbursts in the UV-selected sample of Calzetti, Kinney & Storchi-Bergmann (1994). The obscuration properties of these two extremes can be compared with those of an average UV-selected starburst (last line of Table). Dustier systems are associated with more luminous host galaxies (Heckman et al., 1998). | |||||||||
| NGC1140 | 23. | IBm | 9.1E+09 | 1.1 | 0.59 | 0.83 | 0.40 | 0.17 | 0.45 |
| NGC1510 | 12. | SA0 | 8.1E+08 | 0.06 | 0.42 | 0.52 | 0.25 | 0.11 | 0.28 |
| Tol1924416 | 44. | Irr | 1.9E+10 | 2.8 | 0.42 | 0.52 | 0.25 | 0.11 | 0.28 |
| The Average UV-Selected StarburstaaExamples of three dust-rich (top) and three dust-poor (middle) starbursts in the UV-selected sample of Calzetti, Kinney & Storchi-Bergmann (1994). The obscuration properties of these two extremes can be compared with those of an average UV-selected starburst (last line of Table). Dustier systems are associated with more luminous host galaxies (Heckman et al., 1998). | |||||||||
| 1.60 | 0.78 | 0.34 | 0.86 | ||||||
| Parameter | SMMJ140110252 | MS 1512cB58 | West MMD11 | L∗ LBG | |
|---|---|---|---|---|---|
| 1 | z | 2.565 | 2.729 | 2.982 | 3 |
| 2 | ABR | 21.25aaThe AB magnitudes of SMMJ14011 and MS 1512cB58 are not corrected for the lens magnification factor. ABR of MS 1512cB58 is at the observer’s wavelength 0.654 m (Ellingson et al., 1996), and has intrinsic value AB24.5. | 20.41aaThe AB magnitudes of SMMJ14011 and MS 1512cB58 are not corrected for the lens magnification factor. ABR of MS 1512cB58 is at the observer’s wavelength 0.654 m (Ellingson et al., 1996), and has intrinsic value AB24.5. | 24.05 | 24.5 |
| 3 | G | 0.69bbThe G color of SMMJ140110252 has not been corrected for the opacity of the intervening Lyman Forest (Adelberger & Steidel, 2000). | 0.72 | 0.80 | 0.6 |
| 4 | 0.74ccAs derived by Adelberger & Steidel (2000). | 1.34ddDerived from =1.10 using equation B2. was directly measured from the UV spectrum kindly provided by M. Pettini & C. Steidel (2000, private communication). | 0.90eeDerived by convolving a 1 Gyr constant star formation synthetic SED reddened by Ly Forest and dust absorption with the G and bandpasses (moved to the galaxy’s restframe) until the observed color is reproduced, and then fitting a power law through the UV windows of Calzetti, Kinney & Storchi-Bergmann (1994). | 1.5ffFrom Figure 12 of Adelberger & Steidel (2000). | |
| 5 | A0.16,star | 3.1 | 1.8 | 2.7 | 1.5 |
| 6 | E(BV)star(UV) | 0.31 | 0.18 | 0.27 | 0.15 |
| 7 | E(BV)star(H) | 0.10.1ggThe measured H/H emission line ratio of MS 1512cB58 (Teplitz et al., 2000b) yields E(BV)star=0.03. | 00.2 | ||
| 8 | Fpred(IR) | 3.7E13 | 2.3E13 | 1.9E14 | 3.2E15 |
| 9 | fobs(450) | 427 | 2223 | 10 | |
| 10 | fpred(450)hhDerived for dust temperature T=50 K and emissivity =2 (left hand-side value), and for T=40 K and =1.5 (right hand-side value). | 25.9, 71.6 | 19.5, 51.9 | 2.1, 5.3 | 0.36, 0.89 |
| 11 | fobs(850) | 152 | 4 | 5.51.4 | 1 |
| 12 | fpred(850)hhDerived for dust temperature T=50 K and emissivity =2 (left hand-side value), and for T=40 K and =1.5 (right hand-side value). | 4.0, 19.0 | 3.2, 14.6 | 0.4, 1.6 | 0.06, 0.27 |
| Age (Myr) | ||
|---|---|---|
| 2 | 2.70 | 2.68 |
| 5 | 2.50 | 2.61 |
| 10 | 2.45 | 2.57 |
| 15 | 2.30 | 2.55 |
| 30 | 2.09 | 2.50 |
| 50 | 1.93 | 2.45 |
| 100 | 1.61 | 2.38 |
| 300 | 0.20 | 2.28 |
| 500 | 2.26 | |
| 900 | 2.23 |