ISO Observations of the dusty quasar BR1202-0725
Abstract
We present mid- and far-IR photometry of the high-redshift (z=4.69) dusty quasar BR1202-0725. The quasar was detected in the near-IR, at a flux level (0.70.2 mJy) consistent with an average Radio-Quiet Quasar at it’s redshift. Only upper limits for the emission were obtained in the far-IR. These upper limits, when combined with data from ground-based telescopes, are the first direct evidence for a turn-over in the far-IR emission and hence confirm that a black-body dominates the SED at FIR wavelengths. This black-body is most probably cool dust, constrained to have a temperature below 80K, for a of 1.5.
keywords:
galaxies : active – galaxies : photometry – infrared : galaxies – quasars : individual : BR1202-07251 Introduction
It came as a surprise when groups working with IRAS data, e.g. Soifer et al. [1984] & Lawrence et al. [1986], discovered galaxies with bolometric luminosities equivalent to those of quasars but emitting predominantly in the infra-red wavelength region. Even more surprising was the discovery by Rowan-Robinson et al. [1991] of IRAS FSC 10214+4724, a galaxy at a redshift of z=2.29 with an apparent IR luminosity of 41014 L⊙. While F10214+4724 has turned out to be gravitationally lensed [1996], leading to a lower luminosity of 21013 L⊙, it is still of extreme luminosity.
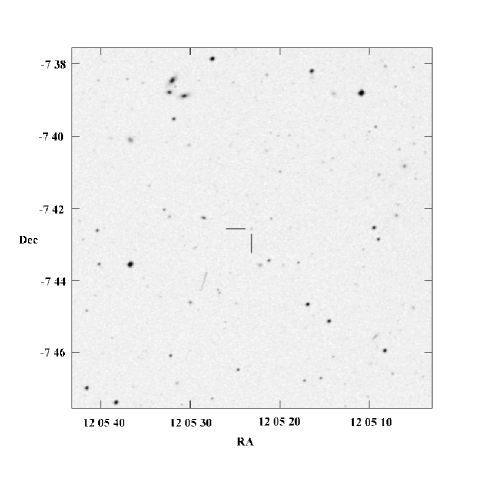
Five high-redshift radio-quiet QSO’s were selected, primarily from an APM catalogue, by McMahon et al. [1994] because their similarity to F10214+4724 in redshift and overall properties made them natural objects in which to look for IR-emission from dust. BR1202-0725 (see figure 1 for a DSS image of the quasar and surrounding field), at a redshift of 4.69, was the only one to be detected at 1.25 mm with IRAM. Assuming the detection was due to dust and that the dust had a single temperature (80K was assumed), McMahon et al. [1994] derived a dust mass of the order of 4108 M⊙, a considerable amount of dust to exist at such an early epoch. If the far-IR spectrum of BR1202-0725 is similar to that of F10214+4724 then it has an IR luminosity of the order of 1014L⊙, making it one of the most luminous objects in the universe.
Later IR observations of this object by Isaak et al. [1994] at 450, 800 & 1100 , and by Benford et al. [1999] at 350 microns, supported a slightly lower dust temperature of 68K and 507 K respectively, although none of these observations saw the turnover of the emission to confirm that it comes from a black-body. Indeed, its spectral index of 2.70.4 between 1100 and 800, calculated by Isaak et al., does not formally rule out synchrotron-emission, although a spectral index above 2.5 is difficult to explain by anything other than cool dust.
The detection of CO emission from approximately 11011M⊙ of molecular hydrogen (comparable to that in a present-day luminous galaxy) by Ohta et al. [1996] and Omont et al. [1996b], and the detection by Omont et al. [1996b] of a close companion also containing large amounts of molecular gas, further reinforced the idea that the galaxy was undergoing a large burst of star formation, possibly interaction triggered.
2 Observations and data reduction
2.1 Observing Strategy
The observations of BR1202-0725 had two goals: to try and detect the turnover in the far-IR emission; and to detect the near-IR emission from the continuum to better determine the underlying power-law. Early predictions from Isaak et al. [1994] were for flux densities in the 100 – 200 range to reach of the order of 100 mJy, depending on dust temperature. We therefore proposed to make observations through the wideband C90 and C160 filters (centred at 90 and 170 ) of the ISOPHOT instrument [1996] on-board ESA’s Infrared Space Observatory (ISO, Kessler et al. 1996). It was hoped these two far-IR observations would lie either side of the peak of the emission.
The ISOCAM instrument, described in Cesarsky et al. [1996], was used to obtain a single observation through the LW10 (8 – 15 ) filter with the aim of detecting the near-IR emission of BR1202-0725. A normal RQQ quasar with the redshift of BR1202-0725 would have a flux of approximately 1mJy in this band, and the ISOCAM observation was therefore planned to reach that sensitivity by employing the microscanning mode.
2.2 Observations
Observations, listed in Table 1, were performed on July 14 1996. The ISOCAM observation was taken in microscanning mode, with the field-of-view of the instrument scanned over the object of interest in a 33 raster pattern. The detector was read out every 2.1 seconds, leading to redundancy in the dataset. The redundancy is used to distinguish glitches and other artifacts from valid sources. The ISOPHOT observations were taken as PHT32 rasters of size 34. The ISOCAM [1999] and ISOPHOT [2000] Handbooks give complete descriptions of these observing modes.
| Observation | TDT | Wavelength | Filter | Exposure |
|---|---|---|---|---|
| Mode | number | secs | ||
| CAM01 | 24002102 | 8–15 | LW10 | 348 |
| PHT32 | 24002103 | 90 | C90 | 606 |
| PHT32 | 24002101 | 170 | C160 | 2696 |
2.3 Data reduction
2.3.1 CAM Data Reduction
The data was sliced and dark corrected in the standard way (Delaney 2000), making use of a time-dependent dark correction. A thorough first-order deglitching was performed using an iterative sigma-clipping method (Metcalfe et al. in prep).
No correction was made at this stage for the effects of responsive transients as the existing correction algorithms can adversely affect the S/N for very faint sources. The transient correction was instead made at the end of the data reduction by applying an appropriate scaling factor. This factor was established by transient correcting reference sources identified for this purpose in representative data sets.
Dedicated faint-source processing followed essentially the method described in Altieri et al. [1998] and Metcalfe et al. (in prep).
Long-term baseline drifts were removed by smoothing (via median filtering) the time-history of each individual detector pixel, as sampled by the hundreds of readouts made during the observation, and then subtracting the smoothed baseline from the nominal history. The images recorded at the several raster positions were organised into a cube so that all samples of a given sky-position line-up. For each sky position, this sky-position-vector is then sigma-clipped to give a second-order deglitching which has been found to be extremely effective in removing residual glitches. It should be noted that first-order deglitching acts on the time-history of a detector pixel, as it moves over the sky during a raster. Second-order deglitching acts on the history of samples of each sky position, and so takes implicit advantage of the sampling redundancy of the raster measurement technique. The two deglitching steps are therefore highly complementary. Following this deglitching stage the raster mosaic was constructed straightforwardly from the raster-position-images and standard aperture photometry could be performed on the resulting map.
In order to calibrate the aperture photometry the data were re-processed after inserting a set of fake sources into the raw data cube. These consisted of theoretical model PSFs matched to the optical configuration in use. By performing aperture photometry on these fake sources in a manner identical to that used for the actual source any flux-altering effects of the complex data-reduction algorithm could be calibrated.
The fake-source insertion operation was repeated for a range of fake-source brightnesses. In this way the source strength in ADUgs (ADU per gain per second) in the raw data, corresponding to a given source strength in the reduced map, was determined.
At this point it was only necessary to scale the source strength in the raw data for the effects of responsive transients (as described above) and to apply the standard calibration scaling factor relating ADUgs to incident mJy for each CAM filter (Siebenmorgen et al. 1999), in order to arrive at an estimate of the flux of the target source.
2.3.2 ISOPHOT Data Reduction
The ISOPHOT P32 data was reduced using the PHOT Interactive Analysis (PIA) package including a pre-release version of P32 processing routines developed by R. Tuffs (Tuffs et al. in prep.). Initial data processing (ERD to SCP) used the new P32 processing routines, with the later processing (SCP to AAP) using the standard processing routines. Default values for the reduction parameters were used in both the old and new routines.
Maps were generated using the Trigrid interpolation and the first quartile normalization flat-fielding methods.
3 Results
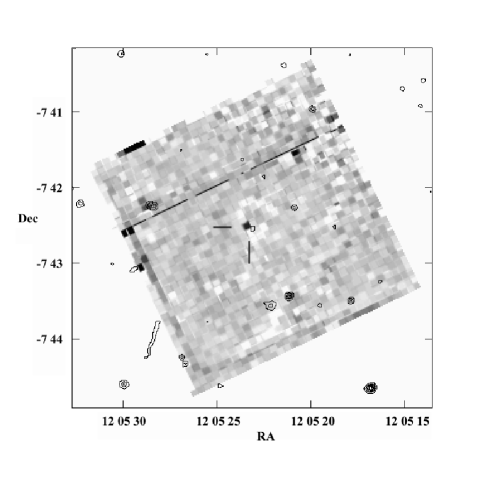
In the ISOCAM dataset, see Figure 2, BR1202-0725 was detected with a flux of 0.7 mJy. Deriving the scatter in photometry of ten randomly placed apertures near the centre of the image produces a 1 value of 0.07 mJy, while the results of the simulations give a (random plus systematic) uncertainty of 0.2 mJy. We therefore take a value of 0.70.2 mJy for the flux from this object in the 8–15 wavelength region. The background flux was determined to be 1.060.1 mJy per sq.arcsec (454 MJy sr-1), consistent with the typical background predictions for CAM LW10 given in the user manual.
Other surrounding sources (visible on the DSS image) are also present in the ISOCAM image. As they are not in the centre of the image the observation was not optimised for them, leading to a higher uncertainty on their detections, and we therefore do not quote fluxes for them.
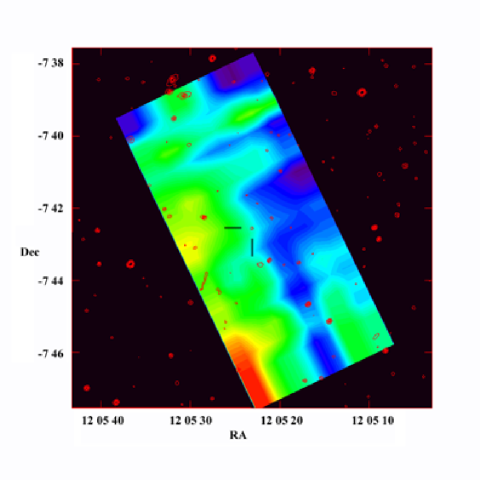
No object was detected at the position of the quasar in either the 90 or 170 datasets. The ISOPHOT 170 map is shown in figure 3. The effective noise in both maps was derived by moving a box the size of one C100 or C200 array pixel over the two maps (avoiding the outer parts of the maps) and converting to Jy. This produced 1 sigma noise values of 16 and 15 mJy at 90 and 170 – effectively the 3 sigma upper limit for both maps is 50 mJy.
Combined results of this and other papers are presented in Table 2. Figure 4 shows the IR data, along with a greybody spectrum at a temperature of 68K. This was derived using the method outlined in Benford et al. [1999], i.e.
with , where = 2.4 THz, the critical frequency at which the source becomes optically thin, and taking = 1.5. The current data does not support the temperature of 50K, with the other parameters, presented in Benford et al. [1999]. It is, however, consistent with the higher temperature of 68K as given in Isaak et al. [1994]. The maximum temperature allowed by the 170 upper limit is 80K, although then the fit to the longer wavelength data becomes poor.
Figure 5, shown as normalised against , extends the previous figure to include the 6cm data. It can be compared with the average spectrum for a Radio-Quiet Quasar given in either Figure 10 of Elvis et al. [1994] or Figure 7 of Polletta et al. [2000]. If we approximately normalise the fluxes of BR1202-0725 at 6cm and R to those of the average RQQ the 15 datapoint is also in agreement, whereas the 350 – 800 fluxes from BR1202-0725 are higher than the average RQQ, indicating the presence of cool dust in this quasar.


| Observed | Rest | Flux | Precision |
|---|---|---|---|
| Wavelength | Wavelength | ||
| mJy | mJy | ||
| 0.651 | 0.114 | 0.094 | – |
| 11.5 | 2.02 | 0.7 | 0.2 |
| 90 | 15.8 | 505 | |
| 170 | 30.6 | 505 | |
| 3502 | 61.5 | 106 | 7 |
| 4503 | 79.1 | 92 | 38 |
| 8003 | 141 | 50 | 7 |
| 11003 | 193 | 21 | 5 |
| 12501 | 220 | 10.5 | 1.5 |
| 12504 | 220 | 12.59 | 2.28 |
| 600001 | 10500 | 0.3 | 0.2 |
. McMahon et al. [1994].
. Benford et al. [1999].
. Isaak et al. [1994].
. Omont et al. [1996a].
. These are 3 upper limits.
4 Conclusions
We have detected the distant, dusty quasar BR1202-0725 in the near-IR and obtained upper-limits for the flux at two far-IR wavelengths. The upper-limits for the flux levels at 90 and 170, when combined with the previous ground-based measurements, are consistent with the far-IR and sub-mm being emitted from a grey-body, most probably arising from dust. The maximum temperature allowed by the 170 upper limit is 80 K, while the probable temperature is 68K.
The near-IR flux level of 0.70.2 mJy at 11.5 is at a level consistent with with originating in a normal quasar at the distance of BR1202-0725.
Acknowledgments
The authors thank Robert Priddey for a fruitful discussion concerning models of BR1202-0725.
This paper is based on observations with the Infrared Space Observatory (ISO). ISO is an ESA project with instruments funded by ESA member states (especially the PI countries: France, Germany, the Netherlands and the United Kingdom) and with the participation of ISAS and NASA.
The ISOPHOT data presented in this paper were reduced using PIA, which is a joint development by the ESA Astrophysics Division and the ISOPHOT Consortium with the collaboration of the Infrared Processing and Analysis Center (IPAC). Contributing ISOPHOT Consortium institutes are DIAS, RAL, AIP, MPIK, and MPIA.
The ISOCAM data presented in this paper were analysed using ‘CIA’, a joint development by the ESA Astrophysics Division and the ISOCAM Consortium. The ISOCAM Consortium is led by the ISOCAM PI, C. Cesarsky.
References
- [1998] Altieri B., Metcalfe L., Ott S., Biviano A, Blommaert J., Delaney M., 1998. ISOCAM Faint Source report (16/Nov/1998) http://www.iso.vilspa.esa.es/users/expl_lib/CAM/fs_report. ps.gz
- [1999] Benford D. J., Cox P., Omont, A., Phillips, T. G., McMahon, R. G., 1999, ApJ 518, L65.
- [1996] Cesarsky C.J. et al., 1996, A&A, 315, L32
- [2000] Delaney M., 2000, ISOCAM Interactive Analysis User’s Manual, Version 4.0 http://www.iso.vilspa.esa.es/manuals/CAM/ users_manual_v4_0.ps.gz
- [1996] Eisenhardt P.R., Armus L., Hogg D.W., Soifer B.T., Neugebauer G., Werner M.W., 1996, ApJ 461, 72.
- [1994] Elvis, M., et al., 1994, ApJS 95, 1.
- [1994] Isaak K.G., McMahon R.G., Hills R.E., Withington S., 1994. MNRAS, 269, L28.
- [1996] Kessler M.F. et al., 1996. A&A, 315, L27
- [2000] Laureijs R., Klaas U., Richards P.J., Schulz B., Abraham P., 2000, ISO Handbook Volume V (PHT), SAI/99-069/Dc, http: //www.iso.vilspa.esa.es/manuals/HANDBOOK/V/pht_hb/
- [1986] Lawrence A. Walker D., Rowan-Robinson M., Leech K. J., Penston M. V., 1986. MNRAS 219, 687.
- [1996] Lemke D. et al., 1996, A&A 315, L64
- [1994] McMahon R. G., Omont A., Bergeron J., Kreysa E., Haslam C. G. T., 1994. MNRAS, 267, L9.
- [1996] Ohta K., Yamada Y., Nakanishi K., Kohno K., Aklyama M., Kawabe R., 1996. Nat. 382, 426.
- [1996a] Omont A., McMahon R. G., Cox P., Kreysa E., Bergeron J., Pajot F., Storrie-Lombardi L. J., 1996. A&A 315, 1.
- [1996b] Omont A., Petitjean, P., Guilloteau, S., McMahon R. G., Solomon, P.M., Pecontal, E., 1996. Nat. 382, 428.
- [2000] Polletta M., Courvoisier T.J.-L., Hooper E.J., Wilkes B.J., 2000. A&A 362, 75.
- [1991] Rowan-Robinson M., et al., 1991. Nat. 351, 719.
- [1999] Siebenmorgen R., Blommaert J., Sauvage M., Starck J-L., 1999, ISO Handbook Volume III (CAM), SAI-99-057/Dc, http://www.iso.vilspa.esa.es/users/expl_lib/CAM_top.html
- [1984] Soifer T., et al., 1984. ApJ 278, L71.