Bubbles, Feedback and the Intra-Cluster Medium: Three-Dimensional Hydrodynamic Simulations
Abstract
We use a three dimensional hydrodynamical code to simulate the effect of energy injection on cooling flows in the intracluster medium. Specifically, we compare a simulation of a 1015 cluster with radiative cooling only, with a second simulation in which thermal energy is injected 31 kpc off-centre, over 64 kpc3 at a rate of for 50 Myr. The heat injection forms a hot, low density bubble which quickly rises, dragging behind it material from the cluster core. The rising bubble pushes with it a shell of gas which expands and cools. We find the appearance of the bubble in X-ray temperature and luminosity to be in good qualitative agreement with recent Chandra observations of cluster cores. Toward the end of the simulation, at 600 Myr, the displaced gas begins to fall back toward the core, and the subsequent turbulence is very efficient at mixing the low and high entropy gas. The result is that the cooling flow is disrupted for up to Myr after the injection of energy ceases. Thus, this mechanism provides a very efficient method for regulating cooling flows, if the injection events occur with a 1:1 duty cycle.
keywords:
galaxies: formation – galaxies: clusters: general – cooling flows – intergalactic medium – X-rays: galaxies: clusters – methods: numerical1 Introduction
Radiative cooling in clusters of galaxies makes the distribution of gas unstable. As the gas in the centre of the cluster radiates its internal energy, the pressure support in the outer parts is reduced and a flow is established. In cluster centres, the cooling time is short compared to the age of the cluster, which makes this an important mechanism for accreting gas onto a central object. The astrophysical puzzle is to understand how the high flow rates that have been estimated for some clusters (up to 2000 per year, e.g. Allen 2000) can be compatible with the relatively small masses of cold gas and young stars seen in central cluster objects [Crawford et al. 1995, Edge et al. 1999, Wilman et al. 2000], or with the lack of gas seen at temperatures below about 2 keV (eg., Peterson et al. 2001; Tamura et al., 2001; Oegerle et al. 2001).
In smaller mass haloes, cooling flows are expected to be the mechanism by which individual galaxies form. However, a similar problem to that observed in clusters exists, in that the short cooling times imply that a large fraction of the total baryonic mass should have been able to cool in a Hubble time. This is in conflict with observations which show that only a small fraction of baryons are now in this cold form [Fukugita et al. 1998, Balogh et al. 2001].
A popular solution to these problems is the suggestion that gas cooling might trigger heating processes (feedback) which regulate the cooling flow (eg., White & Frenk 1991). For example, cooling gas is likely to lead to star formation, which returns energy to the intracluster medium (ICM) via supernovae and stellar winds; also, cooling gas accreted onto black holes might fuel highly energetic, relativistic jets. These processes might either reheat the gas from the cold phase, or reduce the cooling rate, therefore limiting the fraction of baryons which can cool; this can have important consequences for the evolution of clusters and the formation of galaxies (eg., Ponman, Cannon & Navarro 1999; Valageas & Silk 1999; Bower et al. 2001).
Although there are many physical processes known which may be viable sources of feedback energy, it is unknown exactly how such injections of energy interact with the surrounding gas. In particular, there are three possible outcomes of an energy injection event: (1) the energy may serve to increase the total emissivity of the gas (for example, by compressing surrounding material), resulting in all of the input energy radiating away; (2) the energy may be concentrated in a small amount of gas that then escapes from the cluster core but has little effect on the cooling flow; (3) the injected energy may disrupt the cooling flow, either temporarily or permanently. Only in the third instance is the mechanism going to be effective at solving the problems described above; the focus of this work is to determine what happens to energy injected in clusters with substantial cooling flows.
Advances in computing power have recently made detailed simulations of feedback viable, and there has consequently been a lot of work studying the phenomenon with two-dimensional hydrodynamical simulations. Kritsuk et al. [Kritsuk et al. 2001] studied the effect of supernova injecta on cooling flows on galactic scales, and showed that overlapping supernovae within the galaxy created a turbulent convection zone that effectively mixed gas in the inner regions, reducing the entropy profile and the central cooling rate. Churazov et al. [Churazov et al. 2001] consider the specific case of the galaxy M31, and study in detail the dynamics of buoyant bubbles within a model galaxy, and their influence on the surrounding medium. However, their simulations do not include radiative cooling, and are therefore unable to address the ability of such bubbles to influence the cooling rate. Reynolds, Heinz & Begelman [Reynolds et al. 2001] investigated the behaviour of supersonic energy sources in cooling flow clusters, concentrating on the interaction of radio jets with the intra-cluster medium.
All of the recent simulations discussed above find that energy injection results in buoyant bubbles which displace and disturb the surrounding gas. In this paper, our purpose is to investigate in detail the effect that energy injection into the ICM has on the cooling rate of the surrounding gas. We present the first fully three-dimensional simulations which include radiative cooling and sporadic energy injection on cluster scales. The three dimensional nature of the simulations is essential to ensure that realistic convective flows are established, and turbulent mixing of the multiphase gas is properly modelled. In §2 we present the details of the numerical model, and our method for simulating energy injection. The results of two simulations, one with and one without energy injection, are presented in §3. A quantitative analysis of the results, and qualitative comparison with Chandra observations are presented in §4. Our conclusions are summarized in §5.
2 Simulations
2.1 Numerical Code
We use the three dimensional Eulerian fixed-grid hydrodynamical code described in Quilis et al. [Quilis et al. 1996]. The code uses modern high-resolution shock-capturing (HRSC) techniques, which are specially designed to integrate hyperbolic systems of equations as the hydrodynamic equations. The HRSC techniques have important advantages over some other techniques. The practical implementation of the code has four key ingredients: i) conservative formulation; that is, numerical quantities are conserved up to the numerical order of the method, ii) the reconstruction procedure, which allows to recover the distribution of the quantities inside the computational cells, iii) the Riemann solver, which solves the evolution of discontinuities at cell interfaces, and iv) the time advancement, which is designed to be consistent with the conservation properties. The main advantage of HRSC codes is the use of Riemann solvers to compute the numerical viscosity needed to solve the hydro equations. This numerical viscosity is given internally by the method and does not require any guess at the form of the viscosity (the so called “artificial viscosity” required by other methods). The numerical viscosity given by Riemann solver based methods is small and therefore these methods can resolve strong shocks extremely well (typically in one or two cells) as the diffusion is reduced dramatically compared with methods based on other prescriptions for the numerical viscosity. Other important advantages of HRSC techniques are that they work very well in low density regions, and they are of high-order in smooth regions of the flow.
The nature of the feedback process presents important challenges to the numerical code. Specifically, the sporadic injection of large amounts of energy in a very small volume could produce shocks and large jumps in the hydrodynamical quantities which must be accurately resolved. Large jumps in density are also produced by turbulent mixing and radiative cooling, as well as the propagation of the bubble which generates sound waves. Our hydrodynamical code was specially designed for an accurate treatment of fluid dynamical processes and is extremely good in dealing with shocks, strong discontinuities, turbulent regions, and low density regimes. Therefore, it is a good tool to tackle the problem addressed in this paper.
The system of hydrodynamic equations needs a equation of state in order to be closed. We adopt the equation of state for an ideal gas, , where is the pressure, the adiabatic exponent, the density, and the specific internal energy. Considering the range of temperatures and densities of the ICM, we model the ICM gas as a non-relativistic monatomic fluid with . Although this assumption is reasonable – especially at the resolution of our simulations – it neglects the role of magnetic fields which might lead to more long-lived bubbles (Fabian et al. 2001). Magnetohydrodynamic interactions cannot be addressed with our present code.
2.2 Initial Conditions
We run two simulations of a cluster, using a grid of cells in a cube 1 Mpc per side, corresponding to a cell size of . The simulations are carried out on an Origin 2000 parallel computer, and follow the cluster evolution over a simulated time of 900 Myr. We assume a Hubble constant of km s-1.
The initial cluster profile is constructed assuming that isothermal gas sits in a dark matter potential well in pressure-supported hydrostatic equilibrium. For the dark matter potential we assume the modified-NFW profile found in high resolution simulations [Moore et al. 1998, Lewis et al. 2000]. The virial radius, 2.55 Mpc, is computed using the formalism described in Babul et al. [Babul et al. 2001], assuming a cosmology with , , and km s-1. We assume a concentration parameter , which implies that the “core” of the potential is 25% of the virial radius, or 640kpc. The gas temperature is set to the virial temperature of the halo, keV. We assume that the mass fraction of gas within the virial radius is given by , where is the universal baryon density, as determined from deuterium abundances by Burles, Nollett & Turner [Burles et al. 2001]. The bolometric X-ray luminosity of this model cluster is ergs s-1, where the emissivity is computed using the model of Raymond, Cox & Smith [Raymond et al. 1976]. Model clusters based on these assumptions agree quite well with observed scaling relations of dynamical and X-ray properties of massive clusters, though they are less suitable in low mass systems [Babul et al. 2001]. In order to break the spherical symmetry of this model, we introduce randomly 10% fluctuations in the gas density.
The boundary conditions are treated with an inflow/outflow condition. Practically, this means that the values at the boundary cells are determined by copying the values of their inner neighbours. Our results are insensitive to the boundary conditions, however, because the energy injection event occurs far from any boundary, and the simulation is not run long enough for effects at the edge to be felt in the centre. We have verified that other reasonable choices of boundary conditions do not have significant effects on our conclusions.
2.3 Energy injection
We choose to inject a quantity of energy in a region which is displaced from the cluster centre; this choice is conservative in the sense that it is less likely to be successful at disrupting the cooling flow than if we had deliberately targeted the heating on the lowest entropy gas. This will ensure that we distinguish between scenarios (2) and (3) discussed in the introduction: will a bubble of energetic gas not centred on the cooling flow have any influence on that flow?
Our model is not intended to investigate the interaction of the AGN jet with the surrounding material [Reynolds et al. 2001], so we simply model the heating process by injecting energy centered on a cell which is displaced 8 cells () from the cluster center. The heating is distributed over the surrounding pixels using a spherical (SPH-like) kernel with smoothing length 8 cells. The heating rate was chosen to be of the same order as the cooling rate of the cluster: ; this is expected to be typical of the energy injection from radio jets (e.g. Owen, Eilek & Kassim 2000). Heating at a much larger rate results in an explosive detonation with much of the energy being radiated in a dense shell (Reynolds et al. 2001); at a lower rate the heat input is unlikely to affect the cluster cooling flow.
The heat input is continued for 50 Myr, by which time a near empty bubble has been formed in the ICM. It is then switched off so that the energy can be distributed around the cluster. This is motivated by the desire to model a scenario in which the AGN (or other feedback source) is “woken-up” by gas deposited in the cooling flow. This disrupts the flow which turns off the supply of fresh material and hence limits its lifetime.
2.4 Integrated quantities from two dimensional slices
The simulations shown in this paper are fully 3D. Although we seed the initial conditions with random fluctuations and the source of energy is located off-centre, the results of our simulation show a high axial symmetry in their gross details.
This degree of symmetry has beneficial consequences on the amount of computational resources needed, as we can compute integrated quantities such as entropy, mass or luminosity from 2D slices, avoiding the need to store huge 3D outputs. Consequently, a better tracking of the time evolution of these quantities is also possible as a larger number of outputs can be saved.

The axisymmetric approximation necessarily introduces some error when computing integrated quantities from the 2D slices instead of from the full 3D data set. In order to quantify this, and to justify the validity of the approximation, we have computed the relative error of the X-ray luminosity computed from three orthogonal 2D slices – extracted from the 3D full data – assuming axial symmetry, with respect to the X-ray luminosity computed from the whole 3D box. Figure 1 shows the evolution of the relative error as a function of time for 5 outputs where we have the full 3D output. In any case errors are larger than 6%. Other quantities, such as density, show even smaller errors. The axisymmetry of the problem does not obviate the use of 3D simulations as mixing processes at the gas interface, for example, may be more correctly modelled, though still symmetric.
3 Results
3.1 Cooling Simulation
The first simulation that we run includes radiative cooling, but without any extra energy input. The flow quickly becomes established (at 50 Myr) and continues at a steady rate for the duration of the simulation. The cluster collapses slowly as the energy is radiated (see Figure 3); as matter flows into the central region, its luminosity increases, and the mass-weighted mean entropy falls. These effects, including the steepening density profile of the cluster core, have been seen previously (eg., Knight & Ponman, 1997; Lewis et al. 2000; Pearce et al. 2000; Kritsuk et al., 2001).
3.2 Feedback Simulation
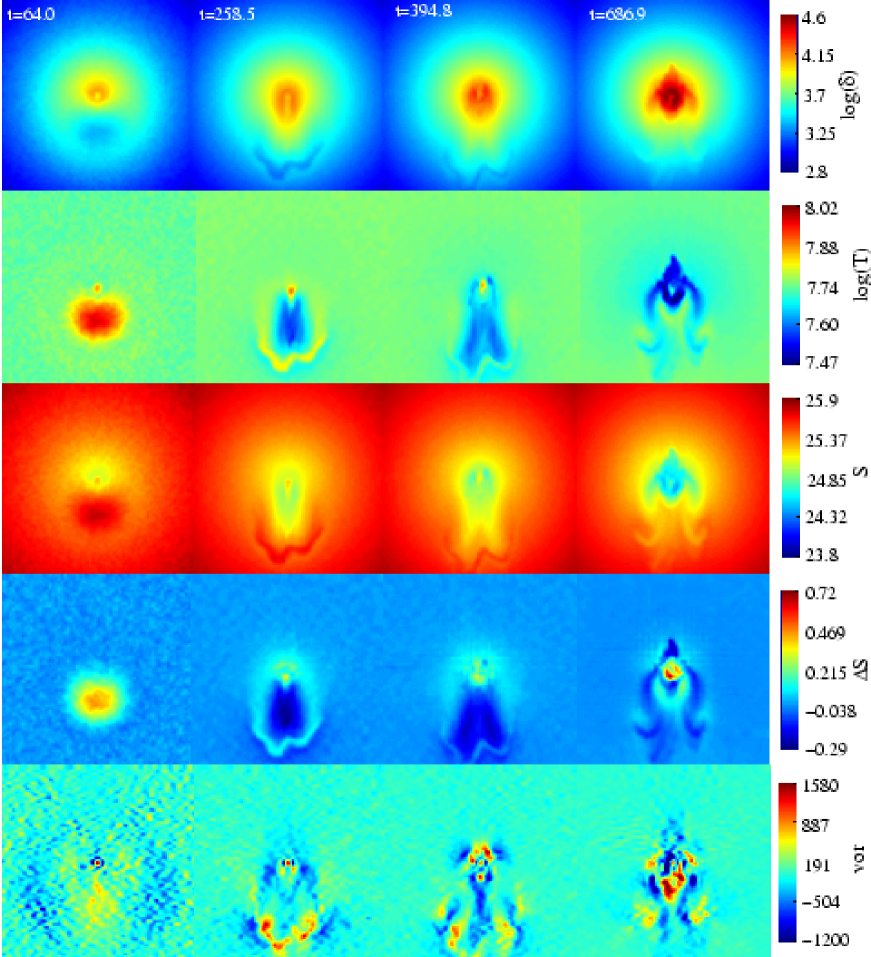
In this simulation, energy is injected into a single cell over 50 Myr as described in §2.3. We display the evolution of the gas properties in a two-dimensional slice in Figure 2. The top three rows show the gas density contrast, temperature and entropy, at 4 different times. The full three-dimensional simulation is approximately axisymmetric about the -axis of these slices.111A movie displaying the formation and evolution of the bubble can be seen at the web site http://star-www.dur.ac.uk/quilis/movies/bubble_den.mpg. The movie shows the time evolution (in units of years) of the logarithm of the overdensity.
The energy injected heats a relatively small amount of mass, , to K, creating a hot but almost empty bubble. In effect, the bubble is generated by a subsonic wave expanding into the cooling ICM (a sonic boom in the terminology of Reynolds et al. 2001). In the simulation, the energy injection is sufficiently weak that the bubble expands subsonically, pushing gas out of the cluster centre. Since this gas is moving adiabatically from a high pressure region to one of lower pressure, it expands and cools. This results in a shell of gas around the bubble which is cooler than the surrounding material. As we elaborate upon in §4.2, this is qualitatively similar to Chandra observations in some clusters (e.g. Fabian et al. 2000, 2001). Unlike the simulations of Reynolds et al. [Reynolds et al. 2001], the cold shell is not due to the displacement of already cold gas, although the result is similar.
Once the heat source is turned off (at 50 Myrs), the bubble ceases to expand, but does not collapse. The buoyancy of the bubble compared to the surrounding material takes over as the dominant force, pushing it outward from the centre of the simulation. This causes the bubble to adopt a cap-like geometry; roughly a semi-spherical shell of gas with a low density, low pressure interior. This is similar to the geometry found in the simulations of Churazov et al. [Churazov et al. 2001]; in their case, the force of the rising material behind the bubble is strong enough to punch through and cause the shell to become a torus. The surface of the shell in our simulation experiences turbulent mixing with the surroundings. The shell rises until its entropy becomes comparable to the surrounding medium, at which point it dissolves into the surrounding ICM. This occurs well within the core region of the cluster ().
In order to better illustrate the effect of the bubble on the entropy distribution of the cluster, we have taken a slice through the cluster showing the difference between the entropy of the ‘feedback’ simulations and the ‘cooling’ simulations. This is shown in the fourth row (d) of Figure 2; these plots show the effect of the bubble more clearly by subtracting away the entropy gradient in the initial profile and the entropy decrease due to cooling. The initial, localised entropy increase resulting from the energy injection is clearly seen in the first panel. Subsequently, the entropy difference of the bubble becomes less apparent: as it rises, the surrounding gas has higher entropy and the contrast of the bubble declines. Eventually, the heated material reaches a point at which it mixes with the surrounding material and disappears.
As a result of the low pressure region created behind the bubble as it rises, a plume of low entropy material (darker blue colour) is drawn out of the core (see also Churazov et al. 2001). This gas, although not heated directly, becomes mixed into the higher entropy gas surrounding the cluster, slightly depressing the entropy on scales of 50–100kpc. But the entropy of the very central gas (within ) is higher in the feedback simulation, relative to the cooling-only simulation. This is because, in the cooling-only simulation, the dense core gas has radiated its energy and dropped in entropy; this cooling has been prevented in the simulation with feedback, resulting in a relatively higher core entropy.
The core is significantly disturbed by the rising of the bubble, and turbulent mixing of gas in this region becomes efficient. To demonstrate the efficiency of mixing, we show the vorticity of the gas in the bottom panel (e) of Figure 2. During the initial formation of the bubble, the vorticity is low, and largely due to the density fluctuations in the initial conditions. As the bubble rises, mixing occurs predominantly at the edge of the shell. By the end of the simulation, some of the gas drawn out by the bubble has begun to fall back onto the cluster centre, dragging with it higher entropy material from the outer regions into the now-turbulent core. The cluster centre is then a region of high vorticity, and plays an important role in mixing the high and low entropy gas in an irreversible process, thus generating a net increase in the entropy of the cluster core. It is also at this time that cooling in the central regions, which had been disturbed by the initial expansion of the bubble, once again becomes strongly established.
4 Discussion
4.1 Numerical Analysis

In this section we look at the evolution in the integrated properties of the model cluster. We focus on a sphere centered on the cluster that encloses all of the bubble material at 500 Myr (corresponding to a radius of kpc). Figure 3 shows the evolution of this enclosed mass, the mass-weighted entropy and the luminosity of the system. These quantities are computed from the two dimensional slices shown in Figure 2, using the approximation of axisymmetry, because of the limited number of large, fully-three dimensional outputs (see §2.4).
The mass enclosed within the boundary evolves similarly in the two simulations, increasing by about 10% due to the infall of gas as the densest core gas radiates its energy. At late times in the simulation with heating, a small amount of mass , , is pushed out of the region by the rising plume of gas.
Concentrating on the mass-weighted mean entropy of the system, the initial effect of the heat injection can be clearly seen. This small rise in entropy is not sufficient to prevent the cooling of the core, which subsequently continues at a rate similar to that in the cooling only simulation. The primary effect of the bubble is therefore to delay the entropy evolution of the the system. At the end of the heated simulation, the average entropy is the same as that of the unheated model 100 Myrs earlier.
We set out to distinguish between three possible fates of the injected energy: 1) the energy is quickly radiated away, resulting in an increase in X-ray luminosity; 2) the bubble escapes from the cluster core without affecting the cluster core, in which case the rate of energy radiation is unchanged; or 3) the heating event disrupts the cooling flow, reducing the X-ray luminosity. The dominant effect in our simulations is scenario 3): the injected energy temporarily disrupts the cooling flow, but is not immediately radiated away, nor does it escape the cluster core. In the cooling-only run, a total ergs have been radiated by the end of the simulation, compared with only ergs in the run with energy injection. The difference is ergs. This is 55% of the total energy injected. The total energy of the cluster differs between the two simulations by 1.55 times the total energy injected.
Since the cooling flow is re-established about 50 Myr after the heating source is shut off, this mechanism can only be effective at substantially reducing the cooling rate over a Hubble time if there are multiple heating events. Observations show that about 40 per cent of central cluster galaxies show strong line emission, indicative of either star formation or nuclear activity, which could potentially heat the surrounding gas [Johnstone et al. 1987, Heckman et al. 1989, McNamara & O’Connell 1993, Crawford et al. 1999]. This suggests that a duty cycle of 1:1 for the heating events is not unreasonable. In our cluster model, if such 50 Myr heating periods were initiated every 100 Myr, a total energy of 6.28 keV would be injected into the cluster within a Hubble time (13 Gyr). This corresponds to 0.9 keV per baryonic particle within the virialized radius, which compares well with the energy required to explain the slope of the observed X-ray luminosity-temperature correlation [Wu et al. 1998, Ponman et al. 1999, Balogh et al. 1999].
4.2 X-ray Observations
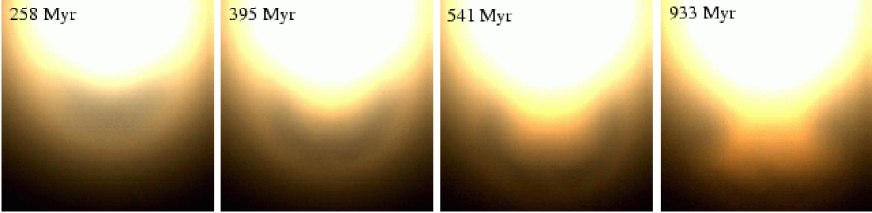
Recent Chandra observations have provided empirical evidence for bubbles in the ICM [Fabian et al. 2000, McNamara et al. 2000]. In Figure 4 we show the projected X-ray emissivity of the heated cluster simulation as a time sequence from 258 to 933 Myr. The intensity of the image reflects the surface brightness across the cluster as it would appear in soft energy X-rays, and is created by projecting the X-ray emissivity through the volume of the simulation. The colour the illustrates the luminosity weighted temperature in each region.
At 258 Myr, a warm, low emissivity bubble is just visible. The low contrast of the bubble reflects the large contribution to the emissivity made by the gas in front of and behind the bubble. At this time, our simulation already has a steeply rising density profile towards the centre, so the central regions are saturated in this image.
As the bubble becomes thinner and more shell-like, it becomes better defined in the X-ray image (eg., the central panels show 395 and 541 Myr). The material surrounding the bubble has similar temperature to the undisturbed cluster gas, so that shell surrounding the bubble cannot be seen directly. This is in good qualitative agreement with the observations of [Fabian et al. 2000]. Because of the high gas density in the core of our simulation, the plume of material that is drawn out of the core is easily visible as a distortion of the symmetry of the X-ray distribution.
The final panel shows the cluster at a late time (933 Myr). At this time, the bubble is no longer visible, having dissipated into the surrounding ICM. The disturbance of the cluster remains visible as a plume of cooler gas. Despite the sharp contrast in density, this material is in pressure equilibrium with its surroundings. Sharp features such as this are reminiscent of the surface brightness discontinuities seen in the cores of some clusters, for example A2142
5 Conclusions
We have presented results from the first fully three dimensional simulations of feedback in a cluster model, including the effects of radiative cooling. The heating model has been successful at regulating the cooling of the ICM. We have seen that the energy injected is not immediately radiated and that, although only a small amount of gas is involved in the formation of the bubble, its effect is felt throughout the cluster core. The aim of these simulations has been to quantify the effectiveness of this form of energy injection, and we summarize our findings as follows:
(1) The effect of the delay to the cooling lasts Myr after the initial energy injection event finishes, i.e., an amount of time equivalent to the time over which energy was supplied. Therefore, a 1:1 duty cycle of heating events would be very effective in regulating the radiative cooling process.
(2) There is still a net radiation of energy in both simulations. Measuring energy relative to the cooling-only simulation shows that the cooling flow has been disrupted, and the injected energy has been efficiently mixed into the surrounding ICM: the radiated energy never exceeds the energy radiated in the “no feedback” case, and none of the heated bubble material is convected out of the cluster. Although our simulations have not directly reduced the flow rate over timescales of Myr, the efficiency and timescale over which the cooling flow is disrupted makes it seem likely that multiple events will be very effective at regulating the cooling rate.
Three dimensional simulations are an essential component of the present model, despite the axisymmetry of these results. In particular, the modelling of turbulence, which is crucial to the mixing of high and low entropy gas, could not be properly described by a two dimensional code. A more detailed description of the host cluster may also have important consequences on this model. For example, modelling the expected mass substructure, distributed asymetrically in small orbiting lumps, may increase the efficency of energy mixing by helping to destroy the pressure-confined bubble. Accurate modelling of the these processes will requires three dimensional simulations such as the one we have presented here.
The next step in this work is to simulate multiple energy events over cosmological timescales, with a full hierarchical merger-history. It will also be interesting to see if this mechanism is equally effective on galaxy scales, and thus able to limit the fraction of baryons which cool globally to a number which is in agreement with the tight observational constraints [Balogh et al. 2001].
Acknowledgments. We would like to thank Sebastian Heinz for useful discussions. VQ is a Marie Curie Fellow (grant HPMF-CT-2000-00052). MLB acknowledges support from a PPARC rolling grant for extragalactic cosmology at Durham. Simulations were carried out as part of the Virgo consortium on COSMOS an Origin 2000.
References
- [Allen 2000] Allen, S. W.: 2000, MNRAS 315, 269
- [Babul et al. 2001] Babul, A., Balogh, L., M., Lewis, G. F., & Poole, G. B.: 2001, MNRAS p. submitted
- [Balogh et al. 1999] Balogh, M. L., Babul, A., & Patton, D. R.: 1999, MNRAS 307, 463
- [Balogh et al. 2001] Balogh, M. L., Pearce, F. R., Bower, R. G., & Kay, S. T.: 2001, MNRAS submitted
- [Bower et al. 2001] Bower, R., Benson, A. J., Baugh, C. M., Cole, S., Frenk, C. S., & Lacey, C. S.: 2001, astro-ph/ 0006109
- [Burles et al. 2001] Burles, S., Nollett, K. M., & Turner, M. S.: 2001, ApJL 552, L1
- [Churazov et al. 2001] Churazov, E., Brggen, M., Kaiser, C. R., Bhringer, H., & Forman, W.: 2001, astro-ph/ 0008215
- [Crawford et al. 1999] Crawford, C. S., Allen, S. W., Ebeling, H., Edge, A. C., & Fabian, A. C.: 1999, MNRAS 306, 857
- [Crawford et al. 1995] Crawford, C. S., Edge, A. C., Fabian, A. C., Allen, S. W., Bohringer, H., Ebeling, H., McMahon, R. G., & Voges, W.: 1995, MNRAS 274, 75
- [Edge et al. 1999] Edge, A. C., Ivison, R. J., Smail, I., Blain, A. W., & Kneib, J. .: 1999, MNRAS 306, 599
- [Fabian et al. 2000] Fabian, A. C., Sanders, J. S., Ettori, S., Taylor, G. B., Allen, S. W., Crawford, C. S., Iwasawa, K., Johnstone, R. M., & Ogle, P. M.: 2000, MNRAS 318, L65
- [Fabian et al. 2001] Fabian, A. C., Sanders, J. S., Ettori, S., Taylor, G. B., Allen, S. W., Crawford, C. S., Iwasawa, K., & Johnstone, R. M.: 2001, MNRAS 321, L33
- [Fukugita et al. 1998] Fukugita, M., Hogan, C. J., & Peebles, P. J. E.: 1998, ApJ 503, 518
- [Heckman et al. 1989] Heckman, T. M., Baum, S. A., van Breugel, W. J. M., & McCarthy, P.: 1989, ApJ 338, 48
- [Johnstone et al. 1987] Johnstone, R. M., Fabian, A. C., & Nulsen, P. E. J.: 1987, MNRAS 224, 75
- [Knight & Ponman 1997] Knight, P. A. & Ponman, T. J.: 1997, MNRAS 289, 955
- [Kritsuk et al. 2001] Kritsuk, A., Plewa, T., & Mueller, E.: 2001, astro-ph/ p. 0008017
- [Lewis et al. 2000] Lewis, G. F., Babul, A., Katz, N., Quinn, T., Hernquist, L., & Weinberg, D. H.: 2000, ApJ 536, 623
- [McNamara & O’Connell 1993] McNamara, B. R. & O’Connell, R. W.: 1993, AJ 105, 417
- [McNamara et al. 2000] McNamara, B. R., Wise, M., Nulsen, P. E. J., David, L. P., Sarazin, C. L., Bautz, M., Markevitch, M., Vikhlinin, A., Forman, W. R., Jones, C., & Harris, D. E.: 2000, ApJL 534, L135
- [Moore et al. 1998] Moore, B., Governato, F., Quinn, T., Stadel, J., & Lake, G.: 1998, ApJL 499, L5
- [Oegerle et al. 2001] Oegerle, W. R., Cowie, L., Davidsen, A., Hu, E., J., H., E., M., K., S., & B., W.: 2001, astro-ph/ 0106279
- [Owen et al. 2000] Owen, F. N., Eilek, J. A., & Kassim, N. E.: 2000, ApJ 543, 611
- [Pearce et al. 2000] Pearce, F. R., Thomas, P. A., Couchman, H. M. P., & Edge, A. C.: 2000, MNRAS 317, 1029
- [Peterson et al. 2001] Peterson, J. R., Paerels, F. B. S., Kaastra, J. S., Arnaud, M., Reiprich, T. H., Fabian, A. C., Mushotzky, R. F., Jernigan, J. G., & Sakelliou, I.: 2001, A&A 365, L104
- [Ponman et al. 1999] Ponman, T. J., Cannon, D. B., & Navarro, J. F.: 1999, Nature 397, 135
- [Quilis et al. 1996] Quilis, V., Ibáñez, J. M., & Sáez, D.: 1996, ApJ 469, 11
- [Raymond et al. 1976] Raymond, J. C., Cox, D. P., & Smith, B. W.: 1976, ApJ 204, 290
- [Reynolds et al. 2001] Reynolds, C. S., Heinz, S., & Begelman, M. C.: 2001, ApJL 549, L179
- [Tamura et al. 2001] Tamura, T., Kaastra, J. S., Peterson, J. R., Paerels, F. B. S., Mittaz, J. P. D., Trudolyubov, S. P., Stewart, G., Fabian, A. C., Mushotzky, R. F., Lumb, D. H., & Ikebe, Y.: 2001, A&A 365, L87
- [Valageas & Silk 1999] Valageas, P. & Silk, J.: 1999, A&A 350, 725
- [White & Frenk 1991] White, S. D. M. & Frenk, C. S.: 1991, ApJ 379, 52
- [Wilman et al. 2000] Wilman, R. J., Edge, A. C., Johnstone, R. M., Crawford, C. S., & Fabian, A. C.: 2000, MNRAS 318, 1232
- [Wu et al. 1998] Wu, K. K. S., Fabian, A. C., & Nulsen, P. E. J.: 1998, MNRAS 301, L20