Measurements of light transmission in deep Sea with the AC9 trasmissometer
Abstract
The NEMO Collaboration aims to construct an underwater Čerenkov detector in the Mediterranean Sea, able to act as a neutrino telescope. One of the main tasks of this project, which implies difficult technological challenges, is the selection of an adequate marine site. In this framework the knowledge of light transmission properties in deep seawater is extremely important. The collaboration has measured optical properties in several marine sites near the Italian coasts, at depths 3000 m, using a set-up based on a AC9, a commercial trasmissometer, manufactured by WETLabs. The results obtained for the two sites reported in this paper (Alicudi and Ustica), show that deep seawater optical properties are comparable to those of the clearest waters.
keywords:
neutrino telescope , NEMO , attenuation , absorption , deep seaPACS:
95.55.Vj , 29.40.Ka , 92.10.Pt , 07.88.+y, , , , , , , , , , , , , , , , and .
1 Overview
The observation of Ultra High Energy Cosmic Rays (UHECR) with energy higher than 1020 eV has attracted the attention of the astrophysics and particle-physics community on the most energetic phenomena taking place in the Universe. It is supposed that such energetic particles are accelerated in extra-galactic sources.
Gamma ray sources with energy up to tens of TeV have also been observed. If high energy photons are generated through the production and decay of neutral pions, it is reasonable to expect, from the same sources, an associated flux of high energy neutrinos, generated through the production and decay of charged pions. Along their journey in the universe, most part of the electromagnetic and hadronic emission is deflected or absorbed by the electromagnetic background and by the intergalactic and interstellar matter. Neutrinos, on the contrary, are not significantly absorbed by the intergalactic medium and are not deflected by the intergalactic magnetic fields. Already in 1960 Markov markov1960 ; markov1961 proposed to use seawater as a huge target to detect UHE neutrinos, looking at their charged current weak interactions. The outgoing lepton generates, along its path in seawater, Čerenkov light that can be detected by a lattice of optical sensors. The reconstruction of the muon track, and thus of the neutrino direction, offers the possibility to identify the neutrino sources opening the new exciting field of neutrino astronomy. The observation of high energy neutrino fluxes expected from astrophysical sources requires a detector with an effective area close to 106 m2 instrumented along a distance comparable to the range in water ( km) of the high energy muons ( 1000 TeV). The identified neutrino sources identified could be catalogued in the sky map and eventually compared with the known gamma sources. The construction of a detector of such dimensions, usually called a km3 Neutrino Telescope, is one of the main challenges of astroparticle physics today. The Mediterranean Sea offers optimal conditions, on a worldwide scale, to locate an underwater neutrino telescope. The choice of the km3 scale neutrino telescope location is such an important task that careful studies of candidate sites must be carried out in order to identify the most suitable one. Along the Italian coasts several sites exist, at depth m, that are potentially interesting to host an undersea neutrino telescope. In these sites we have studied deep seawater optical properties (absorption and attenuation) and environmental properties: water temperature and salinity, biological activity, water currents, sedimentation. In this paper we report light transmission measurements carried out in two sites named Ustica (during November 1999) and Alicudi (on December 1999), in the Southern Tyrrhenian Sea, located at:
-
•
N E, North-Est of Ustica island;
-
•
N E, North of Alicudi island.
2 Optical properties of deep sea
Water transparency to electromagnetic radiation can be characterized by means of quantitative parameters: the absorption length and the scattering length . Each length represents the path after which a photon beam of intensity at wavelength , travelling along the emission direction, is reduced to by absorption or diffusion phenomena. These quantities can be directly derived by the simple relation:
| (1) |
where is the optical path traversed by the beam and the source intensity. In literature absorption () and scattering () coefficients are extensively used to characterize the light transmission in matter as well as the attenuation coefficient () defined as:
| (2) |
The main cause of light absorption in water is excitation of vibrational states of the water molecule by photons duntley1963 ; Warren1984 ; Braun1993 : due to such process the photon energy is entirely deposited in the traversed medium. Scattering refers to processes in which the direction of the photon is changed without any other alteration. Scattering phenomena in which the photon wavelength changes (e.g. Raman effect) happen less frequently. Scattering can take place either on molecules (Rayleigh scattering) or on dissolved particulate (Mie scattering).
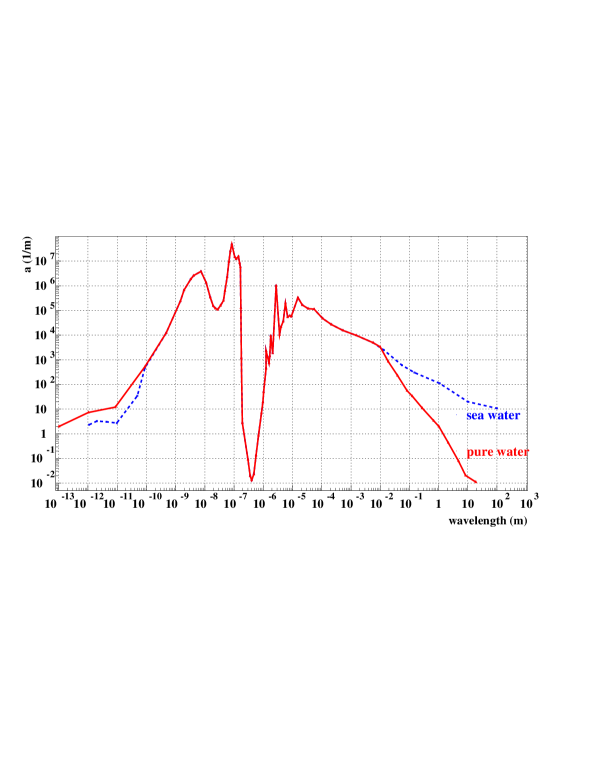
In pure water, light absorption and scattering are strongly wavelength dependent. In particular light transmission in pure water is extremely favored in the range 350 550 nm, overlapping the region in which PMTs usually reach the highest quantum efficiency. In the visible region of the electromagnetic spectrum light absorption steeply decreases as a function of wavelength and reaches its minimum at about 420 nm (see figure 1). This is the reason why seawater has a blue-green color.
The optical properties of natural seawater are functions of water salinity, water temperature and of the concentration of dissolved organic and inorganic matter. Light absorption and diffusion in water as a function of salinity and temperature have been extensively studied pegau97 . It has been noticed that, for nm, the dependence of scattering coefficient on temperature and salinity is negligible while the variation of the absorption coefficient is significant, in particular at nm (for details see §7). The seawater diffusion and absorption coefficients can be parameterized as the sum of a term due to optically pure water (i.e. water without dissolved particulate) at defined conditions of temperature and salinity (), and a term that accounts for interaction of light with particulate ():
| (3) |
| (4) |
Optical measurements of deep seawater have shown that the presence of particulate has a negligible effect on light absorption but it enlarges the light diffusion coefficient. Since water temperature and salinity and particulate concentration may vary significantly in different marine sites it is extremely important to measure optical parameters in situ.
3 The AC9 trasmissometer
We performed attenuation and absorption measurements of light in deep seawater by means of a set-up based on a trasmissometer: the AC9 manufactured by WETLabs Wetlabsmanual . The device compactness (68 cm height 10.2 cm diameter) and its pressure resistance (it can operate down to 6000 m depth) are excellent for our purposes. The AC9 performs attenuation and absorption measurements independently using two different light paths and spanning the light spectrum over nine different wavelengths (412, 440, 488, 510, 532, 555, 650, 676, 715 nm). In our measurements we obtain an accuracy in and of about m-1.
The AC9 attenuation and absorption measurement technique is based on the Lambert’s law of collimated beams (see equation 1) where is the beam path-length, is the intensity of the collimated primary beam, at a given wavelength , and is the beam intensity measured at distance , as a result of absorption or attenuation effect respectively.
In order to produce collimated monochromatic light beams, the instrument is equipped with an incandescence lamp and a set of collimators and nine monochromatic ( 10 nm) filters . Two different beams are available at the same time for independent measurements of attenuation and absorption. Each beam is split in two parts by a mirror: the reflected one reaches a reference silicon photon detector. The refracted one crosses a quartz window and enters inside a 25 cm long pipe. During deep sea measurements seawater fills the pipes (flow tubes). The flow tube used for attenuation measurements has a black inner surface in order to absorb all photons scattered by seawater. A collimated silicon photon detector (angular acceptance ) is placed at the end of the path, along the source axis. Thanks to this strongly collimated layout the end-path detector receives only photons which have not interacted (neither absorbed nor scattered). The reference detector measures the source intensity , the end-path detector measures the attenuated beam intensity , is the known beam path in water (0.25 m). The attenuation coefficient is therefore calculated as:
| (5) |
In the absorption channel, the inner surface of the absorption flow tube behaves like a cylindrical mirror. The light scattered by seawater is reflected and redirected towards a wide angular acceptance silicon photon detector. In first approximation all scattered photons are detected and the ratio between the intensities and is only a function of the seawater absorption coefficient .
Using AC9 data, the scattering coefficient can be calculated by subtracting the absorption value from the attenuation value at each given wavelength (see equation 2).
4 AC9 measurements principles
In the interval of wavelength interesting for a Čerenkov neutrino telescope, nm, the expected values of absorption and attenuation coefficients in deep seawater are m-1, very close to the pure water ones. This implies that the instrument should have sensitivity and accuracy of the order of m-1. The calibration of the instrument plays the most important role in determining the accuracy in measurements. In the above defined wavelength range, pure water optical properties have been extensively measured, therefore pure water can be assumed as a reference medium Kou1993 ; Pope93 .
Instrumental effects - such as the status of optical windows, of the electronics, etc.- can also be studied filling the flow tubes with a medium with a negligible light absorption and attenuation (e.g. dry air or ).
The instrument calibration can be, thus, performed and tested any time filling the flow tubes with a medium with known optical properties: either pure water (pure water calibration) or (air calibration). Filling the flow tubes with pure water we measure, for example in the absorption channel, the values:
| (6) |
and, in the case of ,
| (7) |
The extra-term takes into account the light absorption in the instrument optics (that is function of the status of quartz windows and mirror surfaces) and all other instrumental effects (see §7). This means that this term can vary with time and can be a function of the internal electronics temperature. The same argument is valid for the attenuation channel.
With pure water inside the flow tubes the measurement of AC9 can be set equal to the known values of and . The result of the water calibration procedure is a set of 18 calibration constants (for the nine absorption and attenuation channels) that represent the working status of AC9. The AC9 internal software subtracts these coefficients to the actual reading of the instrument such that each AC9 output value, when reference water fills the flow tubes, should be equal to zero.
Filling the flow-tubes with sea water we measure:
| (8) |
| (9) |
Then the values of AC9 output corresponding to the case of deep sea water filling the flow tubes are:
| (10) |
| (11) |
5 AC9 calibration procedure
The AC9 manufacturer (WETLabs) provides the instrument calibration performed with de-ionized and de-gassed pure water, at given temperature (C), as referenced in Kou1993 ; Pope93 . The optical properties of this medium, at the nine wavelengths relevant for the AC9, are listed in table 1. Wetlabs provides also the results of the instrument calibration performed with dry air. The set of constants that relate the water calibration values to the air calibration ones are provided by WETLabs.
In principle, in order to test, from time to time, the validity of the used set of water calibration constants, the user should check the AC9 response after filling the flow tubes with pure water in reference conditions. However, since pure water is not easily available during cruises, we check the calibration of the AC9 in dry air testing the validity of air calibration constants after having filled the flow tubes with high purity grade . We extensively perform these operations during naval campaigns before every deployment.
| (nm) | 412 | 440 | 488 | 510 | 532 | 555 | 650 | 676 | 715 |
|---|---|---|---|---|---|---|---|---|---|
| (10-3 m-1) | 5.4 | 8.3 | 17.7 | 38.2 | 51.6 | 69.0 | 359.4 | 441.6 | 1049.2 |
| (10-3 m-1) | 9.7 | 11.9 | 20.0 | 40.2 | 53.3 | 70.4 | 360.1 | 442.2 | 1049.7 |
We have accurately studied the dependence of air calibration constants as a function of AC9 internal temperature. We noticed that during measurement in the Mediterranean Sea, where at depth m the water temperature is C, the AC9 internal temperature stabilizes at C. To reduce the systematic error in the knowledge of the instrument calibration constants, during checks of air calibration we keep the internal AC9 temperature at C by means of a refrigerator. Figure 2 shows some AC9 measured raw values (analogous to and as defined in equations 10 and 11), as a function of , obtained checking the air calibration just before the first deployment in Alicudi site. In the range CC the , average values are close to zero and RMS are of the order of m-1. These average values (that we call and ) are used as offsets and subtracted during off-line data analysis, as described in the following sections.
6 Deep Sea Setup
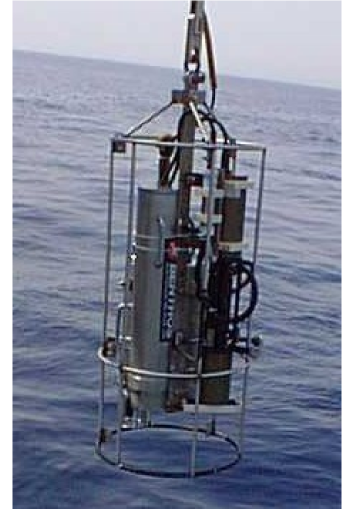
During deep sea measurements the AC9 is connected to a standard oceanographic CTD (Conductivity Temperature Depth) probe, the Ocean MK-317 manufactured by IDRONAUT. A pump is used to ensure re-circulation of seawater inside the AC9 pipes. The AC9 and the pump are powered by a 14 V battery pack. In figure 3 we show the whole set-up mounted on an AISI-316 stainless-steel cage before a deployment.
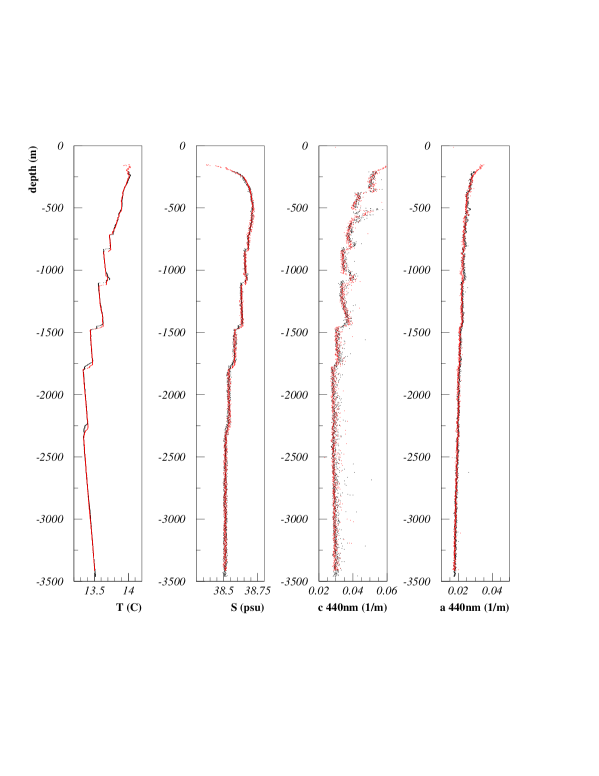
When the system is in operation, the RS-232 stream of the AC9 data is converted into FSK stream by a modem card placed inside the CTD. Data are sent to sea surface through an electro-mechanical cable, that is also used to transmit power to CTD (1 A at 30 VDC). The data acquisition system permits both the AC9 data telemetry and the data storage on a PC onboard the ship. The CTD data (depth, water salinity and temperature) are recorded on a local memory. Both instruments also record an absolute time information, which is used to couple the AC9 and the CTD data during off-line analysis. This procedure allows to relate water optical properties to depth, water salinity and temperature. The CTD-AC9 acquisition program gives about six measurements per second, usually we deploy the set-up at speed of 1 m/s. In figure 4 we show, as function of depth, water salinity and temperature together with the final absolute values of absorption and attenuation coefficient for nm measured during the first (black dots) and the second (red dots) deployments in Alicudi site. As it appears in the figure, the layer composition of Tyrrhenian Sea, well studied by oceanologists in terms of salinity and temperature, is also indicated by the measurements of water optical properties: the AC9 sensitivity permits to distinguish layers of water where absorption and attenuation coefficients vary for m-1.
7 Data Analysis
In order to obtain the values of deep seawater absorption and attenuation coefficients from the measured raw values we need to apply few corrections. The first correction consists in removing the set of calibration constants described in §5:
| (12) |
| (13) |
Further corrections for the attenuation channel could be needed to take into account that the silicon photon detector in the attenuation channel has a finite angular acceptance () and that the inner surface of the attenuation flow tube does not behave as a perfect absorber. These two corrections have been evaluated to be much lower than m-1 that we quote as systematic error associated to the result. Therefore .
The absolute values of the light attenuation coefficients in seawater (as a function of depth) can be finally obtained inverting equations 11.
Concerning the absorption channel, up to now, we considered that the inner surface of the flow tube is perfectly reflecting. This assumption is valid only in first approximation and a proper correction has to be applied to the measured raw values. If the inner mirror is not perfectly reflecting, in presence of light scattering, a fraction of the diffused photons do not reach the end-path detector. We now illustrate how we have evaluated the amount of this effect using AC9 data collected for nm.
Photon diffusion in the absorption channel is also present when the tube is filled with pure water. This implies that, with the described calibration procedure, part of the effect is already accounted for at the calibration time, i.e. the effect of photons diffused at large angle by Rayleigh scattering on molecules.
The presence of particulate in deep seawater results as an additional cause of absorption and diffusion processes; but, at red and infrared wavelengths, the absorption due to the particulate present in deep seawater is negligible Twardowski1999 . It follows that the values at nm and nm, measured by the AC9 in deep seawater, allow us to evaluate the effect of the not perfect reflectivity of the absorption flow tube mirror.
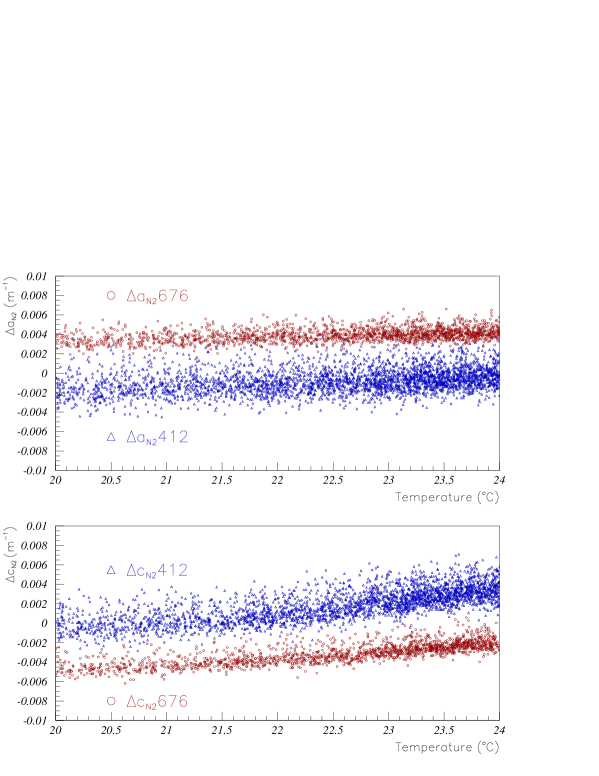
Actually a value of for seawater has to be expected because of the presence of salts and because deep seawater temperature (C in the deep Mediterranean Sea) is not equal to the calibration water temperature (C). The dependence of light absorption and diffusion in water as a function of salinity and temperature has been extensively studied pegau97 . It has been noticed that, for nm, the dependence of on temperature and salinity is negligible; on the contrary the variation of the absorption coefficient can be expressed by the equation:
| (14) |
where C, practical salinity units (p.s.u.), and are the actual values of seawater. The constants and are known as a function of the wavelength pegau97 ; Twardowski1999 : for nm the values are m-1 ∘C-1 and m-1 p.s.u.-1. The slope of the temperature corrections for nm is much larger: m-1 ∘C-1 (while m-1 p.s.u.-1).
We evaluate the correction due to the internal mirror of the absorption flow tube only at nm since the uncertainty on the temperature correction at this wavelength is smaller.
The evaluation of the contribution to the value of due to the photons diffused by particulate and not reflected toward the end-path detector is determined by means of the equation:
| (15) |
The measurement of and , made by the CTD (see §6), allows to evaluate the correction as a function of depth.
It has been suggested Zaneveld94 that the shape and magnitude of the Mie volume scattering function, in first approximation, can be considered almost independent on wavelength for the interval of in which the AC9 operates: the correction due to the mirror effect is, therefore, independent on wavelength. It turns out that can be used to correct the measured values of absorption coefficients for all wavelengths. Applying this correction we obtain:
| (16) |
Finally, adding the pure water absorption () and attenuation () coefficients to the obtained and , we evaluate (as a function of depth) the seawater inherent optical properties:
| (17) |
| (18) |
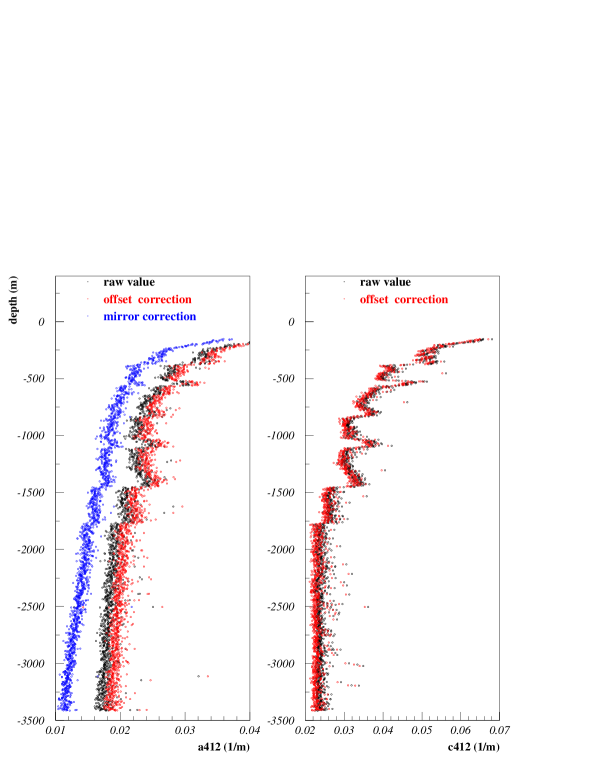
Figure 5, that refers to the second measurement in Alicudi site, illustrates the analysis procedure for nm. As function of depth, we show the raw measured values of the absorption and attenuation coefficients (black dots), the values obtained applying the offset correction (red dots) and the mirror correction (blue dots) for and .
The same analysis has been applied to the values measured at , 488, 510, 532, 650, 676 and 715 nm. The values of and measured in the four deployments carried out in Alicudi and Ustica show very good agreement.
We do not show results for nm due to a temporary hardware problem happened to the interferometric filter during the naval campaign.
In the following we will quantify the optical properties of deep seawater averaging the absorption and attenuation coefficients in the range of depth interesting for a km3 neutrino detector: a 400 m wide interval, with its base m above the seabed.
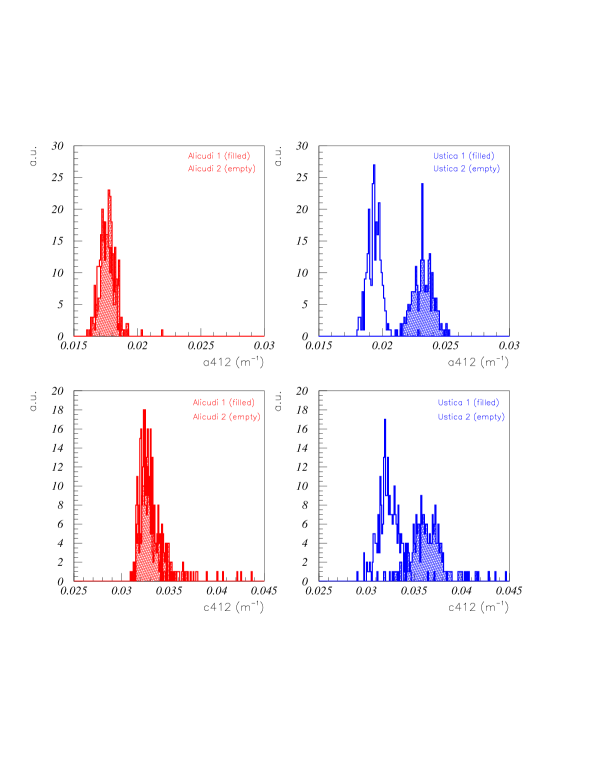
In figure 6 we show, as an example, the distribution of and values, averaged for each meter, in the interval of depth m, related to the deployments in Ustica and Alicudi (seabed depth m for both sites).
In table 2 we list the average values of the distributions of and in the same interval of depth.
| coefficient | Alicudi-1 | Alicudi-2 | Ustica-1 | Ustica-2 |
|---|---|---|---|---|
| a412 | ||||
| c412 | ||||
| a440 | ||||
| c440 | ||||
| a488 | ||||
| c488 | ||||
| a510 | ||||
| c510 | ||||
| a532 | ||||
| c532 | ||||
| a650 | ||||
| c650 | ||||
| a676 | ||||
| c676 | ||||
| a715 | ||||
| c715 |
The statistical errors associated to these values are evaluated from the RMS of the distributions (see, for example, figure 6). The systematic errors, mainly due to the accuracy of the calibration check procedure, have been evaluated to be equal to . The absolute () values can be obtained adding the values of attenuation and absorption of the reference water (see equations 17,18 and table 1).
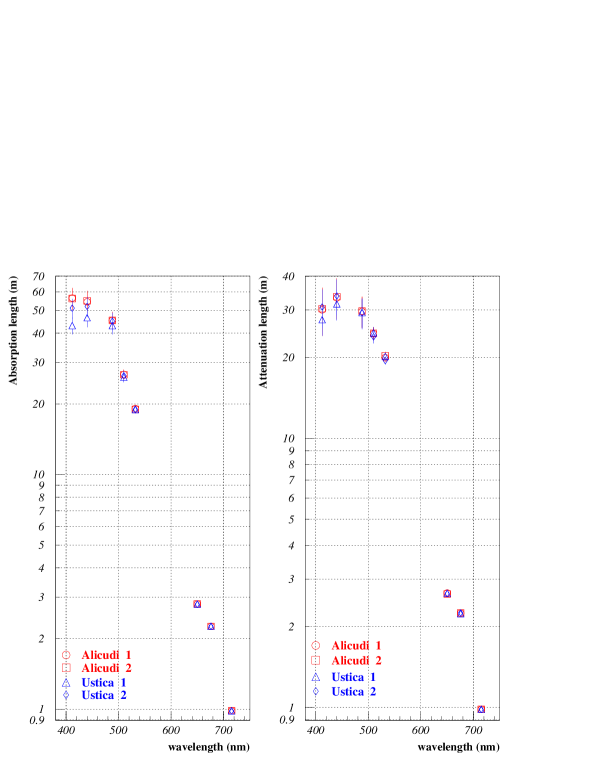
Finally, we present in figure 7 the values of absorption and attenuation lengths, as a function of wavelength, for the same interval of depth.
8 Discussion
The importance of measuring seawater optical properties in situ has been discussed by several authors. The set-up we used permits to evaluate seawater light absorption and attenuation coefficient as a function of depth and wavelength (in the range nm). Accurate calibration checks allow us to obtain an accuracy in the evaluation of and of the order of m-1.
The values of measured in the depth interval of interest in Alicudi and Ustica are very close to the ones reported by Smith and Baker as pure seawater absorption Smith1981 . The discrepancy is less than m-1 at all wavelengths, except at 715 nm where the temperature effect is relevant. Average absorption length for blue light ( and nm) is m; the average attenuation length is m. These values are extremely good when compared to published seawater attenuation values obtained in conditions of collimated beam and detector geometry duntley1963 . The measured blue light attenuation length value is very close to the ones measured by Khanaev and Kuleshov Khanaev1993 in the NESTOR site Resvanis1993 .
On the contrary, our results cannot be compared to the ones published by Bradner et al. Bradner1981 for the DUMAND project, Anassontzis et al. Anassontzis1994 for NESTOR and the ones measured by the ANTARES collaboration Palanque1999 . These measurements were, indeed, carried out in conditions of not collimated geometry and the measured value is a quantity usually called effective attenuation coefficient . This quantity (an apparent optical property) is defined as the sum of absorption and only a fraction of the scattering coefficient:
| (19) |
where is the average cosine of the volume scattering function distribution. This quantity strongly depends on the amount and dimension of the dissolved particulate. Measurements carried in ocean Mobley1994 gives . for NEMO explored sites will be evaluated only after an in situ precise measurement of the volume scattering function scheduled for year 2001.
9 Acknowledgements
The NEMO collaboration wants to thank M. Astraldi, G.P. Gasparini (Istituto di Oceanografia Fisica - CNR, La Spezia) and E. Accerboni, G. Gelsi, B. Manca, R. Mosetti (Istituto Nazionale di Oceanografia e Geofisica Sperimentale, Trieste), M. Leonardi (Istituto Sperimentale Talassografico - CNR, Messina) C. Viezzoli (SOPROMAR) for the fruitful collaboration. We want also to thank Captains V. Lubrano and M. Gentile, officers and crew of the Urania Oceanographic Research Vessel, for their outstanding experience and professionalism shown during the naval campaign.
References
- (1) M.A. Markov, Proceedings of 10th Int. Conf. High Energy Physics, Rochester, (1960).
- (2) M.A. Markov and I.M. Zheleznykh, Nucl. Phys., 27 (1961) 385.
- (3) S.Q. Duntley, J. Opt. Soc. Am., 53 (1963) 214.
- (4) S.G. Warren, Applied Optics, 23 (1984) 1206.
- (5) C.L. Braun and S. N. Smirnov, J. Chem. Edu., 70 (1993) 612.
- (6) C.D. Mobley, Light and Water, Academic Press, San Diego (1994).
- (7) W.S. Pegau, D. Gray and J.R.V. Zaneveld Applied Optics, 36 (1997) 6035.
- (8) WETLabs, AC9 manual in www.wetlabs.com.
- (9) R.M. Pope and E.S. Fry, Applied Optics, 36 (1997) 33.
- (10) L.Kou, D. Labrie and P. Chylek Applied Optics, 32 (1993) 3531.
- (11) R.M. Pope Optical absorption of pure water and sea water using the integrating cavity absorption meter, Ph.D. Thesis, Texas AM, College Station (1993).
- (12) M.S. Twardowski et al., J. of Atm. and Ocean. Tech., 16 (1999) 691.
- (13) J.R.V. Zaneveld and J.C. Kitchen, SPIE Vol. 2258 Ocean Optics XII, 49 (1994).
- (14) R.C. Smith and K.S. Backer, Applied Optics, 20 (1981) 177.
- (15) S.A. Kanaev and A.P. Kuleshov, Proceedings of the 3rd NESTOR Workshop, Pylos (1983).
- (16) L.K. Resvanis, Proceedings of the 3rd NESTOR Workshop, Pylos (1983).
- (17) H. Bradner and G. Blackinton, Applied Optics, 23 (1984) 1009.
- (18) E.G. Anassontzis et al., Nucl. Inst. Met., A349 (1994) 242.
- (19) N. Palanque-Delabrouille, Proceedings of the XXVI International Cosmic Ray Conference, HE 6.3.20, Salt Lake City (1999).