BeppoSAX Observation of NGC 3079
Abstract
Using the BeppoSAX observatory, we have observed a nearby LINER/Seyfert 2 galaxy, NGC 3079, which is known as an outflow galaxy and a bright H2O-maser source. Using the PDS detector, we have revealed that the NGC 3079 nucleus suffers from a Compton-thick absorption, with a hydrogen column density cm-2. After corrected the absorption, the 2–10 keV luminosity becomes erg s-1 at a distance of 16 Mpc. It is 2–3 orders of magnitude higher than that observed in the MECS band (below 10 kev). We also detected a strong Fe-K line at keV with an equivalent width of keV, which is consistent with the heavy absorption.
1 Introduction
NGC 3079 is an edge-on spiral galaxy at our vicinity (16 Mpc at km s-1 Mpc-1). It exhibits AGN and/or starburst activities in various wave band. It is known as an outflow galaxy in radio (Duric & Seaquist 1988), Hα (Veilleux et al. 1994) and X-ray (Pietsch et al. 1998). In optical, it is classified as a LINER (low-ionization nuclear emission region) or a Seyfert 2, but whether the Hα line is broad or not is in controversy (Ho et al. 1997). In far infrared, it is luminous and shows an extended emission, indicating a dominant contribution of the starburst activity (Perez Garcia et al. 2000). In radio, it is a bright H2O-maser source (Nakai et al. 1995; Trotter et al. 1998; Sawada-Satoh et al. 2000).
In X-ray, using the ROSAT and ASCA observatories, Dahlem et al. (1998) and Ptak et al. (1999) reported that the NGC 3079 emission is dominated by a thin-thermal component and a power-law component below and above keV, respectively. The former is attributed to the hot gas in the host galaxy. The latter with 0.4–10 keV luminosity of erg s-1 can be attributed to an assembly of X-ray binaries. Super-nova remnants and hot gas due to the starburst activity can also contribute to the latter component. Therefore, there is little room for the AGN emission in the ASCA spectrum. Due to poor photon statistics, the presence of Fe-K emission line have not been constrained with ASCA.
We inferred that the faintness of the NGC 3079 nucleus in X-ray is due to complete obscuration, and performed a BeppoSAX observation of NGC 3079.
2 Observation and Data reduction
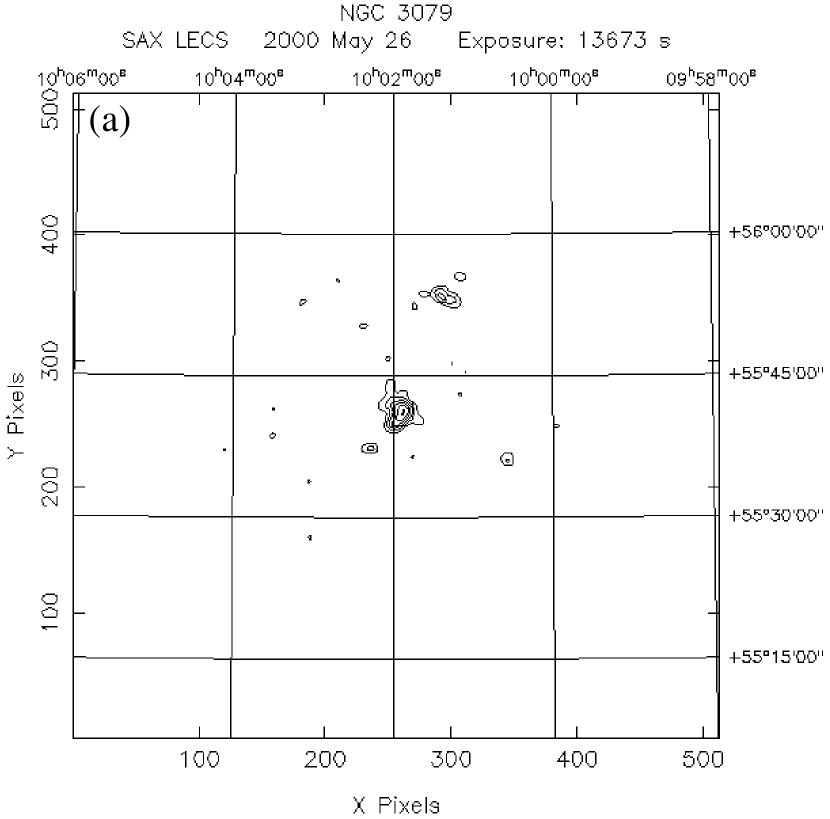
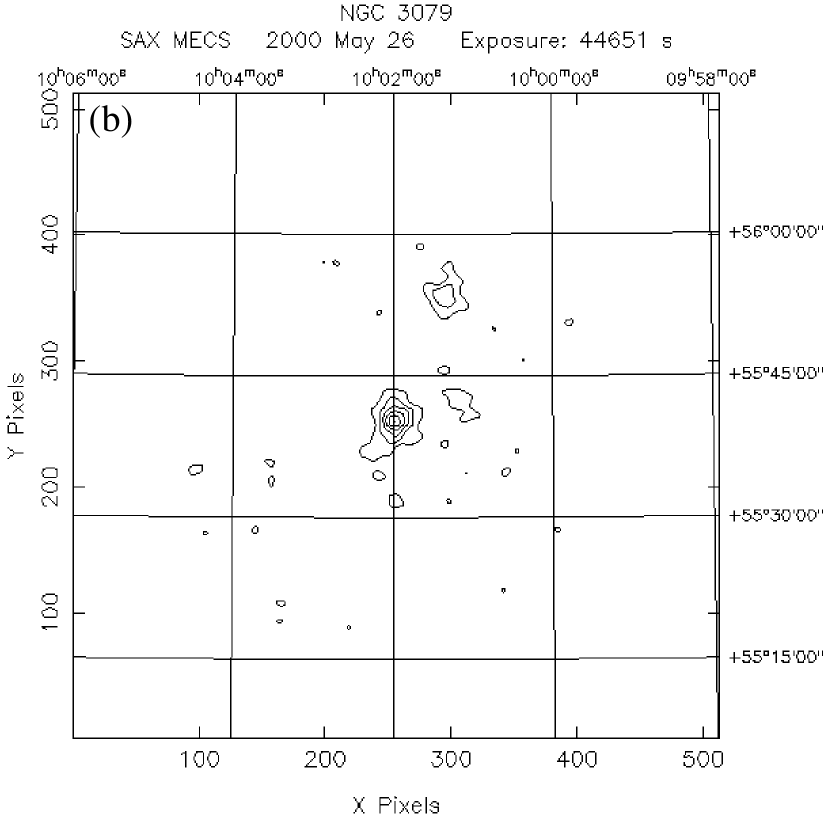
We observed NGC 3079 with BeppoSAX on 26–27 May 2000. The exposure time of LECS, MECS2, MECS3 and PDS are 13.6, 44.5, 44.5 and 21.0 ksec, respectively. The HPGSPC was not operated. Figure 1 shows the LECS and MECS2+3 images of NGC 3079. The brightness peak coincides in position with the radio/optical nucleus. We utilized the LECS and MECS2+3 spectra supplied by the BeppoSAX Science Data Center (SDC), which are integrated around the brightness peak. We utilized the blank-sky files supplied by SDC to subtract the LECS and MECS2+3 backgrounds. We also utilized the PDS spectrum supplied by SDC. We rebinned the spectra to have grater than 15 counts per bin. Net count rate of the LECS, MECS2+3 and PDS are , and count s-1, respectively.
3 Spectra
Figure 2 shows the LECS, MECS2+3 and PDS spectra of NGC 3079. It is clear that the data requires at least three components: a featureless continuum in the LECS and MECS band, a heavily absorbed continuum in the PDS band, and a strong emission line in the MECS band. On the other hand, the soft thin-thermal components that detected in the ROSAT and ASCA spectra are not statistically significant in the BeppoSAX spectra, due to poor statistics at low energy. In this letter, we are not interested in the soft components, so that we deal here with the MECS and PDS spectra only above 2 keV, where the soft component is negligible. Also, we will not examine intrinsic absorption for the MECS-band continuum.
3.1 The MECS spectrum
The MECS continuum above 2 keV is well represented with a power-law having a photon index of . The 2–10 keV luminosity becomes erg s-1. These are consistent with the ASCA results within the model uncertainty. The structure around 6 keV is well reproduced with a Gaussian. Figure 3 shows confidence contours of the Gaussian component. The line center energy of keV is in good agreement with the K-fluorescent line from cold iron. As shown in Model (a) in Table 1, the line width is not resolved with the MECS energy resolution. Therefore, hereafter, we assume that the Fe-K line is narrow (Model b). The equivalent width against the power-law component becomes keV in the 90% confidence level. It is consistent with the ASCA loose upper limit, although no evidence of Fe-K line was observed in the ASCA spectra (Dahlem et al. 1998; Ptak et al. 1999). Such a large equivalent width cannot be observed if the continuum emission from the nucleus is directly seen (e.g. Makishima et al. 1986). Consequently, the strong emission line suggests that the direct emission is completely blocked.
3.2 The PDS spectrum
Indeed, the PDS spectrum exceeds two orders of magnitude over the extrapolation of the best-fit Model of the MECS spectrum. Althogh the PDS has a large beam size (1.4∘ FWHM), we can reasonably conclude that the contribution of contamination sources to the excess is small, as follows. In the MECS image (Figure 1b; 1∘ circular FOV), there are no sources bright enough to explain the PDS excess. For example, the observed flux of the second brightest source in the MECS image, QSO 0957-5608, is 40% of that of NGC 3079, in the MECS band. Similarly, the sources in the ROSAT/PSPC image (2∘ circular FOV) are relatively faint. The 90% upper limits to the 20-100 keV flux of QSO 0957-5608 in the MECS and the other sources in the PSPC are estimated to be and erg cm-2 s-1, respectively. These are two or one order of magnitudes fainter than the PDS flux in the 20–100 keV band. Accordingly, the PDS excess is attributed to a heavily absorbed emission of the NGC 3079 nucleus, unless there are serendipitous Compton-thick sources in the PDS field-of-view.
Therefore, we fitted the PDS spectrum with an absorbed power-law model. Figure 4 shows confidence contours of the power-law component. The photon index is consistent with those seen in Seyfert galaxies, although it is not strictly constrained (Model c). Therefore, hereafter, we fix the photon index at 1.9, a canonical value of Seyfert galaxies (Model d). With the fixed photon index, a heavy absorption with a column density larger than cm-2 is required. After corrected the absorption, the 2–10 keV and 20–100 keV luminosities become and erg s-1, respectively. These are two orders of magnitude higher than that observed in the MECS band.
In the spectral fitting, we considered only the photoelectric absorption, using the “wabs” model in XSPEC. In such a Compton-thick environment, however, the Compton scattering becomes as important as the photoelectric absorption. As investigated in Matt et al. (1999), the “wabs” model underestimates the flux 0.5–1 order of magnitude in the column density range of cm-2. Considering the absorption due to the Compton scattering, the 2–10 keV and 20–100 keV luminosities of NGC 3079 are estimated to be erg s-1.
3.3 Combined fit of the MECS and PDS spectra
Using the three-component model, we performed combined fits of the MECS and PDS spectra. As shown in Table 1, the results are similar to those of the individual fits, except for an improvement of the lower limit to the absorption column density. Model (f) in Table 1 shows our best result. We superposed the best-fit model with each component on the spectra in Figure 2. The residual on the LECS band is roughly consistent with the soft component measured with ROSAT and ASCA.
Starting from the best-fit model, we examined additional structures in the NGC 3079 spectrum. First, we added the “pexrav” model (Magdziarz & Zdziarski 1995) to the best-fit model, to study the Compton-reflection hump. We fixed the photon index of the reflection component at 1.9. The data prefers no reflection with an upper limit to the reflection efficiency of 23%. It is similar to the situation seen in the other Compton-thick AGNs, such as M51 (Fukazawa et al. 2001) and NGC 4945 (Guainazzi et al. 2000). The small reflection efficiency indicates that not only the reflection process but also the transmission process contributes to the strong Fe-K line of NGC 3079. Secondly, we applied a high-energy exponential cutoff to the absorbed power-law component of the best-fit model. However, the cutoff energy was not restricted well with a loose lower limit of 16 keV.
4 Variability
In Figure 5, we show the LECS, MECS2+3 and PDS short-term light curves of NGC 3079. In the LECS and MECS band, no short-term variability was detected during one-day observation. It is consistent with the spectral result that the direct component of the NGC 3079 nucleus is not observed below 10 keV. In the PDS band, it is difficult to constrain the short-term variability, due to the poor photon statistic.
To study long-term variability, we fitted the ASCA spectra above 2 keV in the same way as Model (b). We fixed the photon index of the power-law component at the best-fit value of the BeppoSAX data. We are not concerned with the absorption. The 2–10 keV flux becomes erg cm-2 s-1, so that no long-term variation was detected during seven years. It is in contrast to the three-times long-term variation of the M51 nucleus (Fukazawa et al. 2001). Therefore, it might suggest that the NGC 3079 emission below 10 keV is mainly due to the host galaxy emission rather than the scattered and/or reflected component of the nuclear emission.
5 Discussion
The main result of the BeppoSAX observation of NGC 3079 is the detection of a heavily absorbed continuum and a strong Fe-K emission line.
The column density of the absorbed continuum and the equivalent width of the Fe-K line allow us to estimate the geometry of the system. Adopting the geometry in Ghisellini et al. (1994), the obtained values of the column density and equivalent width indicate a high inclination angle of 60–80 degree, corresponding to the dominant contribution of the transmission component of the Fe-K emission line. It is consistent with the no detection of the Compton hump in the BeppoSAX spectra.
Using the absorption-corrected 2–10 keV luminosity, we can estimate how active the NGC 3079 nucleus is. Trotter et al. (1998) estimated that the binding mass of the inner parsec of NGC 3079 is by the H2O maser kinematics. Accordingly, the X-ray emission of NGC 3079 is 1–10% of the Eddington luminosity. It is as active as the Seyfert galaxies and quasars.
We can also examine whether the AGN or starburst activity dominates the NGC 3079 energy output by comparing the 2–10 keV luminosity with the infrared luminosity. The infrared luminosity of NGC 3079 becomes erg s-1 (the NED data base). Assuming that the 2–10 keV luminosity is % of the bolometric luminosity, as typical for quasars (Elvis et al. 1994), the bolometric luminosity associated to the AGN is estimated to be as luminous as the observed infrared luminosity, hence the AGN and starburst activities contribute to the energy output of NGC 3079 in the same order of magnitude.
References
- (1) Dahlem, M., Weaver, K., Heckman, T.M, 1998, ApJS, 118, 401
- (2) Duric, N., Seaquist, E.R., 1988, ApJ, 326, 574
- (3) Elvis, M., Wilkes, B.J., McDowell, J.C. Green, R.F., Bechtold, J., Willner, S.P., Oey, M.S., Polomski, E., Cutri, R. 1994, ApJS, 95, 1
- (4) Ghisellini, G., Haardt, F., Matt, G., 1994 MNRAS, 267, 743
- (5) Guainazzi, M., Matt, G., Brandt, W.N., Antonelli, L.A., Barr, P., Bassani, L., 2000, A&A, 356, 463
- (6) Ho, L.C., Filippenko, A.V., Peng, C.Y., 1997, ApJS, 112, 391
- (7) Magdziarz, P., Zdziarski, A., 1995 MNRAS, 273, 837
- (8) Makishima, K., 1986, in Physics of Accretion on Compact Object, ed K.O. Mason, M.G. Watson, N.E. White (Springer-Verlag, Berlin, Heidelberg) p249
- (9) Matt, G., Pompilio, F., La Franca, F., New Astronomy, 1999, 4, 191
- (10) Nakai, N., Inoue, M., Miyazawa, K., Miyoshi, M., Hall, P., 1995, PASJ, 47, 771
- (11) Perez Garcia, A.M., Rodrigues Espinosa, J.M., Fuensalida, J.J., 2000, ApJ, 529, 875
- (12) Pietsch, W., Trinchieri, G., Vogler, A. 1998, A& A, 340, 351
- (13) Ptak, A., Serlemitsos, T., Yaqoob, T., Mushotzky, R. 1999, ApJS, 120, 179
- (14) Sawada-Satoh, S., Inoue, M., Shibata, K.M., Kameno, S., Migenes, V., Nakai, N., Diamond, P. 2000, PASJ, 52, 421
- (15) Trotter, A.S., Greenhill, L.J., Moran, J.M., Reid, M.J., ApJ, 1998, 495, 740
- (16) Veilleux, S., Cecil, G., Bland-Hawthorn, J., Tully, R.B., Filippenko, A.V., Sargent, W.L.W. 1994, ApJ, 433, 48


| Model | (a) | (b) | (c) | (d) | (e) | (f) | |
|---|---|---|---|---|---|---|---|
| Detector | MECS | MECS | PDS | PDS | MECS+PDS | MECS+PDS | |
| Power-law | Photon index | — | — | ||||
| 2–10 keV fluxaaIn unit of 10-13 erg s-1 cm-2. | — | — | |||||
| Power-law | Photon index | — | — | 1.9 (fix) | 1.9 (fix) | ||
| 2–10 keV fluxbbIn unit of 10-11 erg s-1 cm-2. | — | — | |||||
| 20–100 keV fluxccIn unit of 10-11 erg s-1 cm-2. Shown after absorption correction. | — | — | — | — | |||
| AbsorptionddHydrogen column density in unit of 1024 cm-2. Only the photoelectric absorption is considered. | — | — | |||||
| Gaussian | Energy [keV] | — | — | ||||
| Line width [keV] | 0 (fix) | — | — | 0 (fix) | 0 (fix) | ||
| NormalizationeePhotons in the line in unit of 10-6 cm-2 s-1. | — | — | |||||
| /d.o.f. | 0.86/4 | 1.98/5 | 0.10/1 | 0.29/2 | 2.08/6 | 2.30/7 | |
| 0.215 | 0.396 | 0.098 | 0.145 | 0.347 | 0.328 |
Note. — Errors refer to single-parameter 90% confidence limits. The PDS/MECS normalization factor is fixed at 0.86.