Reconciling Damped Ly- Statistics and 21cm Studies at
Abstract
Blind 21cm surveys in the local universe have shown that the local H i mass density, , is dominated by luminous, high surface brightness, spiral galaxies. On the other hand, surveys for host galaxies of damped Ly- systems have not always been successful in finding bright spiral galaxies. From an analysis of 21cm aperture synthesis maps of nearby galaxies we show that this apparent contradiction can be resolved by realizing that the H i mass density is dominated by galaxies, but the H i cross section near the DL threshold is more evenly distributed over galaxies with a large range in luminosity, gas mass, and surface brightness. The distributions of column densities and impact parameters of optically identified and non-identified DL host galaxies in the literature and the H i maps are qualitatively in agreement. Due to poor number statistics of low redshift DL systems, there is no firm indication that the redshift number count of low redshift DL systems is inconsistent with that calculated from the nearby galaxy population.
School of Physics, University of Melbourne, Victoria 3010, Australia
Kapteyn Astronomical Institute, PO Box 800, 9700 AV, Groningen, The Netherlands
Department of Astronomy, University of Wisconsin, 475 North Charter Street, Madison, WI 53706
1. Introduction
Blind 21cm surveys and studies of damped Ly- (DL) systems use completely unrelated observational techniques but they both can be employed to address similar scientific questions: what is the cosmological mass density of H i (), what sort of galaxies contribute most to , and how does at relate to that at high ? The main advantage of the 21cm surveys is that the total H i mass of the detected cloud or galaxy can be readily derived, and after follow-up with synthesis instruments a 3-dimensional data cube can be obtained from which a detailed map of the H i distribution and a velocity field can be extracted. Unfortunately, the neutral hydrogen 21cm emission line is weak, and blind 21cm surveys are limited to the very local () universe. In contrast, distance is not a limiting factor in the identification of DL systems, since their detection depends on the brightness of the background source against which the absorber is observed. However, the nature of these systems is more difficult to determine because the absorption spectrum gives information along one very thin sight-line through the absorber, and the total H i mass of individual absorption systems can not be determined. Furthermore, because DL systems are often found at high redshift, determining their optical properties requires extensive, time-consuming imaging programs.
One of the major challenges of 21cm and QSO absorption line research is to reconcile the results from blind H i surveys and DL surveys at low redshift. The aim of this paper is to briefly review the results from both fields, and test whether the results can be brought in agreement.
2. Results from 21cm and DL surveys
The most extensive blind 21cm surveys to date are the Arecibo H i Strip Survey (AHISS, Zwaan et al. 1997), the Arecibo Dual Beam Survey (ADBS, Rosenberg & Schneider 2000), and the HI Parkes Sky Survey (HIPASS, Staveley-Smith et al. 1996, Kilborn 2001). The main results from the AHISS, relevant to the present discussion, are that (i) the local H i mass density is dominated by H i rich, high surface brightness, luminous spiral galaxies (Zwaan et al. 1997, Zwaan, Briggs & Sprayberry 2001). Galaxies with H i masses below make up only about 20% of the neutral gas density, and low surface brightness (LSB) galaxies with central -band surface brightness contribute a similar fraction, and (ii) where there is H i there are stars. No convincing instance of star-less extragalactic H i cloud, not gravitationally bound to a parent galaxy, has yet been identified. The results from the ADBS and preliminary results from HIPASS are in agreement with these conclusions.
Thus, if most of the H i in the local universe is in these conspicuous galaxies, and at DL systems contain most of the H i, this would naively lead to the conclusion that DL host galaxies should be predominantly bright spiral galaxies and thus easily identifiable. However, this does not appear to be the case. The tally so far is that optical imaging of DL systems has turned up 5 LSB irregulars, 3 compact dwarfs, and ‘normal’ spiral galaxies (Le Brun et al. 2000, Nestor et al. 2001). In cases (depending on which reference to choose) a host galaxy has not been identified. H emission has been searched for in only one DL system by Bouché et al. (2000). They did not detect H emission in their deep HST imaging of a DL system, which allows them to put an upper limit of on the global star formation rate in DL system, which is lower than the typical value measured in field spiral galaxies. A third method of studying properties of DL systems is to search for 21cm emission in order to measure the total cold gas content of the DL system. The problem with these surveys is that the 21cm H i emission line is extremely weak so that with present technology these surveys are limited to the very local () Universe. Two attempts to detect H i in emission in DL systems have been made by Kanekar et al. (2001) and by Lane et al. (2000). Both searches resulted in non-detections, which allowed the authors to put upper limits to the H i masses of approximately (), which is one third of the H i mass of an galaxy. A reverse strategy was followed by Bowen et al. (2001), who identified a DL absorber in a nearby () very gas-rich LSB galaxy.
The conclusion from these surveys is that low redshift DL host galaxies display a wide range in galaxy parameters. This is a conclusion very similar to that from Nestor et al. (2001) who discuss the results of an optical and NIR imaging survey of five QSO fields with identified DL systems with . Obviously, it are not just the bright, high surface brightness spiral galaxies that dominate the cross section for . Is this a contradiction to the low redshift 21cm emission line survey results? To answer this question it is essential to study the distribution in nearby galaxies in more detail.
3. Measuring the local H i column density distribution function
Determination of the local H i column density distribution function requires 21cm maps of a fair sample of galaxies that is representative of the nearby galaxy population. Few such samples exist, because traditionally radio astronomers have chosen to study galaxies with extended H i disks, so that the rotation curve can be measured out to large radii, or galaxies with peculiarities or participating in interactions. The currently available data from H i selected galaxy samples are not appropriate because the spatial resolution of the survey instruments (Arecibo or Parkes) is too coarse to make detailed H i maps. 21cm follow-up on some of these samples (AHISS, ADBS) has been done with the VLA in the most compact (D) configuration, which only barely resolves the galaxies. Using these low resolution H i maps at a particular limiting column density contour leads to an overestimation of the effective cross-section for DL absorption. The exception is the ongoing work of Ryan-Weber et al. (2001), who use the Australian Telescope Compact Array (ATCA) to study a large sample of nearby galaxies taken from the HIPASS catalogue. Eventually, this sample will yield a valuable measurement of the local H i column density distribution function.
In Zwaan, Verheijen & Briggs (1999) we presented a measurement of the H i column density distribution function [], derived from deep WSRT 21cm maps of a volume-limited sample of galaxies in the Ursa Major (UMa) cluster (Verheijen & Sancisi 2001). We argued that this sample of galaxies is representative of the field because (i) the collapse time of the Ursa Major cluster is close to a Hubble time which implies that few interactions have taken place, (ii) the H i maps show no signs of H i depletion, and (iii) the morphological mix of the galaxy population in the Ursa Major cluster is similar to that in the field. The sample is very suitable for calculating because all galaxies are at approximately the same distance, which yield a uniform spatial resolution of kpc. The sample consists of 49 galaxies, and is complete to an absolute magnitude , roughly twice the luminosity of the Small Magellanic Cloud.
The UMa , presented in Figure 2 of Zwaan et al. (1999), was a considerable improvement over the function previously derived by Rao & Briggs (1993), who used Gaussian fits to the radial H i distribution of 27 galaxies with large optical diameters, as measured with the Arecibo Telescope. The UMa analysis was based on much higher spatial resolution observations ( vs. ), the sample contained more galaxies, and no modelling was applied. The UMa follows a distribution for , and a distribution for .
4. The distribution of cross-sectional area
Here we re-analyze the Ursa Major sample to make a more specific comparison between the available DL data and the information from nearby galaxy population. In Figure 1 we show the ‘volume density of cross-sectional area’ for different column density cut-offs. This cross-sectional area per volume is calculated by multiplying , where is the area of the H i above a certain column density limit, as a function of absolute magnitude , and is the galaxy luminosity function. The result of this product is , where , the number of absorbers per unit redshift, is a familiar quantity in QSO absorption line studies. To account for the fact that the sample excludes galaxies with inclinations , we have de-projected the H i maps, and recalculated the area function for the sample as if it were randomly oriented with inclination . These values have been incorporated in the total value of .
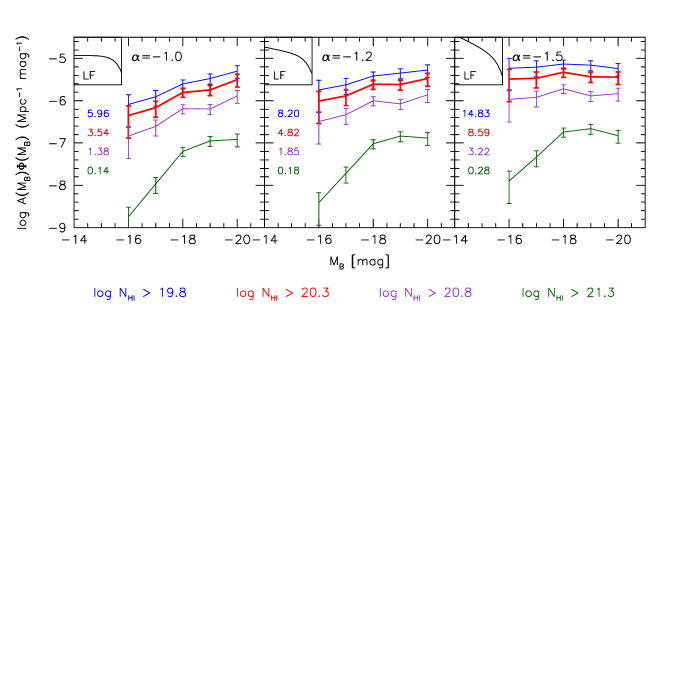
To illustrate the effects of different shapes of the luminosity function, we show the distribution of for three different values of the faint-end slope of the Schechter function: , and , as indicated by the miniature luminosity functions in the upper left corner of each panel. The value of is closest to the recently published results from the 2dF survey (Folkes et al. 1999) and the Sloan Digital Sky Survey (Blanton et al. 2001).
The main point here is that the distribution of cross section for is much less peaked around galaxies than the distribution of H i mass density (Figure 3 from Zwaan, Briggs, & Sprayberry 2001). Indeed, the H i cross section in galaxies with is only slightly lower than that in galaxies with . The consequence of this observation is that if an H i column density is encountered somewhere in the local universe, the probability that this gas is associated with a galaxy is almost as high as for association with a galaxy. On the other hand, the highest column densities () are largely associated with the most luminous galaxies. Small cross sections of very high column density gas can still account for high H i masses, which explains why the total H i density is dominated by galaxies.
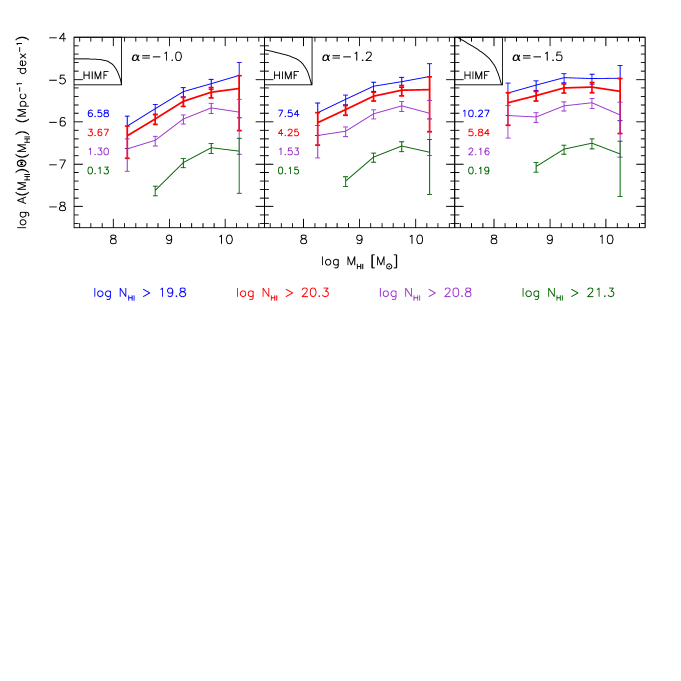
A similar plot can be constructed for the cross-sectional area as a function of H i mass. This is shown in Figure 2, where we plot , where is the H i mass function. Again, the results for three different values of the faint-end slope are shown. The H i mass fuction based on the Arecibo H i Strip Survey (AHISS) discussed by Zwaan et al. (1997), has a slope , corresponding to the middle panel. Steeper H i mass functions have been advocated by Rosenberg & Schneider (2001) on the basis of the ADB Survey.
The dependence of interception cross section on HI mass of the host in Fig. 2 shows a similar behavior to that of optical luminosity (as in Fig. 1), although less pronounced. Most of the cross section of DL column densities is associated with large H i mass galaxies, but the contribution from lower mass galaxies is not negligible: galaxies with contribute to the cross section.
Finally, Figure 3 shows the cross-sectional area as a function of -band central surface brightness. Weights to the individual galaxies have been calculated using optical luminosity functions, similar to those in Figure 1. This is a more robust method of determining the normalisation than using the central surface brightness distribution function (the galaxy density as a function of central surface brightness), which has not been measured to great accuracy. Concentrating on the central panel, it appears that galaxies two magnitudes dimmer that the canonical ‘Freeman-value’ (Freeman 1970) contain a comparable amount of cross section at DL column densities to those with the Freeman central surface brightness. Again, the distribution function for the highest column densities is more clearly peaked around high surface brightness galaxies, which explains the dominance of these galaxies in .
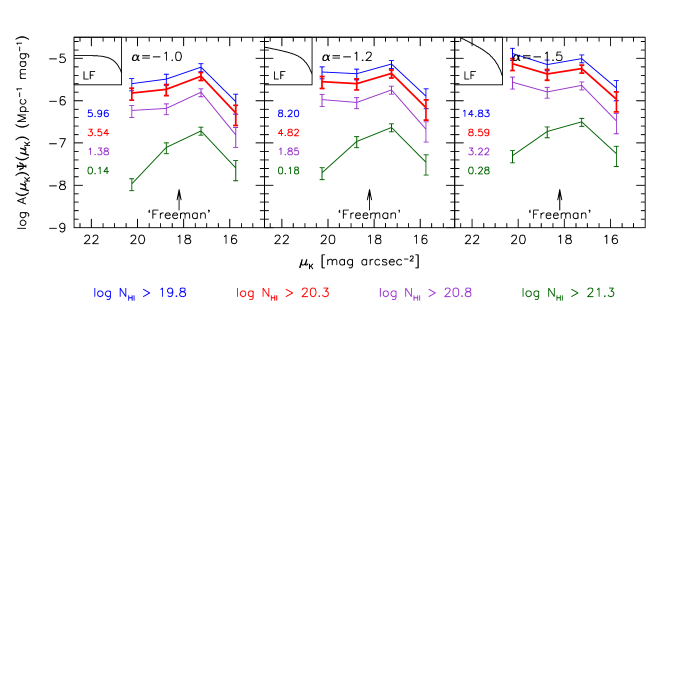
The conclusion from these three figures is that the probability distribution of cross-sectional area of DL column densities as a function of various galaxy parameters is much less peaked at -type properties than the H i density. This explains why surveys for DL host galaxies turn up a population of galaxies with a large spread in luminosity, morphological type, and surface brightness. Rosenberg & Schneider, and Turnshek et al. have presented similar plots of cross section vs. luminosity at this meeting.
5. Redshift number density
The above analysis shows that 21cm surveys and DL results are in qualitative agreement. The remaining question is whether , the number of absorbers per unit redshift, is quantitatively consistent between the two techniques.
Rao & Turnshek (2000) recently undertook a HST survey of low redshift () Mgii selected systems, with the aim of measuring the incidence of DL systems. The underlying assumption that makes this statistical approach work, relies on the empirical fact that all DL systems are Mgii absorbers. Rao & Turnshek conclude that shows no indication of evolution over the redshift range , but the point measured from 21cm surveys is significantly lower. However, Briggs (2001) argued that the Mgii statistics used to bootstrap the DL values, should be limited to those systems with , since the Mgii-selected DL systems are drawn almost entirely from the large equivalent width Mgii sub-sample. Because Steidel & Sargent (1992) found that at low redshift these large systems evolve significantly faster than the low systems, the lowest Rao & Turnshek values of would be lower, which could lessen the discrepancy with the point substantially. Interestingly, Churchill (2001) performed an unbiased survey for low- Mgii systems and used the same statistics for Mgii systems as Rao & Turnshek did, and found that for DL absorption is at . This value agrees very well with a no-evolution extrapolation of the Rao & Turnshek results. Unfortunately, small number statistics (Churchill’s result is based on four systems) causes large uncertainties on the derived values, which makes the interpretation very difficult. The studies that depend on intermediary Mgii lines contrast sharply with lower values from the more traditional DL survey methods (Jannuzi et al. 1998, Lanzetta et al. 1995), although they also suffer from small number statistics.
Using the UMa sample and the H i mass function from Zwaan et al. (1997) with a faint-end slope of , we find for DL column densities a value of . The quoted uncertainty on this value is based on Poisson statistics, and does not take into account the uncertainties on the H i mass function parameters. If we use the isophotal -band galaxy luminosity function parameters from Blanton et al. (2001), and account for the galaxies in the UMa sample not detected in H i, we arrive at the same value for . This value is higher than the one found by Rao & Briggs (1993) (), probably because these authors limited their calculation to large, optically bright galaxies, whereas our calculation is based on a volume-limited galaxy sample, which also includes dwarf and LSB systems.
At present it is unclear whether the DL redshift number densities at derived from 21cm emission maps and Mgii selected systems agree. The errorbars on the Churchill value are sufficiently large to make them in agreement with our estimate (less than difference). Obviously, much better statistics are required to appraise the results from the different methods. Rosenberg & Schneider (2001) use their VLA D-array imaging of H i selected galaxies to find . There are two reasons why this value is higher than the one we find. Firstly, the H i mass function that these authors use has a faint-end slope of , whereas we use . This steeper H i mass function causes low mass galaxies to contribute more cross section. Secondly, their analysis is based on lower resolution data of galaxies at larger distances. This might lead to an overestimation of the cross sections.
6. Comparing properties of DL systems and nearby galaxies
In Figure 4 we show the 2-dimensional probability density distribution of cross section in the plane, where is distance from the centre of the galaxy. We have used the UMa sample to calculate the cross-sectional area contributed by each element , on a fine grid in the plane. To increase the signal-to-noise in the figure, we smoothed this probability distribution with a Gaussian filter with in the direction and in the direction. An H i mass function with a faint-end slope was again used to calculate the weights of the individual galaxies. The contour levels are chosen at 10, 30, 50, 70, and 90% of the maximum value.
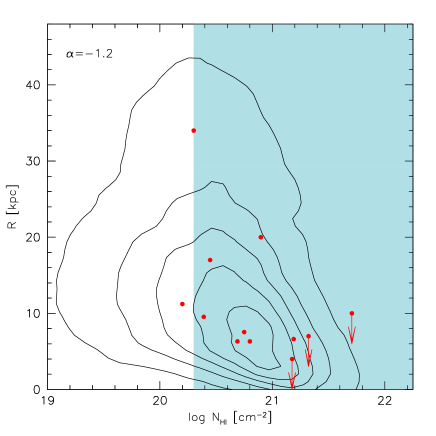
There are a number of interesting features in this plot. First, it shows that the largest concentration of H i cross sections in galaxies in the local universe is in column densities and galactocentric radii . The observational fact that the H i distribution in galaxies often shows a central depression can be seen in this figure by the compression of contours at . Not surprisingly, the outer contour shows that high column densities are mostly seen at small , but it also shows that column densities lower than are rarely seen in the extreme centres of galaxies. (This might depend on the resolution).
In order to make a direct comparison between 21cm results and DL parameters, we plotted on top of the contours the data points from DL surveys taken from Le Brun et al. (2000) and Nestor et al. (2001). Note that these are the lowest redshift DL systems known, but the median redshift of the combined sample is , significantly higher than the median for the UMa sample. Evolutionary effects might therefore be important, but at present a lower redshift DL sample is not available.
Although the statistics is still poor, there seems to be an agreement between the distribution of the DL points and the contours from the 21cm maps. When more measurements of impact parameters and column densities of low- DL systems become available, this method will provide a powerful tool to test whether the properties of DL systems and nearby galaxies are in agreement.
7. Concluding remarks
We have shown that the properties of DL galaxies are in good agreement with the expectations based on 21cm images of nearby galaxies. Although most of the H i mass density is locked up in luminous spiral galaxies, the H i cross section is much more spread out over different galaxy properties. Also the distribution of column densities and impact parameters are in general agreement between DL systems and local galaxies, although the statistics is still poor.
There are a number of caveats that should be kept in mind when making comparisons between QSO absorption line systems and galaxies. First, the spatial resolution of the aperture synthesis instruments used to derive H i column density maps of nearby galaxies might have a influence of the derived column density distribution functions. Beautiful examples of fine-structure in the H i distribution in galaxies can be found, for example, in the maps from the Southern Galactic Plane Survey (McClure-Griffiths et al. 2001), in the Small Magellanic Cloud maps of Stanimirovic et al. (1999), or in Braun’s (1995) high resolution imaging of nearby spiral galaxies. The results presented here are based on much coarser resolution, which means that most of this fine structure is averaged out.
A second point of concern is the small number of appropriately studied galaxies in the available samples. The cross section distribution functions are derived from 49 galaxies, which implies that there are on average 10 galaxies per bin in , , or surface brightness. The calculation of cross-sectional areas implicitly assumes that within each bin the galaxies are randomly oriented, but for these small samples that might not always be justified. Also, it would be interesting to calculate the functions for a larger range of galaxy parameters. Both these issues will be addressed in a future paper in which we present an analysis of the column density distribution function of a much larger galaxy sample taken from the WHISP survey (Westerbork observations of neutral Hydrogen in Irregular and SPiral galaxies).
Finally, it is important to keep in mind the biases that are introduced in assembling DL galaxy samples. As Turnshek et al. (2001) stress, the identification of a galaxy with the DL absorber is more probable if the impact parameter between the sight-line to the background QSO and the galaxy is small. On the other hand, if the impact parameter is very small, the identification of a galaxy might be hindered by the dominating QSO light. DL samples might be biased due to the effect of dust obscuration in the DL host galaxies. Pei et al. (1999) argue that these ‘dusty sight-lines’ might drop out of the QSO sample that is used to identify the absorbing systems.
References
Blanton, M. R., et al. 2001, AJ, 121, 2358
Bouché, N. Lowenthal, J. D., Charlton, J. C., Bershady, M. A., Churchill, C. W., Steidel, C. C. 2001, ApJ, 550, 585
Bowen, D. V., Huchtmeier, W., Brinks, E., Tripp, T. M., Jenkins, E. B. 2001, astro-ph/0104396
Braun, R. 1995, ApJ, 484, 637
Briggs, F.H., 2001, these proceedings
Churchill, C. 2001, astro-ph/0105044
Folkes, S. et al. 1999, MNRAS, 308, 159
Freeman, K. C. 1970, ApJ, 160, 811
Jannuzi, B. T., et al. 1998, ApJS, 118, 1
Kanekar, N., Chengalur, J. N., Subrahmanyan, R., Petitjean, P. 2001, A&A, 367, 46
Kilborn, V. A., 2000, PhD Thesis, Univ. Melbourne
Lane, W. M., Briggs, F. H., Smette, A. 2000, ApJ, 532, 146
Lanzetta, K. M., Wolfe, A. M., Turnshek, D. A. 1995, ApJ, 440, 435
Le Brun, V., Smette, A., Surdej, J., Claeskens, J.-F. 2000, A&A, 363, 837
McClure-Griffiths, N. M., Green, A. J., Dickey, J. M., Gaensler, B. M., Haynes, R. F., Wieringa, M. H. 2001, ApJ, 551, 394
Nestor, D. B., Rao, S. M., Turnshek, D. A., Monier, E., Lane, W., Bergeron, J. 2001, these proceedings (astro-ph/0108146)
Pei, Y. C., Fall, S. M., Hauser, M. G. 1999, ApJ, 522, 604
Rao, S. & Briggs, F. H. 1993, ApJ, 419, 515
Rao, S. M. & Turnshek, D. A. 2000, ApJS, 130, 1
Rosenberg, J. L., Schneider, S. E., 2000, ApJS, 130, 177
Rosenberg, J. L., Schneider, S. E., 2001, these proceedings (astro-ph/0107495)
Ryan-Weber, E., Webster, R., Staveley-Smith, L. 2001, these proceedings (astro-ph/0107522)
Stanimirovic, S., Staveley-Smith, L., Dickey, J. M., Sault, R. J., Snowden, S. L. 1999, MNRAS, 302, 417
Staveley-Smith L. et al. 1996, PASA, 13, 243
Steidel, C. C., Sargent, W. L. W. 1992, ApJS, 80, 1
Turnshek, D. A., Rao, S. M., Nestor, D. B. 2001, these proceedings (astro-ph/0108142
Verheijen, M. A. W., Sancisi, R. 2001, A&A, 370, 765
Zwaan, M. A., Briggs, F. H., Sprayberry, D. & Sorar, E. 1997, ApJ, 490, 173
Zwaan, M. A., Verheijen, M. A. W., Briggs, F. H. 1999, PASA, 16, 100
Zwaan, M. A., Briggs, F. B., Sprayberry, D. 2001, MNRAS in press (astro-ph/0107448)