An irradiated accretion disk in the narrow-line Seyfert 1 RE J1034396?
Abstract
We model the optical to X-ray continuum spectrum of the narrow-line Seyfert 1 galaxy RE J1034396. We show that the flat optical spectrum is consistent with emission from an irradiated accretion disk. The X-ray emission can be modelled with a disk blackbody and a Comptonised component. The temperature at the inner edge of the disk keV. Using this constraint, we show that the flat optical spectrum is consistent with emission from the irradiatively heated outer part of the accretion disk. We constrain the outer radius of the optically thick disk ( cm) and the inner radius of the irradiation-dominated region ( cm). Our optical and X-ray spectral fits indicate a mass , and do not rule out a low (i.e. face-on) inclination angle for the system.
keywords:
accretion, accretion discs — galaxies: active — galaxies: nuclei — galaxies: Seyfert — galaxies: individual: RE J1034396 — X-rays: galaxies1 Introduction
The optical to X-ray continuum of RE J1034396 is highly unusual for a Seyfert 1 galaxy. The optical/UV continua of most AGN rise towards the blue with a slope (where is the spectral index, defined such that ), while the soft X-ray spectrum falls towards high energies with spectral index (e.g. Laor et al. 1997). The spectrum seems to peak in the unobservable EUV and this continuous, optical to soft X-ray feature, known as the “big blue bump”, is believed to represent the emission from a geometrically thin, optically thick accretion disk.
In RE J1034396, however, the optical/UV continuum is flat (), with no sign of the big blue bump down to Ly. At keV, the soft X-ray spectrum is very strong above the extrapolated level of the optical/UV continuum, peaking at keV then falls steeply towards higher energies (Puchnarewicz et al. 1998). Puchnarewicz et al. (2001) suggested that the accretion disk component in RE J1034396 is one of the hottest observed in AGN, so that its high-energy turnover is measurable in the soft X-rays rather than the UV band. They inferred a high accretion rate (– ), a small black hole (BH) mass and an inclination angle –.
The flat optical spectrum was modelled by Puchnarewicz et al. (2001) with an underlying power-law component extending from the optical to hard X-rays, in addition to the optically thick disk spectrum. However, they could find no satisfactory physical explanation for this feature. Breeveld & Puchnarewicz (1998) detected no significant polarization in the optical, making a synchrotron origin unlikely.
In this Letter, we suggest a different interpretation of the continuum spectrum: we show that the flat optical spectrum is consistent with the continuum emission of an irradiated disk, with no need to invoke an additional power-law component. We also revise the estimate for the central mass, and note that low inclination viewing angles cannot be ruled out.
2 Observations
Optical spectra of RE J1034396 were obtained on 1996 March 24 with the ISIS spectrograph mounted on the William Herschel Telescope at La Palma (in service observing mode). The spectrum, which covered the range 3800–7000 Å, is clearly contaminated by light from the host galaxy, particularly in the red. In order to remove the extended galactic emission, the nuclear spectrum was deconvolved from the total spectrum using the technique described in Puchnarewicz et al. (2001).
In the UV band, RE J1034396 was observed by HST on 1997 January 31 using three gratings (G130L, G190L and G270L) covering the range 1100–3300 Å. Full details of the observations and data reduction were presented in Puchnarewicz et al. (1998).
Beppo-SAX observed the system on 1997 April 18. Useful data were obtained with the Low Energy Concentrator Spectrometer (LECS; 0.1–10 keV) and the Medium Energy Concentrator Spectrometer (MECS; 1.3–10 keV); all three MECS units were used. The source was not detected with the high-energy instruments. The total observing time was 21.7 ks for LECS and 43.2 ks for MECS. For more details on the observations and on the techniques used for source extraction and background subtraction, see Puchnarewicz et al. (2001).


| Parameter | Value |
|---|---|
| wabs*(diskbb + power law): (121 dof) | |
| (column density) | cm-2 |
| ( at inner disk edge) | keV |
| (diskbb normalisation) | |
| (photon index) | |
| (power-law normalisation) | |
| wabs*(diskbb + comptt): (119 dof) | |
| (column density) | cm-2 |
| ( at inner disk edge) | keV |
| (diskbb normalisation) | |
| (input soft photon ) | keV |
| ( of hot corona) | keV |
| (optical depth of hot corona) | |
| (normalisation) | |
3 X-ray spectral analysis
In Puchnarewicz et al. (2001), LECS and MECS spectra were fitted with a number of models (see their Table 4) including power-law and single-temperature blackbody components. The best fit to the soft spectrum was obtained with two blackbody components and a power law, with a column density fixed at the Galactic value ( cm-2).
In this work, we want to test our hypothesis that the optical-to-X-ray continuum spectrum is dominated by an optically thick accretion disk. This would be analogous to Galactic BH candidates in the soft spectral state. Therefore, we fitted the Beppo-SAX spectra with a multi-temperature disk blackbody plus a power law, using XSPEC version 11.0.1 (Arnaud 1996). This phenomenological model can be taken as an approximation of the spectrum produced by an accretion disk plus a hot Comptonising region. The disk is responsible for the soft emission; part of the soft photons are inverse-Compton scattered to the hard X-ray band as they cross the hot corona. We also fitted the data with the more physical Comptonisation model of Titarchuk (1994) (comptt in XSPEC).
The best-fit parameters for the two models are listed in Table 1, and the spectrum fitted with disk blackbody plus power law is shown in Figure 1 (top). We fitted the LECS and MECS data simultaneously (using 0.13–10 keV for LECS, and 0.9–10 keV for MECS), and we applied a constant factor of 0.9 in the relative normalisation of the two instruments (Fiore et al. 1998). For both the models presented here, the best-fit intrinsic column density converged to 0; we have therefore fixed the column density to the Galactic value. For the disk plus power-law model, the power-law spectral index (photon index ) is softer than for typical AGN (as previously suggested by Pounds, Done & Osborne 1995).
Puchnarewicz et al. (2001) claimed that there is firm evidence of a hardening in the spectrum at energies keV; they suggested that a harder power-law component dominates at higher energies, and that the same power-law component may explain the optical spectrum if it extends to those lower energies. A hint of an upturn in the spectrum for keV is indeed visible in Figure 1. However, given the low signal-to-noise ratio in the higher energy channels, and the fact that the upturn is evident only in the LECS data (less reliable at those energies), we prefer not to speculate on the physical reasons for the possible existence of a hard component.
We also used the best-fit parameters inferred from the Beppo-SAX data (Table 1) to re-fit the ASCA/GIS data from 1994 November, previously discussed in Pounds et al. (1997) and Puchnarewicz et al. (2001). The result is shown in Figure 1 (bottom); we obtain (117 d.o.f.) for the disk blackbody plus power-law model. Again, although there may be marginal evidence for a hardening of the spectrum at keV, the signal-to-noise ratio is too low to allow a meaningful interpretation.
A significant result from both models is the strong constraint on the temperature at the inner radius of the accretion disk. We obtain keV. This is also in agreement with earlier ROSAT (Puchnarewicz et al. 1998) and ASCA (Pounds et al. 1997; Puchnarewicz et al. 2001) observations. We shall use this firm result as we model the disk spectrum in the optical band.
4 Continuum spectrum of an irradiated disk
The effective temperature of an accretion disk photosphere at each radius is determined by the thermal energy generated by local viscous dissipation near the disk mid-plane (viscous heating), as well as by the energy intercepted from the central X-ray source, thermalised and re-emitted (irradiative heating).
In the absence of irradiation, the effective temperature of a geometrically thin, optically thick disk is (Shakura & Sunyaev 1973; see also, e.g., Frank, King & Raine 1992)
| (1) |
where is a critical radius () beyond which we assume no further viscous dissipation in the accretion flow, and is the mass accretion rate at radius .
The contribution of the irradiation to the effective temperature is (e.g., King 1998):
| (2) |
where is the efficiency of conversion of accreted mass into energy, is the central mass accretion rate ( if some mass is lost in a disk wind), is the albedo of the disk surface, is the disk scale-height at radius . The index () depends on the geometry of accretion (Vrtilek et al. 1990; van Paradijs 1996).
The last two factors on the right hand side of equation (2) depend on the disk thickness and the amount of disk flaring (a more concave disk intercepts a larger fraction of radiation). They vary only slowly with ; following King (1998), we approximate them with a constant factor , with for a thin disk. Hence, while ; this implies that irradiative heating dominates at large radii, and viscous heating at small radii.
Henceforth, we shall also assume that , and re-write the mass accretion rate in terms of the emitted luminosity: , with erg s-1. Finally, given the characteristic dimensions of RE J1034396, we shall define and .
From equations (1) and (2), the total effective temperature is given by:
| (3) |
with the parameters and given by:
| (4) |
| (5) |
Hence, we have
| (6) |
The specific flux at frequency detected by an observer at distance , with the line of sight forming an angle to the normal to the disk plane, is (Mitsuda et al. 1984):
| (7) |
where the redshift for RE J1034396. This corresponds to a proper distance cm. Here we have defined, as usual, km s-1 Mpc.
Equation (7) is sometimes modified with the introduction of a spectral hardening factor (Ebisuzaki, Hanawa & Sugimoto 1984; Shimura & Takahara 1995), to take into account Compton scattering in the disk. We can write the “diluted disk blackbody” specific flux as:
| (8) |
with (Shimura & Takahara 1995)
Our goal is to check if a disk blackbody or a diluted disk blackbody spectrum can explain the observed optical/UV/soft X-ray continuum. We have compared the observed fluxes with the values predicted by equations (7) and (8), for various values of the parameters , , , and . Using the results of our X-ray spectral fitting, we constrain to vary in the range keV. We shall discuss our main results in the next section.
| Parameter | Value |
|---|---|
| 1.5 | |
| K | |
| 43.5 | |
| cm | |
| cm | |
5 Discussion of our results
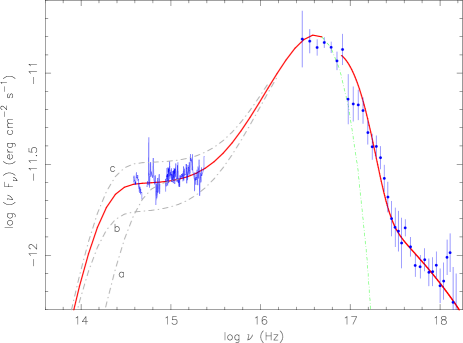
We show in Figure 2 that the continuum spectrum at energies keV can be well fitted by a diluted disk blackbody spectrum (thick solid line) with , and best-fit parameters listed in Table 2. For keV, the thick solid line plotted in Figure 2 represents the best fit to the Beppo-SAX X-ray data, discussed in Section 3.
The model parameters in Table 2 imply keV. For , it is , while for , . Therefore, unlike what was claimed in Puchnarewicz et al. (2001), we cannot rule out that the system is seen face-on (). This would explain why the molecular torus does not block out the X-ray emission from the central source. It has been suggested (Puchnarewicz et al. 1992; Boller et al. 1997) that narrow-line Seyfert 1 galaxies are generally seen face-on.
If we assume a simple disk blackbody spectrum instead (), it is clear from equations (7) and (8) that the same fit can be obtained with K, ( for ), with the other parameters fixed as above. This corresponds to keV. In fact, we can obtain good fits for keV by varying between 1.5 and 1. Given the uncertainty in the distance and in the hardening factor, we cannot constrain the inclination angle more strongly.
The parameter provides the size of the disk region dominated by irradiative heating. In our best fit, the disk is irradiatively dominated for . Small changes in the parameter have large effects on the predicted optical spectrum. In Figure 2, we also plot the spectrum obtained with (marked with “b”; irradiation dominating for ) and (marked with “c”; irradiation dominating for ). Using equation (5), we see that the best-fit value of is consistent with , as expected.
We can obtain a stronger constraint on the central mass by inserting our best-fit value of into equation (4):
| (9) |
For the high accretion rates observed in this system (, see e.g. Puchnarewicz et al. 2001), and for , we can constrain the mass of the central object to be .
A simple physical interpretation of is that it corresponds to the radius of the innermost stable circular orbit around the central BH. However, the standard disk model is probably not applicable near the inner disk radius, and in any case it has to be modified with relativistic terms (e.g., Novikov & Thorne 1973; Riffert & Herold 1995). Therefore, our spectral fit near the peak of the blackbody component (at – keV) can only be a general approximation. A more exact modelling is left to further work, and will require more precise observational data in the soft X-ray band. Nevertheless, we can check that our best-fit value of cm is consistent with the range of values for derived before. If , is consistent with the innermost stable circular orbit of a Schwarzschild BH, while if we require a Kerr BH with angular parameter .
The outer disk radius is also constrained by our fit: we require cm . If we keep all other parameters in Table 2 fixed, but assume a disk truncated at cm, we cannot reproduce the flat optical spectrum (curve marked “a” in Figure 2).
6 Further work: disk winds and line emission
A large accretion disk heated by soft X-rays intercepted from the central source is likely to have a temperature-inversion layer at its surface (Wu et al. 2001). Therefore, we expect strong emission-line formation at large radii. In particular, in the case of RE J1034396, the largest contribution to low-ionisation lines such as H and H would come from radii cm, where the Keplerian rotational velocities are km s-1. If the Balmer lines are indeed produced near the disk surface, we expect full widths at half maximum km s-1. This is in agreement with the observed values of 1500 and 1800 km s-1 for H and H respectively (Puchnarewicz et al. 1995).
Moreover, if the X-ray luminosity from the central source is , we may expect the formation of a radiatively-driven accretion disk wind. Accurate modelling of the emission-line profiles may help us ascertain if higher-ionisation lines are formed in the wind, and determine the ionisation parameter of the emission regions. The narrow, single-peaked UV lines seen by Puchnarewicz et al. (1998) appear qualitatively consistent with the disk-wind model of Murray & Chiang (1997). The presence of broad and narrow components in the UV lines may be explained with a broad component emitted near the irradiated disk surface at smaller radii, and a narrow component emitted in the photoionised wind. A full investigation of this issue is beyond the scope of this Letter and is left to further work.
7 Conclusions
We have fitted the optical to X-ray continuum spectrum of the narrow-line Seyfert 1 RE J1034396 with an irradiated disk blackbody component (temperature keV at the inner disk radius), and a power-law-like Comptonised component at higher energies. The disk component is much stronger and found at higher energies than in the average AGN; the spectral index of the power-law component is (steeper than the average value for an AGN); the observed luminosity is close to the Eddington limit. We infer a central mass of .
The observed flat optical/UV spectrum is explained by our model as emission from the radiatively-heated outer part of the disk, at , where . Strong emission lines are likely to be formed near the irradiated surface of the outer disk, and in a radiatively-driven wind. Our model requires the disk to extend to cm. The observed flux and inner-disk temperature do not rule out the hypothesis of a face-on system, which would be in agreement with the low line-of-sight absorption seen in the X-ray spectra.
References
- [1] Arnaud, K. A., 1996, in ASP Conf. Ser. 101, Astronomical Data Analysis Software and Systems V, ed. G. H. Jacoby & J. Barnes (San Francisco: ASP), 17
- [2] Boller, Th., Brandt, W. N., Fabian, A. C., Fink, H. H., 1997, MNRAS, 289, 393
- [3] Breeveld, A. A., Puchnarewicz, E. M., 1998, MNRAS, 295, 568
- [4] Ebisuzaki, T., Sugimoto, D., Hanawa, T., 1984, PASJ, 36, 551
- [5] Fiore, F., Laor, A., Elvis, M., Nicastro, F., Giallongo, E., 1998, ApJ, 503, 607
- [6] Frank, J., King, A., Raine, D., 1992, Accretion Power in Astrophysics (Cambridge: University Press)
- [7] King, A., 1998, MNRAS, 296, L45
- [8] Laor, A., Fiore, F., Elvis, M., Wilkes, B. J., McDowell, J. C., 1997, ApJ, 477, 93
- [9] Mitsuda, K., et al. 1984, PASJ, 36, 741
- [10] Murray, N., Chiang, J., 1997, ApJ, 474, 91
- [11] Novikov, I. D., Thorne, K. S., 1973, in Black Holes, ed. C. DeWitt & B. S. DeWitt (New York: Gordon & Breach), 334
- [12] Pounds, K. A., C. Done, Osborne, J. P. 1997, MNRAS, 277, L5
- [13] Puchnarewicz, E. M., Mason, K. O., Siemiginowska, A., 1998,
- [14] Puchnarewicz, E. M., Mason K. O., Cordova F. A., Kartje J., Branduardi-Raymont G., Mittaz J. P. D., Murdin P. G., Allington-Smith J., MNRAS, 256, 589 MNRAS, 293, L52
- [15] Puchnarewicz, E. M., Mason, K. O., Siemiginowska, A., Pounds, K. A., 1995, MNRAS, 276, 20
- [16] Puchnarewicz, E. M., Mason, K. O., Siemiginowska, A., Fruscione, A., Comastri, A., Fiore, F., Cagnoni, I., 2001, ApJ, 550, 644
- [17] Riffert, H., Herold, H., 1995, ApJ, 450, 508
- [18] Shakura, N. I.; Sunyaev, R. A., 1973, A&A, 24, 337
- [19] Shimura, T., Takahara, F., 1995, ApJ, 445, 780
- [20] Titarchuk, L., 1994, ApJ, 434, 313
- [21] van Paradijs, J., 1996, ApJ, 464, L139
- [22] Vrtilek, S. D.; Raymond, J. C., Garcia, M. R., Verbunt, F., Hasinger, G., Kurster, M., 1990, A&A, 235, 162
- [23] Wu, K., Soria, R., Hunstead, R. W., Johnston, H. M., 2001, MNRAS, 320, 177