Discovery of X-Ray Pulsations from the Compact Central Source in the Supernova Remnant 3C 58
Abstract
We report on high time and spatial resolution observations of the supernova remnant 3C 58 using the High Resolution Camera (HRC) on the Chandra X-ray Observatory. These data show a point-like central source, from which we detect 65.68-ms pulsations at significance. We interpret these pulsations as corresponding to a young rotation-powered pulsar, PSR J0205+6449, which is associated with and which powers 3C 58. Analysis of archival RXTE data from three years earlier confirms these pulsations, and allows us to determine a spin-down rate of s/s. Assuming a magnetic dipole model for PSR J0205+6449, we infer a surface magnetic field of G. The characteristic age for this pulsar is 5400 yr, indicating either that 3C 58 was not the supernova of 1181 CE, or that the pulsar’s initial spin period was ms.
1 Introduction
An isolated pulsar within a supernova remnant presents an opportunity to compare the derived characteristics of both, particularly the ages. 3C 58 is of particular interest since it is generally accepted as being the remnant of SN1181 CE (Clark and Stephenson (1977)) and, therefore, has a known age of 820 years. The classic best-loved example of a pulsar/SNR association is the Crab Nebula, with characteristic pulsar age of 1250 years, close to the historical age of 946 years. Previous analysis of observations of 3C 58 using Einstein and ROSAT (Becker, Helfand, and Szymkowiak (1982); Helfand, Becker, and White (1995)) suggested that there is a compact object at the center of the SNR. The authors note that while 3C 58 is a young Crab-like remnant, its radio luminosity is a factor of less than the Crab, while its X-ray luminosity is times below that of Crab. This implies that the spin-down luminosity of any pulsar powering 3C 58 is substantially lower than that of the Crab, and that there must be significant differences in the mechanisms that channel the spin-down energy into X-ray emission.
Using the ROSAT HRI data, and extracting photon events from this compact object, Helfand, Becker, and White (1995) failed to detect any periodic signal from this putative pulsar. The Cycle 1 HRC GTO program included a search for pulsations in a series of SNRs containing synchrotron nebulae.,with 3C 58 as the first target. It was selected as the most likely to contain an X-ray pulsar based on the earlier Einstein (Becker, Helfand, and Szymkowiak (1982)) and ROSAT(Helfand, Becker, and White (1995)) observations. ASCA measurements showed that the power-law spectrum steepens with distance from the center of the nebula (Torii et al. (2000)), increasing the expectation that a pulsar is powering the nebula.
In this paper we report on the results from two Chandra X-ray Observatory (CXO) HRC observations that were obtained for 3C 58 during Cycle 1 (1999-2000). One used the HRC-I as part of the original observing program, and the second used the HRC-S in a special mode designed to overcome a timing problem with HRC that was discovered after the Chandra launch (Murray et al (2001)). The goal of the observations was to search for pulsations from the central source, and to measure the spatial structure of the central region. We also report on a re-analysis of Rossi X-ray Timing Explorer (RXTE) observations that were made in 1997 using a new suite of analysis tools developed for radio pulsar searches and now applied to X-ray data (Ransom (2001)).
2 Observations with the HRC
2.1 HRC-I Observation
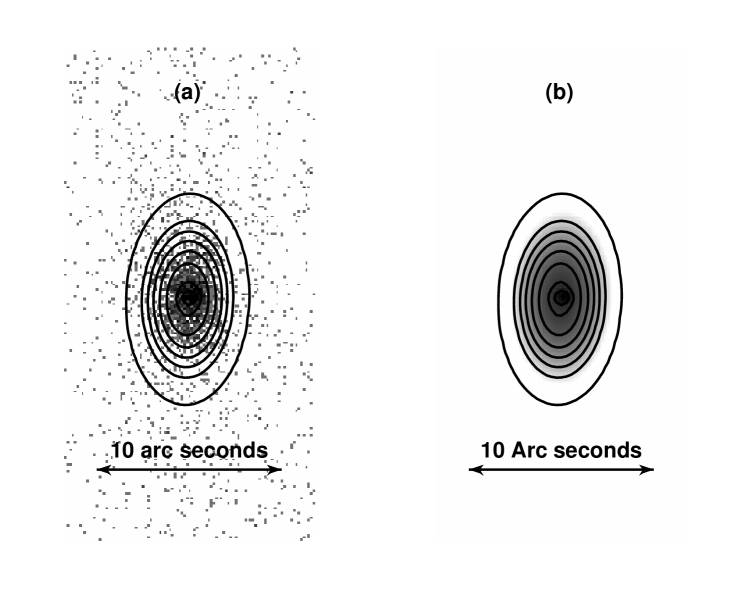
The first HRC observation of 3C 58 was OBSID 00129. It was carried out on 30, November 1999 and was done with HRC-I for 29 ksec. The image obtained is shown in Figure 1. In panel (a), the HRC data is binned to about 2.1 arc second/pixel (16 HRC pixels per display pixel), and smoothed using a Gaussian with a 2 arc second sigma. The contour shown corresponds to the X-ray isophote where the nebula merges with the detector background ( counts per display pixel). The contour is about 8 arc minutes long and 5 arc minutes wide. Panel (b) shows the central part of the image. Here the data are binned 0.1318 arc second/pixel, and then smoothed using a Gaussian with a 0.25 arc second sigma. It is evident from these Chandra images that the compact source and its extent first reported by Helfand, Becker, and White (1995) is real.

Integrating the X-ray emission over the entire nebula (as defined by the contour) gives an estimate of its luminosity. There are 37883 total counts inside this contour, and after background subtraction a net of 18620 counts in the 29 ksec observation time. Using the nebula average best fit photon power-law spectral index , and the column density , (Helfand, Becker, and White (1995); Torii et al. (2000)) we find (0.08 -10 keV), taking the distance to 3C 58 to be 2.6 kpc (Green and Gull (1982))). The uncertainty in luminosity due to various systematic effects such as the spatial limit of the nebula and uncertainties in the spectral parameters is estimated at about 20%.
2.2 HRC-S Observation
The second HRC observation of 3C 58 used HRC-S in imaging mode to allow accurate event timing measurements. In this 33 ksec observation (OBSID 01848), taken 23 December, 2000 (MJD=51901.33), the same large scale spatial properties were found for the source as described above. However, in this observation the point source was located on-axis resulting in better image quality on the sub-arc second scale. (In the HRC-I observation the point source was about 2 arc minutes off-axis.)
2.2.1 Two Dimensional Spatial Model of the Central Region
The smoothed image of the central region of 3C 58 shown in the inset of Figure 1b suggests that there is a point-like source embedded in an extended region that is elongated along the North-South direction. We have fit the central region of 3C 58 to a simple 2D spatial model (using the CIAO Sherpa tools) consisting of the sum of two 2D Gaussian distributions (one circularly symmetric to simulate a point source, and one with ellipticity to simulate the extended component), and a constant background. The results of the spatial fit are shown in Figure 2, and summarized in Table 2.2.1. From Table 2.2.1 we note that the first Gaussian component is consistent with a point source, and that the extended emission is characterized by a FWHM of about a 3 arc second extent along its major axis and about 1.3 arc seconds along the minor axis.
| Table 2.2.1 2D Spatial Model Results | ||
|---|---|---|
| Parameter | Value | Uncertainty |
| g1.fwhm | 4.28 | |
| g1.ampl | 7.32 | |
| g2.fwhm | 25.78 | |
| g2.ampl | 3.01 | |
| g2.ellip | 0.42 | |
| c3.c0 | 0.038 | |
Table 2.2.1: The model consists of the sum of the following components. A 2D Gaussian (g1) with circular symmetry representing the point like source contribution, a 2D Gaussian (g2) with elliptical symmetry representing the elongated extended emission around the point-like source, and a constant 2D background component (c3). We fixed the location of the Gaussian functions at the centroid of the emission, and allowed the position angle and ellipticity of the extended Gaussian to be free parameters. The FWHM (in units of 0.131 arc seconds per pixel), the amplitude ( in counts/pixel at the peak) for the Gaussian components, and the background amplitude (counts/pixel) were also free parameters of the fit.
The X-ray emission associated with the point source and its extended sub-nebula is obtained by integrating the flux within the outer contour shown in Figure 2. This is an isophote that is just above the mean background (0.039 counts/pixel), and we have 2064 net counts. Converting to luminosity, we use a photon power-law index for just the central region of 3C 58 (Torii et al. (2000)), a column density of , and a distance to 3C 58 pc 2.6 kpc (Green and Gull (1982)) , to obtain Using the model parameters, we estimate the point source contribution to be 150 net counts. Converting to luminosity we obtain erg s-1
2.2.2 Timing Analysis
In a arc second radius region centered on the point source (RA=, DEC= J2000), 744 photons were extracted from the image. The event times (provided in terrestrial time by the CXC) were corrected to time at the solar system barycenter using the definitive Chandra geocentric spacecraft ephemeris. The standard CIAO axBary tool (using the JPL DE450 solar system ephemeris) provided by the CXC was used to produce a serial (time ordered) list of events.
This list was analyzed using the FFT programs included in the IRAF PROS package resulting in a strong signal at 30.451 Hz (corresponding to a 32.839 msec period). A standard epoch fold around this period gives a light curve with a single sharp pulse and a duty cycle of about 10-15%. We noted that the sharply peaked nature of this pulse profile could indicate that the true period is twice as long, and that its second harmonic could dominate the other harmonics giving the strong FFT signal at seen at 30.451 Hz. To test this hypothesis, we folded the data modulo a range of periods around 65.679 ms and a over a range of period derivatives in order to maximize the signal-to-noise of the resulting pulse profile. The best profile, with a significance of as determined using for a non-varying, constant model, is shown in Figure 3.

Here we clearly see a double pulsed signal that is slightly asymmetric, with the two pulses about 180 degrees apart in phase angle, explaining why the light curve for a 32.839 msec period shows one pulse. We take the presence of two pulses of different amplitude and shape as evidence that that we have detected a pulsar, which we designate PSR J0205+6449, and that the true neutron star rotation period is msec (as determined on barycentric MJD 51901.330). We also find . A similar analysis of the times series list was made using techniques developed by Ransom (2001) for faint radio pulsar detection (discussed in more detail below). As expected we obtained the same results. The pulsed fraction for the folded light curve in Figure 3 is . However, there is significant “contamination” of the pulsed emission due to the projected emission from the extended sub-nebula. Using the spatial model described in Section 2.2.1, we integrated the surface brightness from the three components over the inner 1 arc second region used for the light curve generation. We obtained 150 counts from the pulsar (g1), 557 counts from the sub-nebula (g2), and 8 counts of background (c3). Thus, the true pulsed fraction could be as high as 100%.
3 Observations with RXTE
To confirm the periodicity detected with Chandra, we analyzed an archival observation of 3C 58 carried out with the Rossi X-ray Timing Explorer (RXTE) on 30 September, 1997 (ObsID 20259-02-01-00). The total exposure time for this observation was 20.64 ksec, spread over a total duration of 36.12 ksec. We analyzed data recorded with the Proportional Counter Array (PCA) (Jahoda et al (1996)). The PCA consists of five identical proportional counter units (PCUs) and is sensitive to X-rays in the energy range 2-60 keV with a time-resolution of . While the PCA has no imaging capability and collects photons across a field-of-view, its large effective area () makes it well-suited to searching for sources of faint X-ray pulsations.
The raw telemetry packet data from the observation were analyzed using MIT custom software optimized for RXTE analysis. We only considered data recorded in “GoodXenon” mode, and included only photons which were recorded in the top xenon layer of the PCUs and which fell into channels 2-27 (corresponding to an approximate energy range 2-10 keV). The data were re-sampled at time-resolution, and periods when the source was earth-occulted or off-axis were excluded. A correction was then applied to the data so that the binned arrival times corresponded to barycentric dynamical time, using the Chandra source position.
With these data, we created a time series of 15 million points, and applied a Fast Fourier Transform. The resulting amplitude spectrum was searched using matched filtering techniques capable of detecting signals with constant frequency derivatives. The search is a Fourier-domain version of the “acceleration” searches used to find binary radio pulsars and was sensitive to signals with Hz/s. Incoherent summations of 1, 2, 4 and 8 harmonics were computed to improve sensitivity to narrow duty-cycle pulsations. Fourier amplitudes between the raw Fourier bins were calculated in order to minimize the “scalloping” of sensitivity (see Ransom (2001) for a thorough discussion of these techniques).
The most significant candidate from the acceleration search had a period of 65.65923(5)~msec with summed power of times the local mean power level using eight harmonics. This result confirmed the existence of periodicity found with the Chandra HRC. This summed power corresponds to an overall significance of when the number of trials searched is taken into account. The strongest individual harmonic (the third) contained only times the local mean power level, helping to explain why earlier searches of this observation did not detect pulsations.
Once the period was known, we maximized the signal-to-noise ration by folding various energy cuts of the raw data over a range of periods and period derivatives centered at and . The best pulse profile is shown in Figure 4 and has a statistical significance of as determined by calculating with respect to a constant model. The best period corresponds to 65.65923(2)~msec (at a barycentric MJD of 50721.790). The pulse shape is similar to that seen with the HRC. However, the RXTE energy band differs from the Chandra band so that energy dependent features may account for differences in the details of the light curve. Also, the RXTE data includes many events that are not associated with the pulsar, again making a detailed comparison with the HRC data difficult.

4 Interpretation
Some properties of the rotating neutron star in 3C 58 can be estimated by applying the standard magnetic dipole model (Paccini (1967); Ostriker and Gunn (1969)) to the observed data. In addition to the pulse period ( on MJD 51901.330), we directly measured the change in period by comparing the RXTE and Chandra periods and obtained . From the spin down rate the spin down energy release is given by
where we use the canonical value for the moment of inertia () of a neutron star.
The surface magnetic field at the equator of the pulsar is given by:
The characteristic age is given by:
where is the initial period, and n is the braking index. In the case of 3C 58, if we assume that and ), we obtain:
which is longer than the historical age of 820 yr. Taking a braking index less than 3 increases the estimated characteristic time as calculated above, i.e., if the index were as small as 1.5, then the characteristic age becomes 4 times larger. We conclude that if the historical age is correct, then the initial spin period for this neutron star is not negligible and we estimate its value, assuming a braking index of 3 to be:
indicating that in this supernova, the resulting neutron star was initially spinning slower than the current spin rate for the Crab. The initial spin period is not a sensitive function of the assumed braking index. For example, if the braking index is as low as n=1.5, then the initial spin period is 60.86 msec.
5 Discussion
The 3C 58/J0205+6449 system is remarkably similar to the Crab Nebula/Pulsar in several respects. While we defer a more detailed discussion of the pulsar and compact nebula, and their relationship to the overall energetics of 3C 58, to a future publication, we discuss here some of the basic observational characteristics. The non-thermal spectrum of 3C 58 indicates that most X-ray emission is from synchrotron radiation and, since the nebula is centered on, and brightest in the vicinity of the pulsar, we conclude that the pulsar must be the source of power. Indeed, the we calculate, can easily supply the nebular X-ray energy, . The pulsar wave-form, two narrow peaks separated 180 degrees in phase, also indicates a non-thermal origin. The two systems, however, differ significantly in luminosity. Nebular X-ray emission from 3C 58 is a factor of less than that of the Crab Nebula and the pulsed X-ray luminosity of J0205+6449 is a factor of less that that of the Crab Pulsar. Although the weaker pulsed emission might be explained by beaming, the weaker nebular emission requires that the energy loss of the 3C 58 pulsar be considerably less than that of the Crab. There are empirical relationships discussed in the literature between the spin down energy of a pulsar and either the synchrotron nebula X-ray luminosity (e.g., Seward and Wang (1988)) or the total pulsar X-ray luminosity (e.g.,Becker and Truemper (1997)). For 3C 58, both the predicted X-ray nebula luminosity and the total pulsar luminosity are a factor of 10 or more greater than that observed.
There have been several attempts to derive pulsar characteristics that would fit the nebular measurements. Most inferred a pulsar having high P and large B: Seward and Wang (1988), P = 550 msec B = Gauss; Frail and Moffett (1993): P = 730 msec, B= Gauss; Helfand, Becker, and White (1995), P = 200 msec, B= Gauss. Others postulated an energy source that has turned off or somehow changed configuration (Green and Scheuer (1992); Woltjer et al. (1997)). Our observation shows, however, that the 3C 58 pulsar is not unusual but is remarkably Crab-like. The known age of 3C 58 leads to the conclusion that the pulsar, in contrast to the Crab Pulsar, has not slowed much since birth, and that the luminosity has always been low compared to the present luminosity of the Crab Pulsar. Like the Crab Pulsar, J0205+6449 should exhibit pulsed optical and radio emission. Now that the period is known, a sensitive search would be worthwhile.
Although 3C 58 is commonly accepted as the remnant of SN1181, agreement on this association is not unanimous (Huang (1986)). Bietenholz, Kassim and Weiler (2001) have recently observed the radio expansion of 3C 58. They suggest that it is too slow for a free expansion of a young remnant and suggest that the age of the remnant could be close to 5000 years, in agreement with the characteristic age we derive for J0205+6449 assuming that and n=3. However, since deceleration of the remnant might be expected, and since there are no other good candidates for the remnant of SN1181, we contend that the first interpretation - a low luminosity pulsar with little slowing - is more likely to be correct.
We are left with 3C 58 containing a relatively normal pulsar (albeit one that was born spinning
slowly) yet still being unusual with its low X-ray luminosity, radio flux density increasing with time, and a sharp low frequency spectral break which are all hard to understand in the context of our results.
References
- Becker, Helfand, and Szymkowiak (1982) Becker, R. H., Helfand, D. J., and Szymkowiak, A. E. 1982,ApJ 255,557
- Becker and Truemper (1997) Becker, R. H. and Truemper, J. 1997 A&A 326, 682
- Bietenholz, Kassim and Weiler (2001) Bietenholz, M.F., Kassim, N.E., Weiler, K. W., 2001, Astro-ph/0106334
- Clark and Stephenson (1977) Clark, D.H., Stephenson, F.R., 1977, The Historical Supernova, Pergamon, Oxford
- Frail and Moffett (1993) Frail, D.A. and Moffett, D.A., 1993, ApJ 408, 637
- Garmire (1997) Garmire
- Green and Gull (1982) Green, D. A., and Gull, S. F. 1982, Nature 299, 606
- Green and Scheuer (1992) Green, D.A., and Scheuer, P.G.A., 1992, MNRAS 258, 833
- Helfand, Becker, and White (1995) Helfand, D. J., Becker, R. H., and White, R. L. 1995, ApJ 453, 741
- Huang (1986) Huang, J.L., 1986, Bull. AAS 18, 1043
- Jahoda et al (1996) Jahoda, K., Swank, J. H., Giles, A. B., Stark, M. J., Strohmayer, T., Zhang, W. and Morgan, E. H., 1996, Proc. SPIE 2808, 59
- Murray (1997) Murray
- Murray (2000) Murray 2000
- Murray et al (2001) Murray, S.S., et al 2001
- Ostriker and Gunn (1969) Ostriker, J. P. and Gunn, J. E. 1969, ApJ 157,1395
- Paccini (1967) Pacini, F. 1967, Nature 216,567
- Ransom (2001) Ransom, S.M. Harvard University, Department of Astronomy PhD Thesis, 2001
- Roberts et al (2000) Roberts, M.S.E., et al, 2000, AAS Head Mtg 32.4411
- Seward and Wang (1988) Seward, F. D. and Wang, Z. 1988, ApJ 332,199
- torii et al (1999) Torii, K et al, 1999 ApJ 523, L69
- Torii et al. (2000) Torii, K., Slane, P. O., Kinigasa, K., Hashimotodani, K., Tsunemi, H. 2000, PASJ 52,875
- Woltjer et al. (1997) Woltjer, L., Salvati, M., Pacini, F., and Bandiera, R., 1997, A&A 325, 295