The Constant-Velocity Highly Collimated Outflows of the Planetary Nebula He 2-90
Abstract
We present high-dispersion echelle spectroscopic observations and a narrow-band [N ii] image of the remarkable jet-like features of He 2-90. They are detected in the echelle spectra in the H and [N ii] lines but not in other nebular lines. The [N ii]/H ratio is uniformly high, 1. The observed kinematics reveals bipolar collimated outflows in the jet-like features and shows that the southeast (northwest) component expands towards (away from) the observer at a remarkably constant line-of-sight velocity, 26.00.5 km s-1. The observed expansion velocity and the opening angle of the jet-like features are used to estimate an inclination angle of with respect to the sky plane and a space expansion velocity of 290 km s-1. The spectrum of the bright central nebula reveals a profusion of Fe lines and extended wings of the H line, similar to those seen in symbiotic stars and some young planetary nebulae that are presumed to host a mass-exchanging binary system. If this is the case for He 2-90, the constant velocity and direction of the jets require a very stable dynamic system against precession and warping.
1 Introduction
He 2-90 is a planetary nebula (PN) originally discovered by Henize (1967). It was classified as a compact PN Be star, i.e., a low-mass star in or evolving into the PN phase, by Lamers et al. (1998) based on spectroscopic observations by Costa, de Freitas-Pacheco, & Maciel (1993) (hereafter CdFM93). Recent images of He 2-90 in the H line have revealed remarkably linear jet-like bipolar features consisting of six pairs of evenly spaced knots emanating from the bright central nebula (Sahai & Nyman, 2000, hereafter SN00). Similar straight jet-like features have been observed in young stellar objects (e.g., HH 30, Burrows et al., 1996), but the high N/O abundance ratio clearly indicates that He 2-90 is an evolved object (CdFM93).
Collimated outflows are frequently seen in PNs (Guerrero, Miranda, & Chu, 2000; Gonçalves, Corradi, & Mampaso, 2001, and references therein), but the straight, intermittent, jet-like features in He 2-90 are unique among PNs. To study the intriguing features in He 2-90, we have obtained narrow-band images in the [N ii] emission line and long-slit echelle spectroscopic observations. These observations not only confirm the collimated outflow nature of the jet-like features, but also detect additional pairs of knots that were not detected by the images and reveal new properties of He 2-90. We report these observations and results in this paper.
2 Observations
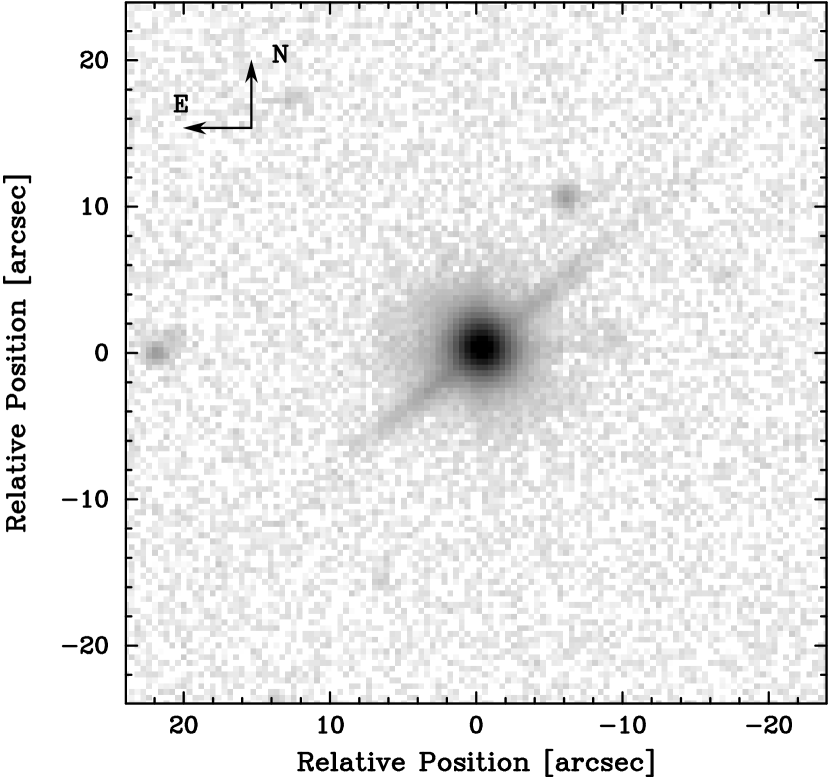
A narrow-band image of He 2-90 in the [N ii] 6584 emission line was obtained on 2000 December 5 with the 0.9 m telescope at the Cerro Tololo Inter-American Observatory (CTIO). The central wavelength and FWHM of the [N ii] filter are 6584 Å and 15 Å, respectively. The detector was the Tek 2K CCD with a pixel size of 24 m. The image scale was pixel-1 and the seeing during the observations was , as measured from field stars in the image. The integration time was 300 s.
High-dispersion spectroscopic observations of He 2-90 were obtained on 2000 December 4 and 5 using the echelle spectrograph on the CTIO 4 m telescope. The slit was oriented at PA along the jet-like features of He 2-90 (see Appendix for a detailed explanation of the slit orientation). On the first night, the spectrograph was set up in the multi-order mode to cover the spectral range from 3880 Å to 7200 Å with a slit length of . On the second night, the spectrograph was used in the single-order, long-slit mode, covering only the H and [N ii] 6548,6584 lines but with a slit length of 3′. The total integration times were 300 s and 600 s for the multi-order and single-order observations, respectively. In both cases, the spectrograph was used with the 79 line mm-1 echelle grating and the long-focus red camera; the resultant reciprocal dispersion was 3.4 Å mm-1. The data were recorded with the SITE 2K CCD with a pixel size of 24 m. This configuration provides a spatial scale of pixel-1 and a sampling of 3.7 km s-1 pixel-1 along the dispersion direction. The multi-order and single-order observations were made with slit widths of and , and the resultant instrumental FWHMs were 8 km s-1 and 12 km s-1, respectively. The angular resolution, determined by the seeing, was . Observations of the spectrophotometric standard HR 3454 were used for flux calibration.
3 Results
3.1 Morphology in the [N ii] Narrow-band Image
The [N ii] image of He 2-90 is shown in Figure 1. The straight jet-like features described by SN00 in H are clearly present in [N ii], and can be traced down to from the center of the bright core of the nebula. The surface brightness of the jet-like features decreases steeply with radial distance. Emission is detected up to a radial distance of , and possibly up to . Our spatial resolution does not allow us to clearly resolve the individual knots described by SN00, but the surface brightness enhancements at , , and from the center appear to correspond to SN00’s knots cc′, dd′, and ff′.
3.2 Spectra of the Jet-like Features
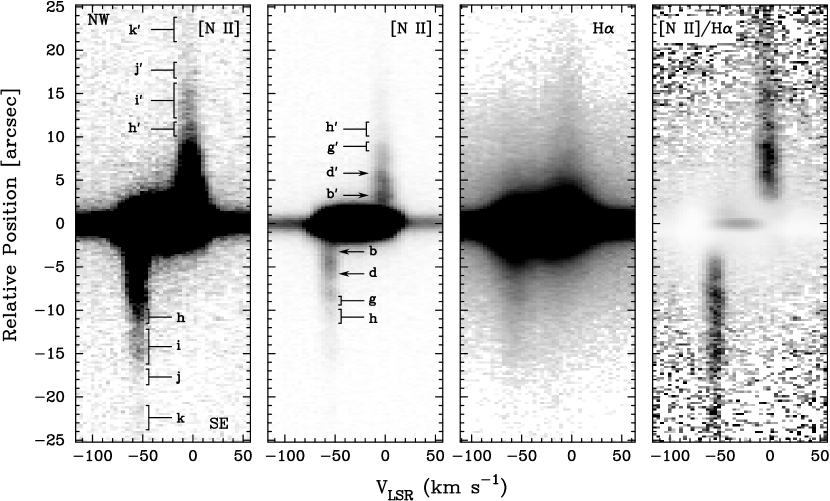
The echellograms of the H and [N ii] 6584 lines observed in the single-order, long-slit mode are shown in Figure 2. Both lines reveal a bipolar outflow structure in the jet-like features. The velocity difference between the approaching southeast and receding northwest components is km s-1. The observed FWHM of the [N ii] line in these outflows is typically 16 km s-1, corresponding to an intrinsic FWHM of 10 km s-1 (removing the instrumental contribution to the observed width). The H line in the outflows is wider, with an observed FWHM of km s-1, corresponding to an intrinsic FWHM of km s-1. The systemic velocity of the bipolar outflows and the central nebula is VLSR 30 km s-1, in agreement with the value reported by CdFM93. The radial velocity along the outflows is remarkably constant, with variations smaller than 0.5 km s-1, i.e., less than 2% of the observed velocity. Regardless of the inclination angle, the fractional variations of the expansion velocity of these ouflows ought to be the same as the fractional variations of the observed radial velocity, i.e., , unless the tangential velocity does not co-vary with the radial velocity (an unlikely situation). The constant radial expansion velocity and the straight linear morphology of the jet-like features in He 2-90 can only be understood if they are expanding with a constant space velocity.
The [N ii] echellogram shows knotty structure in the jet-like features. The surface brightness of the [N ii] line along the slit is plotted in Figure 3 to illustrate the distribution of the knots. The counterparts of SN00’s knots bb′ and dd′ are clearly seen, but the other knots cannot be discerned because of our poorer spatial resolution. In addition, we find five more pairs of knots extending beyond SN00’s knots ff′; these newly discovered knots have been labeled as gg′, hh′, ii′, jj′, and kk′ in Figures 2 and 3. The pairs of knots hh′ and jj′ at radial distances up to and from the center correspond to the positive and possible detections of emission in the [N ii] image (Fig. 1).
The jet-like features of He 2-90 have a uniformly high [N ii] to H ratio of 1 (Fig. 2). The multi-order echelle observations of He 2-90 allow us to look for emission from the jet-like features along the -long slit at other spectral lines in which the central nebula is detected. However, no emission in any other line is detected in this 5-minute echelle observation. More specifically, no [O iii], [O i], or [S ii] emission from the jet-like features is detected. This spectral property is very different from that of the central nebula which has an [O iii] line strength similar to [N ii]. It is also different from those observed in shocks, where the [O i] and [S ii] lines are usually enhanced.
Finally, we note that an additional pair of faint bipolar features are detected in the H echellogram, but not in [N ii], in Fig. 2. This pair of bipolar features expand in the opposite direction to that of the aforementioned prominent bipolar outflow, but with a smaller velocity difference (V 42 km s-1) and a shorter spatial extent (8).
3.3 Spectrum of the Central Nebula
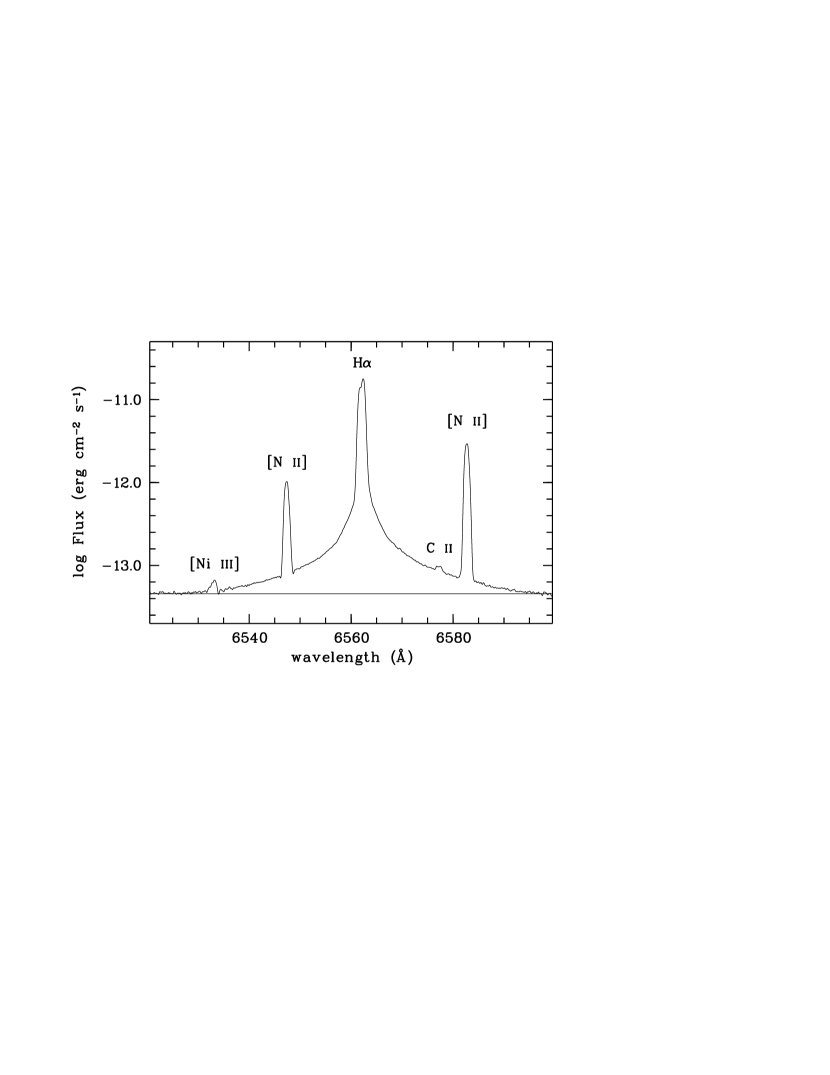
The echelle observations of the central nebula reveal a wealth of emission lines. In addition to the H i Balmer, He i, [O i], [O iii], [Ar iii], and [N ii] lines described by CdFM93, we also detect C ii, Fe ii, [Fe ii], [Fe iii], [Fe iv], [Ni iii], and Si ii emission lines. Among all these species, [Fe iii] exhibits by far the strongest lines and the richest spectrum. The identification of these lines, and their measured strength, , and intrinsic strength, , normalized to the H line (=100.0) are listed in Table 1. The H flux is erg cm-2 s-1. The extinction is determined from Balmer decrements using the H, H, and H lines. We derive an extinction in good agreement with CdFM93 value. This amount of extinction and the extinction factor derived from Whitford’s (1958) reddening law, , are used to underedden the spectrum.
The profiles of the emission lines can be grouped into three broad categories: double-peaked profiles with peak-to-peak separation km s-1 (e.g., [O iii], [Ar iii], He i, and H and H), broad single-peaked profiles (FWHM 40 km s-1) apparently composed by two blended components (e.g., [N ii], and [Fe iii]), and narrow (FWHM 30 km s-1) single-peaked profiles (e.g., [S ii], and [O i]). Examples of these are shown in Figure 4. In all the double-peaked profiles, the red peak is brighter than the blue one (see Table 1), thus indicating that the brighter component is receding and the fainter component is approaching. The much more reduced peak brightness contrast of the H line in our observations () than in SN00’s observations () can be attributed to our limited spatial resolution and coarse sampling (the angular distance between the northwest and southeast components is , i.e., the pixel size of our observations, and more than 3 times smaller than the seeing). Bearing this in mind, we conclude that the brighter northwest component is receding rather than approaching as assumed by SN00.
Very extended wings are observed in the H line (Fig. 5) with a full-width at zero intensity of km -1 ( Å). This value is larger than km -1 reported by CdFM93. Although this difference could be due to the higher spectral resolution and/or sensitivity of our observations, we cannot rule out that the H line profile has dramatically varied in the past 8 years. This possibility requires further investigation.
The anomalously high ratios of [O iii] 0.16 and [N ii] 0.022 indicate that these lines arise from high density regions. The high density is also indicated by the [S ii] doublet ratio, which is at the high-density limit ( cm-3). Assuming that 15,000 K, the measured [O iii] and [N ii] line ratios imply cm-3, consistent with the value reported by CdFM93. A lower would result in an even higher . The relative intensities of the [Fe iii] lines also indicate cm-3, and K.
4 Discussion
Despite its unique morphology, He 2-90 has spectral properties similar to young PNs, e.g., M 1-91, M 1-92, M 2-9, and IC 4997 (Balick, 1989; Goodrich, 1991; Solf, 1994; Miranda, Torrelles, & Eiroa, 1996; Bujarrabal et al., 1998), or symbiotic stars, e.g., RX Pup, R Aqr, and V1016 Cyg (Solf & Ulrich, 1985; Ivison, Bode, & Meaburn, 1994; Corradi et al., 1999; Mikolajewska et al., 1999). Rich Fe emission spectra from high density cores, extended wings in the H line, extreme bipolar morphologies and collimated outflows are all common features of these nebulae. Our observations of He 2-90 do not allow us to ascertain the presence or lack of TiO absorption bands, a characteristic signature of symbiotic stars. Therefore, the exact nature of He 2-90 remains uncertain.
The kinematic properties of the jet-like features confirm their outflow nature and high collimation. The low line-of-sight expansion velocity most likely indicates that the outflow moves close to the plane of the sky. As with SN00, we also assume that the opening angle of the jet-like features () is determined by the transverse expansion of the knots. The profile of the [N ii] line can be decomposed into thermal and turbulent components with FWHMs of 5.7 km s-1 (for 104 K) and 8.7 km s-1, respectively. The FWHM of the turbulent component is much smaller than the FWHM of the thermal component of hydrogen (21.4 km s-1 at 104 K); therefore, the transverse expansion velocity () of the knots is dominated by the sound velocity 10 km s-1 which is consistent with the FWHM of the H line. The expansion velocity projected on the sky plane111 Note that SN00’s derivation of the jet velocity contains an error. They used the full opening angle, instead of half of the opening angle, and the inclination in the relation between the transverse expansion velocity and the jet velocity. This caused the difference between their and our results. is 286 km s-1. From this and the observed line-of-sight expansion velocity, 26 km s-1, we derive a space expansion velocity of 287 km s-1 and an inclination angle of with respect to the sky plane. Notice that the uncertainties associated to the determination of the opening angle of the jet-like features and their transverse expansion velocity can introduce a large error in the values derived for the space expansion velocity and inclination angle. For the estimated values of the space expansion velocity and inclination angle, the expected proper motion is yr-1, where is the distance in kpc to He 2-90. It is possible to measure this proper motion with multi-epoch observations.
The large expansion velocity and high collimation of the bipolar features in He 2-90 qualify them to be called “jets”. This expansion velocity is low compared to those expected in jets arising from accretion disks around massive compact objects, i.e., neutron stars and black holes (Livio, 1999). However, the bipolar outflows in He 2-90 are in accord with fast collimated outflows in many PNs and proto-PNs, such as He 3-1475, MyCn 18, NGC 2392, and OH 231.8+4.2 (Bobrowsky et al., 1995; Bryce et al., 1997; Gieseking, Becker, & Solf, 1985; Riera et al., 1995; Sánchez Contreras et al., 2000). Similarly, the high [N ii]/H ratio and the lack of [O i] and [S ii] emission, while contrary to shock-excited spectra of Herbig-Haro (HH) objects (Raga, Böhm, & Cantó, 1996), are typical for FLIERs and fast outflows in PNs (Hajian et al., 1997; Balick et al., 1998; O’Connor et al., 2000).
The kinematics of the bipolar outflows shows that the southeastern component is approaching and the northwestern component receding. This disagrees with the orientation proposed by SN00 based on the surface brightness variation across the central nebula and the assumption that differential obscuration makes the approaching side appear brighter than the receding side. Our echelle spectrum of the central nebula shows, however, that the receding component is brighter than the approaching component (see Fig. 4), contrary to SN00’s assumption. A similar situation is observed in OH 231.8+4.2 of which the brighter lobe is receding from us (Sánchez Contreras et al., 2000).
The observations reported in this paper confirm the presence of highly collimated bipolar outflows in He 2-90. We find that all material in the bipolar outflows expands at a constant velocity, with 2% fractional variations of the expansion velocity. We have further estimated the expansion velocity and inclination of the outflows. These results, in conjunction with upcoming imagery to study the proper motion of the jets ( program ID: 9102, PI: R. Sahai), will help constrain the distance to He 2-90 and the dynamics of the bipolar outflows. We also find that the spectrum of the central nebula of He 2-90 is very similar to that observed in some proto-PNs, young PNs, and symbiotic stars whose origin is most likely related to the evolution of mass-exchanging close binary systems. If the bipolar outflows of He 2-90 are caused by an accretion disk associated with such a binary system, the periodic ejection of knots along the same direction at a constant velocity requires an extremely stabledynamics of the system against precession and warping of the accretion disk. Considering that most jets and outflows in PNs show evidence of precession and wobbling, the stable dynamics of He 2-90 is truly unusual.
References
- Balick (1989) Balick, B. 1989, AJ, 97, 476
- Balick et al. (1998) Balick, B., Alexander, J., Hajian, A. R., Terzian, Y., Perinotto, M., & Patriarchi, P. 1998, AJ, 116, 360
- Bobrowsky et al. (1995) Bobrowsky, M., Zijlstra, A. A., Grebel, E. K., Tinney, C. G., Te Lintel Hekkert, P., van de Steene, G. C., Likkel, L., & Bedding, T. R. 1995, ApJ, 446, L89
- Bryce et al. (1997) Bryce, M., Lopez, J. A., Holloway, A. J., & Meaburn, J. 1997, ApJ, 487, L161
- Bujarrabal et al. (1998) Bujarrabal, V., Alcolea, J., Sahai, R., Zamorano, J., & Zijlstra, A. A. 1998, A&A, 331, 361
- Burrows et al. (1996) Burrows, C. J., et al. 1996, ApJS, 473, 437
- Corradi et al. (1999) Corradi, R. L. M., Ferrer, O. E., Schwarz, H. E., Brandi, E., & García, L. 1999a, A&A, 348, 978
- Costa, de Freitas-Pacheco, & Maciel (1993) Costa, R. D. D., de Freitas-Pacheco, J. A., & Maciel, W. J. 1993, A&A, 276, 184 (CdFM93)
- Gieseking, Becker, & Solf (1985) Gieseking, F., Becker, I., & Solf, J. 1985, ApJ, 295, L17
- Goodrich (1991) Goodrich, R. W. 1991, ApJ, 366, 163
- Gonçalves, Corradi, & Mampaso (2001) Gonçalves, D. R., Corradi, R. L. M., & Mampaso, A. 2001, ApJ, 547, 302
- Guerrero, Miranda, & Chu (2000) Guerrero, M. A., Miranda, L. F., & Chu, Y.-H. 2000, Ionized Gaseous Nebulae. Mexico City November 21–24, 2000, in press
- Hajian et al. (1997) Hajian, A. R., Balick, B., Terzian, Y., Perinotto, M. 1997, ApJ, 487, 304
- Henize (1967) Henize, K. G. 1967, ApJS, 14, 125
- Ivison, Bode, & Meaburn (1994) Ivison, R. J., Bode, M. F., & Meaburn, J. 1994, A&AS, 103, 201
- Lamers et al. (1998) Lamers, H. J. G. L. M., Zickgraf, F., de Winter, D., Houziaux, L., & Zorec, J. 1998, A&A, 340, 117
- Livio (1999) Livio, M. 1999, Phys. Rep., 311, 225
- Mikolajewska et al. (1999) Mikolajewska, J., Brandi, E., Hack, W., Whitelock, P. A., Barba, R., García, L., & Marang, F. 1999, MNRAS, 305, 190
- Miranda, Torrelles, & Eiroa (1996) Miranda, L. F., Torrelles, J. M., & Eiroa, C. 1996, ApJ, 461, L111
- O’Connor et al. (2000) O’Connor, J. A., Redman, M. P., Holloway, A. J., Bryce, M., López, J. A., & Meaburn, J. 2000, ApJ, 531, 336
- Raga, Böhm, & Cantó (1996) Raga, A. C., Böhm, K.-H., & Cantó, J. 1996, 1996, Revista Mexicana de Astronomía y Astrofísica, 32, 161
- Riera et al. (1995) Riera, A., García-Lario, P., Manchado, A., Pottasch, S. R., & Raga, A. C. 1995, A&A, 302, 137
- Sahai & Nyman (2000) Sahai, R. & Nyman, L.-Å 2000, ApJ, 538, L145 (SN00)
- Sánchez Contreras et al. (2000) Sánchez Contreras, C., Bujarrabal, V., Miranda, L. F., & Fernández-Figueroa, M. J. 2000, A&A, 355, 1103
- Solf (1994) Solf, J. 1994, A&A, 282, 567
- Solf & Ulrich (1985) Solf, J. & Ulrich, H. 1985, A&A, 148, 274
- Whitford (1958) Whitford, A. E. 1958, AJ, 63, 201
Our echelle observations show that the southeast side of He 2-90 is blue-shifted and the northwest side red-shifted. Because this direction is opposite to that proposed by SN00 based on the surface brightness variation of the bright central nebula, the referees were concerned that our slit orientation was reversed. At the referee’s request, we describe in detail in this appendix how our slit orientation was determined and verified.
The echelle spectrograph on the CTIO 4 m telescope can be rotated at the Cassegrain mount, and the slit position is recorded as the “rotation angle” which is related to the position angle (measured counterclockwisely from the north) by rotation angle = position angle + 180∘. In the data array, the vertical axis is spatial and the horizontal axis is spectral. The direction toward the position angle is at the bottom of the echellogram. For example, a EW slit has a position angle of 90∘, a rotation angle of 270∘, and east is at the bottom of the echellogram; a NS slit has a position angle of 0∘, a rotation angle of 180∘, and north is at the bottom of the echellogram. The relationship between the position angle and the orientation in the echellogram has been verified by observations of supernova remnants in the Magellanic Clouds. The surface brightness of these supernova remnants has no symmetry, and hence offers unambiguous verification.
The slit position we used for the observations of He 2-90 was along the position angle 130∘, corresponding to a rotation angle of 310∘, thus the southeast side should be at the bottom and the northwest side at the top of the echellogram. The echellogram shows that the southeast side of the outflow is approaching and the northwest side of the outflow is receding.
Another indirect confirmation of the slit orientation is the spectrum of the central nebula. The H image of the central nebula shows that the southeast lobe is much brighter than the northwest lobe, which formed the basis of SN00’s assumption that the northwest lobe is obscured and is receding. Our spectrum of the central nebula shows that the receding component is brighter than the approaching component. The brightness contrast between the receding component and the approaching component is not as dramatic as the contrast between the southeast and northwest lobes of the central nebula in the image because the echelle spectrum is extracted from a large aperture (1′′25) that includes both lobes. The inclusion of extended emission has diluted the contrast in the very central region. While our echelle observation of the central nebula does not have any spatial information, the comparison of intensity variation in the velocity profile and the surface brightness variation in the image suggests that the bright northwest side is receding and the faint southeast side is approaching. This is in full agreement with the orientation of the outflows.
| Line | Line | ||||||||
|---|---|---|---|---|---|---|---|---|---|
| [Å] | [Å] | ||||||||
| 4101.3 | H i 4101.7 | 10.0 | 0.172 | 24.0 | 5875.0 | He i 5875.7 | 47.2 | –0.126 | 15.5 |
| 4340.05 | H i 4340.5 | 25.3 | 0.129 | 48.6 | 5874.67 | He i 5875.7 blue | 17.1 | –0.126 | 5.6 |
| 4343.0 | [Fe ii] 4343.8 ? | 3.1 | 0.128 | 5.9 | 5875.29 | He i 5875.7 red | 30.1 | –0.126 | 9.9 |
| 4362.7 | [O iii] 4363.2 | 3.3 | 0.124 | 6.2 | 5957.1 | Si ii 5957.6 | 0.6 | –0.230 | 0.19 |
| 4471.1 | He i 4471.5 | 3.0 | 0.095 | 4.9 | 5978.4 | Si ii 5978.9 | 1.5 | –0.234 | 0.5 |
| 4657.7 | [Fe iii] 4658.1 | 3.5 | 0.049 | 4.5 | 5999.6 | [Ni iii] 6000.2 | 0.6 | –0.237 | 0.18 |
| 4701.1 | [Fe iii] 4701.6 | 1.8 | 0.038 | 2.2 | 6248.4 | Fe ii 6247.6 ? | 0.3 | –0.277 | 0.07 |
| 4769.2 | [Fe iii] 4769.4 | 0.6 | 0.024 | 0.7 | 6346.5 | Si ii 6347.1 | 1.8 | –0.292 | 0.4 |
| 4860.9 | H i 4861.33 | 100.0 | 100.0 | 6363.2 | [O I] 6363.8 | 1.3 | –0.294 | 0.3 | |
| 4860.54 | H i 4861.33 blue | 40.4 | 40.4 | 6370.7 | Si ii 6371.4 | 0.9 | –0.295 | 0.20 | |
| 4861.05 | H i 4861.33 red | 59.6 | 59.6 | 6383.8 | Fe ii 6383.7 | 1.0 | –0.297 | 0.22 | |
| 4921.5 | He i 4921.9 | 1.8 | –0.014 | 1.7 | 6401.0 | [Ni iii] 6401.5 | 0.3 | –0.300 | 0.06 |
| 4958.4 | [O iii] 4958.9 | 68.3 | –0.023 | 62.0 | 6533.0 | [Ni iii] 6533.9 | 1.0 | –0.318 | 0.19 |
| 4958.10 | [O iii] 4958.9 blue | 29.3 | –0.023 | 26.6 | 6547.3 | [N ii] 6548.0 | 55.6 | –0.321 | 10.7 |
| 4958.70 | [O iii] 4958.9 red | 39.0 | –0.023 | 35.4 | 6562.14 | H i 6562.85 | 1523.4 | –0.323 | 284.7 |
| 5006.35 | [O iii] 5006.84 | 254.0 | –0.034 | 219.7 | 6561.66 | H i 6562.85 blue | 555.5 | –0.323 | 103.8 |
| 5006.01 | [O iii] 5006.84 blue | 113.9 | –0.034 | 98.5 | 6562.43 | H i 6562.85 red | 777.7 | –0.323 | 145.3 |
| 5006.62 | [O iii] 5006.84 red | 140.1 | –0.034 | 121.2 | 6577.3 | C ii 6578.0 | 0.8 | –0.325 | 0.15 |
| 5010.8 | [Fe iii] 5011.3 | 2.3 | –0.035 | 2.0 | 6582.7 | [N ii] 6583.37 | 171.7 | –0.326 | 33.2 |
| 5015.3 | He i 5015.7 | 4.0 | –0.036 | 3.5 | 6515.8 | [S ii] 6716.5 | 0.83 | –0.343 | 0.15 |
| 5055.4 | Si ii 5056.0 | 0.5 | –0.045 | 0.4 | 6730.1 | [S ii] 6730.8 | 1.91 | –0.345 | 0.33 |
| 5270.1 | [Fe iii] 5270.4 | 3.3 | –0.089 | 2.1: | 6996.3 | [Fe iv] 6997.1 | 1.0 | –0.375 | 0.15 |
| 5316.2 | Fe ii 5316.6 | 0.7 | –0.099 | 0.4 | 7001.4 | O i 7001.7 | 0.4 | –0.375 | 0.06 |
| 5411.8 | [Fe iii] 5412.0 | 0.4 | –0.118 | 0.2 | 7064.5 | He i 7065.3 | 35.2 | –0.383 | 5.1 |
| 5517.5 | [Cl iii] 5517.7 | 0.44 | –0.139 | 0.21 | 7135.1 | [Ar iii] 7135.8 | 123.2 | –0.391 | 17.0 |
| 5537.1 | [Cl iii] 5537.9 | 0.50 | –0.143 | 0.24 | 7134.69 | [Ar iii] 7135.8 blue | 54.9 | –0.391 | 7.6 |
| 5551.2 | N ii 5551.9 | 0.3 | –0.146 | 0.15 | 7135.46 | [Ar iii] 7135.8 red | 68.3 | –0.391 | 9.4 |
| 5754.0 | [N ii] 5754.6 | 19.8 | –0.191 | 7.2 | 7154.5 | [Fe ii] 7155.1 | 0.8 | –0.392 | 0.11 |
| 7171.3 | [Fe ii] 7172.0 | 0.6 | –0.394 | 0.08 |