Pismis 2, a poorly studied, intermediate age open cluster††thanks: Based on observations collected at the European Southern Observatory, Chile
Abstract
We present CCD photometry of the intermediate age open cluster Pismis 2, covering from the brighter red giants to about 5 magnitudes below the main sequence turn-off. The cluster is heavily reddened and is possibly affected by a differential reddening of 0.04–0.06.
Using the synthetic Colour - Magnitude Diagram method, we estimate in a self-consistent way distance modulus, (m-M)0 12.5–12.7, and age, 1.1-1.2 Gyr. The cluster probably contains a significant fraction of binary systems. The metallicity is most likely solar and the reddening ranges between 1.26 and 1.32 depending on the cluster region.
keywords:
Hertzsprung-Russell (HR) diagram – open clusters and associations: general – open clusters and associations: individual: Pismis 21 Introduction
The rôle of old and intermediate age open clusters (OCs) in probing the chemical and dynamical evolution of the Galactic disc has long been recognized (e.g., Panagia & Tosi 1981, Friel 1995). Over the last years, several authors have collected a considerable amount of high quality photometric data, but to fully exploit OCs’ potentialities, results have to be based on a sample as complete (to ensure significance) and as homogeneous (to avoid spurious effects due to the use of different techniques) as possible.
To this end, we are homogeneously analysing with great accuracy a sample of open clusters at various galactic locations and covering a wide range in age and metallicity, in order to significantly sample the disc properties both in space and time. Up to now we have published results for NGC 7790, NGC 2660, NGC 2506, Berkeley 21, NGC 6253, NGC 2243, and Collinder 261, in order of increasing age, from 0.1 to at least 7 Gyr (see Sandrelli et al. 1999, Bragaglia et al. 2000 and references therein). Age, distance, reddening and approximate metallicity are derived from deep photometry combined with the synthetic Colour-Magnitude diagrams method (Tosi et al. 1991). Whenever possible, we complement the photometric study with high resolution spectroscopy, to derive accurate metal abundances (Carretta et al. 2000, Bragaglia et al. 2001).
This paper is part of our general project of observations of galactic open clusters; we present here results on the open cluster Pismis 2 (Pismis 1959), or C0816-414, with coordinates , , l=258.83, b=–3.29.
To our knowledge, the first and only colour magnitude diagram published for this object is by Phelps, Janes & Montgomery (1994, PJM94, their fig. 19); they observed in the and filters, and estimated an age of 1.1 Gyr, based on the MAI (Morphological Age Indicator, i.e. the difference in magnitude between the main sequence turn-off and the red clump). In an associated paper on the general properties of the galactic old OCs, Janes & Phelps (1994) give for this cluster = 1.48, as deduced from the mean colour of the red clump. No other measured values for reddening or metallicity could be found in literature. Patino & Friel (1994) presented preliminary results on its kinematics, based on medium resolution spectroscopy, but never published the figures; the same did Miller et al. (1995), who included Pismis 2 in a list of open clusters for which reddening could be obtained through selected spectral features. The latest interstellar absorption maps (based on FIR data) by Schlegel, Finkbeiner & Davis (1998) according to the authors cannot be trusted to give a reliable value, because of the very low galactic latitude of the cluster. However, Dutra & Bica (2000) compared reddenings derived from those maps and from photometry of star clusters, both globular and open, and found reasonable agreement also at low Galactic latitudes, except for some objects, among them Pismis 2, for which the FIR maps provided higher values (in our case, = 2.27). According to them, most of the discrepancy between the reddening values must be ascribed to dust clouds in the disc background of the clusters.
We describe the data acquisition and reduction in Section 2, the resulting colour-magnitude diagrams (CMDs), membership and reddening in Section 3. The cluster parameters are derived from the synthetic CMDs in Section 4 and a summarizing discussion is given in Section 5.
2 Observations and data reduction
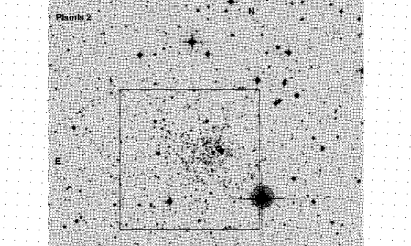
Pismis 2 was observed at the 1.54m Danish telescope located in La Silla, Chile, on UT March 10, 1995; we have only one field, centred on the cluster. The instrument used was the direct camera, mounting the CCD #28, a Tek 10241024, with a scale of 0.377 ″/pix, yielding a field of view of 6.4 arcmin2. The observed region is indicated by the central square in Fig. 1, taken from the DSS, of 15 arcmin2 (more or less the PJM94 field), and oriented with North up and East left.
We took exposures ranging from 60 to 1800 seconds in , and from 20 to 900 seconds in and , all in a 2 hours time span. Standard areas were observed just after the cluster and later during the night. Conditions were photometric, and seeing was 1″.
Standard CCD reduction of bias subtraction, trimming, and flatfield correction were performed. We applied to all frames the usual procedure for PSF study and fitting available in DAOPHOT–II (Stetson 1992) in IRAF111 IRAF is distributed by the NOAO, which are operated by AURA, under contract with NSF environment. All frames were searched independently, using the appropriate value for the FWHM of the stellar profile and a threshold of 3 to 4 over the local sky value. We used different thresholds (3, 3.5, and 4 in , , and respectively) to keep them as low as possible but avoiding false identifications due to the spikes of the saturated stars, that happened to be more numerous in the and images. In all frames, we also made a second pass with a higher threshold (6 ) to try to recover hidden components.
About 20 well isolated, bright stars were used in each frame to define the best analytical PSF model (in our case, a ”penny1” without spatial variations), which was then applied to all detected objects. The resulting magnitude file was selected both in magnitude, to avoid saturated stars, and in sharpness, a shape - defining parameter, to avoid cosmic rays and false identifications of extended objects. Areas around badly saturated stars were blanketed, i.e. we eliminated from the output catalogues all the objects falling within a radius of 20 pixels from the saturated stars.
All steps were archived as an IRAF procedure, to be reproduced during the completeness study.
All output catalogues were aligned to the one derived from the deepest image, assumed as master frame for the coordinate system, using dedicated programs developed at the Bologna Observatory by P. Montegriffo.
All output catalogues in each filter were ”forced” on the deepest one in that band simply applying a ”zero point” shift to the instrumental magnitude (ranging from a few thousandths to about one tenth of magnitude). The final magnitude catalogue in each band is the result of the (weighted) average of all measures for each stars
We computed a correction to the PSF derived magnitudes to be on the same system as the photometric standard stars: aperture photometry was performed on a few isolated stars (the same used to define the PSF) in the reference images, i.e., in the deepest frame for each filter. The correction to apply to the PSF magnitudes was found to be: –0.272 in , –0.232 mag in , and –0.233 in (in the sense aperture minus PSF).
2.1 Photometric calibration
The conversion from instrumental magnitudes to the Johnson-Cousins standard system was obtained using a set of primary calibrators (the areas Rubin 149, PG0918+029, PG1047+003, PG1323–086, PG1633+099, for a total of 26 stars: Landolt 1992). The stars defined by Landolt span a fairly wide range in colour (–0.290 +1.134, –0.295 +1.138), but the cluster is heavily reddened, and our calibration is all in extrapolation using these stars. Recently, Stetson (2000) has presented an extension to fainter magnitudes of Landolt’s standard stars fields. We have tried to recover in our frames at least some of the redder stars, to extend the colour baseline of our calibration. Only a few stars are usable, though, because of their general faintness. We could recover 6 stars in and (PG0918-S14, and S29; PG1047-S12, and S15; PG1323-S18, and S27), thus extending our colour baseline to = 2.263. Only 2 of these stars, none redder than our previous limit in instrumental , were measurable in the frames; they were not considered in the calibration of the , since their magnitudes were not given by Stetson, while they were included in the calibration.
Standard stars fields were analysed using aperture photometry. The calibration equations were derived using the extinction coefficients for La Silla taken from the database maintained by the photometric group at the Geneva Observatory Archive. Since all the 6 nights in the same run were photometric, we derived a unique calibration using the whole set of standards (Landolt’s plus Stetson’s) and obtained equations in the form:
where are instrumental magnitudes, while are the corresponding Johnson-Cousins magnitudes. Figure 2 shows three of these equations; open symbols represent Landolt stars, and filled ones Stetson objects.
We also checked that the calibration of each night taken separately does not differ from the above relations. As already said, an extension to colours as red as the cluster stars was possible only for the and filters. We note however that the extended (”Landolt” plus ”Stetson”) calibration equations in these bands produce magnitudes that differ from the traditional (”Landolt”) ones only by a few thousandths of magnitude, hence the extrapolation we are forced to adopt for the band looks quite reasonable (see, however, Section 5). We calibrated the magnitudes using the relation involving , and the and magnitudes with the ones involving (except for the few tens of stars missing , for which we had to use the colour to calibrate ).


2.2 Completeness analysis
We tested the completeness of our luminosity function in the and band on the deepest images, adding artificial stars to the frames and exactly repeating the procedure of extraction of objects and PSF fitting used for the original frame. The stars were added at random positions and selected in magnitude according to the observed luminosity function. We added 120 objects at a time, in order not to significatively alter the crowding conditions, repeating the process as many times as to reach a total of about 200,000 artificial stars. This way we approximate the condition of adding a single star each time, i.e. of a repeated, independent experiment, since the few artificial objects added in a single run do not interfere with each other. To the output catalogue of the added stars we applied the same selection criteria in magnitude and sharpness as done for the science frames. The completeness degree of our photometry at each magnitude level was computed as the ratio of the number of recovered stars to the number of simulated ones (considering as recovered objects only those found within 0.5 pix of the given coordinates, and with magnitudes differing from the input ones less than 0.75 mag), and is given in Table 1.
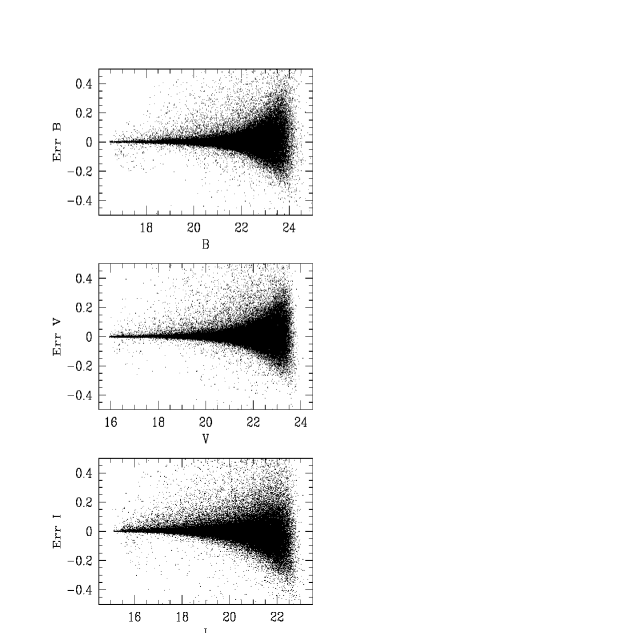
The difference between input and output magnitudes of the artificial stars provide a robust estimate of the photometric error to be associated to each magnitude bin. These errors tend to be larger than the Daophot ’s going towards fainter magnitudes. In Fig. 3 we show the results of our procedure for the three filters. These are also the errors adopted for the synthetic CMDs (see Section 4).
| Mag | compl. | compl. | compl. |
|---|---|---|---|
| 12.75 | - | - | 1.000 |
| 13.25 | - | - | 1.000 |
| 13.75 | - | 1.000 | 1.000 |
| 14.25 | 0.993 | 1.000 | 1.000 |
| 14.75 | 0.991 | 1.000 | 1.000 |
| 15.25 | 0.990 | 1.000 | 1.000 |
| 15.75 | 0.989 | 1.000 | 1.000 |
| 16.25 | 0.988 | 1.000 | 1.000 |
| 16.75 | 0.989 | 1.000 | 1.000 |
| 17.25 | 0.990 | 1.000 | 0.988 |
| 17.75 | 0.992 | 0.997 | 0.985 |
| 18.25 | 0.991 | 0.995 | 0.982 |
| 18.75 | 0.990 | 0.997 | 0.978 |
| 19.25 | 0.990 | 0.994 | 0.972 |
| 19.75 | 0.989 | 0.992 | 0.963 |
| 20.25 | 0.988 | 0.992 | 0.951 |
| 20.75 | 0.986 | 0.994 | 0.936 |
| 21.25 | 0.984 | 0.986 | 0.906 |
| 21.75 | 0.980 | 0.985 | 0.810 |
| 22.25 | 0.971 | 0.966 | 0.581 |
| 22.75 | 0.936 | 0.916 | 0.289 |
| 23.25 | 0.809 | 0.595 | 0.096 |
| 23.75 | 0.540 | 0.082 | 0.023 |
| 24.25 | 0.242 | 0.001 | 0.004 |
| 24.75 | 0.072 | - | - |
| 25.25 | 0.016 | - | - |
3 The colour - magnitude diagram
The final, calibrated sample contains 2239 stars; of them, 1195 have magnitudes in all three filters, 35 have only and magnitudes, and 1009 have only and magnitudes. The exposures are the shallowest. Pixel coordinates were transformed to and using the equatorial coordinates of 50 stars all around the field, taken from the Digitized Sky Survey.222 The DSS was produced at the Space Telescope Science Institute under U. S. Government grant NAG W-2166. The table with the photometry and positions of all stars in our sample will be made available through the BDA database (Mermilliod 1995, obswww.unige.ch/webda).
We have made a star to star comparison of our magnitudes to PJM94’s (in the and bands), and Fig. 4 shows graphically the results: we are brighter in by 0.063 mag, and fainter in by 0.119 mag. PJM94 do not give any details for their calibrations and the quality of the nights when they observed (theirs is a survey work intended to search for interesting objects for dedicated follow up observations, and was carried out also in marginally usable sky conditions). Given also our good calibration, we feel rather confident of our figures.


The CMDs resulting from our data are shown in Fig. 5(a) and (b), while panel (c) shows for comparison PJM94’s result (shallower, and based on a larger field, hence more contaminated by field stars). Pismis 2 appears to be an intermediate age cluster, heavily reddened but with both main-sequence, MS, and red clump (the locus of central helium burning stars) well populated and defined. The clump is characterized by a fairly large extension in magnitude (see also Section 5). Since the structure of both the turn-off and the red clump may be complicated by differential reddening and binarity (see below), the exact location in magnitude and colour of these features is not easy to define. For the clump, we place the position of the base, at its mean colour, at , = 2.22, and = 2.55. For the turn-off position we prefer to give a possible range: = 18.5 – 18.8, = 1.5 – 1.6, and = 1.8 – 1.9.
We have no direct information on the cluster membership from proper motions or radial velocities. Hence, to separate ”cluster” and ”field” objects in Pismis 2 we can only rely on the CMD appearance of an external control field, taken from PJM94 data, thanks to the BDA data base.
PJM94 observed the cluster with the CTIO 0.9m telescope, with a field of view of 14 arcmin2. In the lower panel of Fig. 6 we show the CMD of their central 1 arcmin, while in the upper panel only stars farther than 6 arcmin from the centre are displayed: it is immediately apparent that all the ”blue” stars brighter than V 18 are most likely field objects, while all the red stars brighter than V 18 are probable cluster members. To normalize PJM94’s external field to our field of view, we have retained of their 539 stars lying at distances larger than 6 arcmin only the fraction corresponding to the ratio of our/their area. This provides 283 objects with the same overall distribution in the CMD as the 539 stars shown the upper panel of Fig. 6.
There is a fairly large spread in the various sequences of the cluster CMDs of Fig. 5 (a) and (b). Two possible sources can be thought of: field star contamination and differential reddening.
The cluster MS and the field stars MS appear to lie approximately at the same colours in Fig. 5 (a) and (b), but a small displacement of the field star MS (e.g., due to the cluster being in front, hence slightly bluer and brighter, than the bulk of the field population) could be present, and explain the spread. However, the 283 field objects falling in our frame do not seem to be sufficient to account for the whole spread in the sequences. If we are witnessing the effect of field contamination, its importance should depend on the distance from the cluster centre, and we should see a displacement between the MS at the centre and far from it. Unfortunately, the study of the radial dependence of colour is not really significative when using our data, since the field of view is small and the cluster is not centred on it. PJM94 data are taken on a larger field, but the photometric dispersion in their CMD is so large that differences like those we are trying to see are completely washed out. Anyway, if we look at the CMDs for stars in the inner arcmin and in circular shells 1 to 2, and 2 to 3 arcmin from the cluster centre, the latter seem to present slightly bluer MS’s, giving some support to the hypothesis of field contamination as source of the spread.
An alternative explanation is the presence of differential reddening in our field of view, broadly speaking from the East to the West direction. To check this possibility we have plotted separately the CMDs of the four spatial quadrants with origin in the cluster centre. The map in the top panel of Fig. 7 shows the quadrant locations; the histograms in the two lower panels, with the number of stars as a function of the X and Y coordinates, indicate that the cluster centre is quite well determined (at the 10 pixel level, i.e. 8 arcsec in the present scale). The top left CMD of Fig. 8 refers to the stars in the North-East quadrant, the top right CMD to the NW quadrant, the bottom left CMD to the SE quadrant, and the bottom right CMD to the SW quadrant. The number of stars in each region is about 300 (the maximum difference is 10–15 per cent). By comparing with each other these four CMDs, one sees that the two East ones have very similar colour and mag distributions, while the two West ones are similar to each other but slightly redder than the East ones. Also the clump and MS turnoff luminosities appear slightly lower in the right than in the left panels. If one wants to ascribe this difference to a reddening difference, the extra necessary to bring both colours and luminosities into agreement is , i.e. less than 3 per cent of the reddening attributed to the cluster by PJM94. In this case, the spread in the total cluster CMD would be caused by the superpositions of two regions (the eastern and the western ones) affected by a different reddening. This possibility is supported by the circumstance that larger scale maps of the sky region definitely show a lower number of stars in the area on the West side of Pismis 2, as if an additional obscuring cloud was preventing the detection of faint objects (we inspected a 3030 arcmin2 region of the DSS, but the effect is also visible in our Fig. 1). If the obscuring cloud is closer than Pismis 2 and its outskirts cover also part of the cluster (its western half), then the affected stars appear redder and fainter than the unaffected ones.
The existence of this ”hole” in the map, combined with the fact that not only the MS but also the clump (where no field stars are expected) present colour and magnitude differences consistent with a differential reddening cause, makes us prefer this as the most likely explanation for the observed spread. Besides, the relative variation is so small (3 per cent of the reddening) that it looks almost natural to have it.


4 Cluster parameters
In order to derive the age, distance and reddening for Pismis 2, we have applied our usual method of comparison of the observed CMD to synthetic CMDs based on homogeneous sets of stellar evolution models. As described in Tosi et al. (1991) and in the previous papers of this series, the method consists in creating, via Monte Carlo extractions on the stellar tracks, synthetic CMDs which must contain the same number of stars as the observed diagram and must suffer of the same photometric errors and incompleteness factors as derived from the real data. We have adopted as reference CMD the diagram shown in Fig. 5 (b), which contains the 2204 objects measured and cross-identified in and . To take into account the background/foreground contamination estimated in the previous Section, the synthetic CMDs for Pismis 2 contain 1920 stars. Since the frames were not as deep as the and ones, the CMD [Fig. 5 (a)], is shallower and we have therefore used it only as further check of the synthetic models.
The extracted synthetic stars have luminosity and temperature given by the adopted set of stellar models, and are then placed into the observational colour–magnitude plane using the Bessel, Castelli & Pletz (1998) photometric conversion tables. They are attributed a photometric error derived from the magnitude distribution of (input–output) mags of the artificial star tests performed to derive the incompleteness factors of our photometry (Section 2.2). They are retained or rejected according to a completeness test based on the empirical incompleteness factors. The magnitudes and colours of the 1920 survived synthetic stars are modified according to the assumed reddening and distance modulus. Since our photometry is calibrated into the Johnson-Cousins system, we assume (Dean, Warren & Cousins 1978).
To test the intrinsic uncertainty related to the stellar models, we perform the CMD simulations adopting evolutionary sets from different groups. We have used the Padova (e.g. Bressan et al. 1993, hereinafter BBC), FRANEC (Dominguez et al. 1999, hereinafter FRA), and FST (Ventura, D’Antona & Mazzitelli 2001, in preparation) models of solar and sub-solar metallicities. Among the FST models we have adopted those with overshooting parameter =0.2. For Pismis 2, the results from the different sets are strikingly consistent with each other. We find that, independently of the adopted set, only the models with solar metallicity provide MS slopes in agreement with the data.
A common feature of all the synthetic diagrams is that, despite the fairly large size of the adopted photometric errors, their stellar distributions are always tighter that the empirical one. This effect is shown in Fig. 9, where the top panel shows the synthetic CMD corresponding to the BBC solar models with the best fitting parameters: age 1.1 Gyr, =12.7 and =1.29. Even assuming that a large fraction of the cluster members are binary stars (with random mass ratio), we cannot reproduce the observed spread. Given the discussion on the spread of the evolutionary sequences in Section 3, we decided to adopt two and not just one reddening. To get the required distribution (bottom panel of Fig. 9), we need to assume that 50 per cent of the stars are affected by a reddening =0.06 higher than that affecting the other 50 per cent. This implies a fractional variation of only 5 per cent, which is not implausible in a region so highly extincted.
Independently of the adopted set of stellar models, all the synthetic CMDs in better agreement with the reference diagram turned out to be those with solar metallicity and assuming =1.26 for 960 objects and =1.32 for the remaining 960 objects. They also assume that each of the two populations contains a 50 per cent of binary stars with equally distributed mass ratios.
These reddening values are lower than the =1.48 derived by PJM94. The difference can be totally ascribed to the different calibration, since our colours have turned out (Section 3) to be 0.18 mag bluer than theirs. Nonetheless, we have simulated several synthetic diagrams with sub-solar metallicity to check whether a lower metal content could simultaneously provide a fair agreement with our data and with PJM94’s reddening. We have found, instead, that at the synthetic MS slopes become inconsistently flatter than the observed one, while the required reddening is still lower than PJM94’s.333For instance, with BBC at the two necessary reddenings are , with FRA at , they are .
The CMDs of the cases in better agreement with the reference diagram for each set of solar metallicity models are shown in the top panels of Fig. 10, while the corresponding luminosity functions (LFs) are compared with the empirical one in the bottom panels. Since the reference CMD of Fig. 5 (b) includes also non-member stars, we have added to the synthetic stars the 283 objects contained in the normalized external field described in Section 3, for a better comparison between synthetic and empirical data. The external field, derived from PJM94, is shallower than ours, but still provides a good representation of the actual contamination. Also the cluster LF (dots) is derived from the whole reference CMD and we have therefore considered the 283 external stars also in the derivation of synthetic LFs (curves).
We obtain an age of 1.1 Gyr with the BBC models, and of 1.2 Gyr with the FST ones. The FRA models provide the best curvature of the MS, but don’t reproduce equally well the turn-off region, which makes it more difficult to distinguish the best age. Ages between 1.0 and 1.2 Gyr lead to comparable agreement with the data, thus we show in the figure the CMD corresponding to the mean age, 1.1 Gyr. We obtain a distance modulus of =12.7 with BBC and FRA, and =12.5 with FST. Considering also the coincident reddening values obtained with the three sets, we have a striking and fairly unusual agreement in the derived values of all the parameters.
The synthetic CMDs in better agreement with the data reproduce fairly well the observed features of both MS and evolved stars. Also the group of red stars brighter than the clump is naturally predicted, since the total number of observed cluster members if large enough to let also the faster core He - burning phases to be clearly represented in the CMDs. Pismis 2 falls in the age range where Girardi, Mermilliod & Carraro (2000) found necessary to invoke for some clusters an additional mechanism, like differential mass loss on the RGB, or rotation, to explain the clump configuration. However, our data do not require additional mechanisms to be reproduced by synthetic CMDs.
Finally, we have cross-checked our results by comparing the CMD of all the synthetic cases with the diagram of Fig. 5 (a). This diagram contains the 1230 objects for which and were measured and is much more incomplete than the reference CMD, because the frames are significantly shallower. Hence, the models evaluation in this case is restricted to the morphological distribution in the CMD, and cannot take into account the number of stars in the various evolutionary phases. We find that all the models in better agreement with the CMD are in agreement also with the distribution, but only if we make the fluxes 0.07 mag dimmer. This does not mean that we invoke different reddening or distance modulus, but that our mags are not completely consistent with the corresponding and mags for what concerns the stellar physical properties. We ascribe the =0.07 necessary to bring the data back to self-consistency to calibration difficulties in the band. As discussed in Section 2.1, to obtain a calibration as safe and accurate as possible, we have considered for the and bands not only the usual Landolt’s standards but also Stetson’s extension to fainter objects. This has allowed us to cover a wider range of the observed colours with the standards used for the calibration. This extension has not been possible for the band, where the available standards cover only half of the observed colour range. Hence, its calibration is inevitably more uncertain than that in the other two bands and is the most likely cause of the =0.07 offset. Fig. 11 shows the synthetic diagram corresponding to the same BBC case as the of the top left panel of Fig. 10, already corrected for =0.07.
5 Summary and conclusions

We have presented the first detailed study of Pismis 2, an intermediate age open cluster, located towards the external part of our Galaxy. Pismis 2 is seated in a highly reddened Galactic region, probably inside a dust layer, as discussed by Dutra & Bica (2000). These authors attribute an excessive reddening to the cluster, derived by extrapolating into the forbidden region the absorption maps by Schlegel et al. (1998) and place the layer at 3.8 kpc from the sun. We find smaller reddenings and shorter distance (about 3.3 kpc), but we agree on the overall conclusion of a heavily obscured zone. Besides, we suggest that the absorbing clouds are not evenly distributed on the sky area around the cluster, because we find some evidence for a =0.04–0.06 across the cluster field of view.
The high and possibly differential reddening affecting Pismis 2 prevents its CMD from clearly showing the exact shape and location of the MS turn-off or some of the typical features of other open clusters, like MS gaps, binary stars sequence, etc. Nonetheless, the parameters derived from the simulated CMDs and based on stellar models from various groups are in good agreement with each other, thus suggesting that, despite the fairly large spread of the observed CMD, the uncertainty on their values is not larger than for other clusters. In fact, even if we cannot distinguish morphological details, the synthetic CMDs are quite well constrained by the number and the mag-distribution of the stars in the clump, by the mag-difference between the clump and the MS top, by the MS slope. We thus derive an age of 1.1 – 1.2 Gyr (confirming PJM94 result) using three different sets of theoretical tracks. We do not find any compelling reason to prefer one set over the others, and with all of them the best fits are obtained assuming a 50 percent of binary systems. The true distance modulus is found to be 12.5 – 12.7. The metallicity is probably about solar, but more direct measurements via spectroscopy or narrow band photometry are necessary to confirm it.
The derived age is similar, although slightly older, than that (0.75–1.0 Gyr, depending on the adopted models, see Sandrelli et al. 1999) of NGC 2660, one of the clusters already examined by our group. Indeed, the CMDs of the two clusters have quite similar features. NGC 2660 has a much tighter distribution (see fig. 4 of Sandrelli et al.), thanks to the lower and single reddening 0.4, but the slope and the shape of the MS, as well as the morphology of the turn-off region, resemble very closely those of Pismis 2. Also the relative colour difference between the MS turnoff and the clump are the same in the two clusters, both in and in . What changes from one another is the number and the magnitude distribution of the clump stars: Pismis 2 has a much more populated clump and a slightly larger between the MS turnoff and the clump basis. is a well known age indicator (MAI, see PJM94) and the higher value confirms that Pismis 2 is slightly older than NGC 2660.
The clump of Pismis 2 spans two magnitudes, while the one of NGC 2660 is populated only in its fainter portion, but both can be reproduced by the natural range of masses present in a single isochrone. Since the faint edge of the clump is the evolutionary phase where core-He-burning stars stay longer, part of the difference could be simply due to the much larger number of stars resolved in Pismis 2 (2206) than in NGC 2660 (407). The LFs of the two clusters, when normalized to the respective number of resolved stars, are so similar to each other that they completely overlap at all magnitudes, except at the base of the clump and at the faintest bins. The former difference is the signature of the – age relation, and the latter of the different incompleteness levels of the two data sets.
At odds with what was found for many other open clusters (e.g., in NGC 6253, Bragaglia et al. 1997, and examples cited there), we do not observe any noticeable flattening of the lower main sequence luminosity function. In Fig. 10, lower panels, the filled symbols representing the empirical data seem to decrease at only because of the sharp change in the completeness of our measurements (see Table 1). Pismis 2 does not appear to have suffered much from selective evaporation of low mass stars.
ACKNOWLEDGEMENTS
We warmly thank P. Montegriffo, whose programs were used for the data analysis. The bulk of the simulation code was originally provided by L.Greggio. We thank F. D’Antona and P. Ventura for providing their unpublished stellar models. Finally, we wish to thank the referee, J.-C. Mermilliod, for useful comments that significantly improved the paper. This research has made use of the Simbad database, operated at CDS, Strasbourg, France. We also acknowledge the use of the valuable BDA database, maintained by J.-C. Mermilliod, Geneva. L.DF. thanks the Bologna Observatory for the financial support.
References
- [1] Bessel, M.S., Castelli, F., Plez, B. 1998, A&A, 337, 321
- [2] Bragaglia, A., et al. 2001, AJ, 121, 327
- [3] Bragaglia, A., Tessicini, G., Tosi, M., Marconi, G., Munari, U. 1997, MNRAS, 284, 477
- [4] Bragaglia, A., Tosi, M., Marconi, G., Carretta, E. 2000, F. Matteucci, F. Giovannelli, eds, The chemical evolution of the Milky Way: Stars versus clusters, Kluwer Academic Publishers (Dordrecht), 255, p. 281
- [5] Bressan, A., Fagotto, F., Bertelli, G., Chiosi, C. 1993, A&AS, 100, 647
- [6] Carretta, E., Bragaglia, A., Tosi, M., Marconi, G. 2000, R. Pallavicini, G. Micela, S. Sciortino, eds, Stellar clusters and associations: convection, rotation, and dynamos, ASP Conf.Ser. 198, p. 273
- [7] Dean, J.F., Warren, P.R., Cousins, A.W.J. 1978, MNRAS, 183, 569
- [8] Dominguez, I., Chieffi, A., Limongi, M., Straniero, O. 1999, ApJ, 525, 226
- [9] Dutra, C.M., Bica, E. 2000, A&A, 359, 347
- [10] Friel, E.D. 1995, ARAA, 33, 38
- [11] Girardi, L., Mermilliod, J.-C., Carraro, G. 2000, A&A, 354, 892
- [12] Janes, K.A., Phelps, R.L. 1994, AJ, 108, 1773
- [13] Landolt, A.U. 1992, AJ, 104, 340
- [14] Mayor, M. 1976, A&A, 48, 301
- [15] Mermilliod, J.C. 1995, D. Egret, M.A. Albrecht, eds, Information and On-Line Data in Astronomy, Kluwer Academic Press (Dordrecht), p. 127
- [16] Miller, N.A., Hing, L.N., Friel, E.D., Janes, K.A. 1995, AAS, 187, 10704
- [17] Panagia, N., Tosi, M. 1981, A&A, 96, 306
- [18] Patino, R.M., Friel, E.D. 1994, AAS, 185, 10306
- [19] Phelps, R.L., Janes, K.A., Montgomery, K.A. 1994, AJ, 107, 1079 (PJM94)
- [20] Pismis, P. 1959, BOTT, 2, 37
- [21] Sandrelli, S., Bragaglia, A., Tosi, M., Marconi, G. 1999, MNRAS, 309, 739
- [22] Schlegel, D.J., Finkbeiner, D.P., Davis, M. 1998, ApJ, 500, 525
- [23] Stetson, P.B. 1992, User’s Manual for DAOPHOT-II
- [24] Stetson, P.B. 2000, PASP, 112, 925
- [25] Tosi, M., Greggio, L., Marconi, G., Focardi, P. 1991, AJ, 102, 951
