Optical Gravitational Lensing Experiment. OGLE-1999-BUL-32: the Longest Ever Microlensing Event – Evidence for a Stellar Mass Black Hole?
Abstract
We describe the discovery of the longest microlensing event ever observed, OGLE-1999-BUL-32, also independently identified by the MACHO collaboration as MACHO-99-BLG-22. This unique event has an Einstein radius crossing time of 641 days. The high quality data obtained with difference image analysis shows a small but significant parallax signature. This parallax effect allows one to determine the Einstein radius projected onto the observer plane as AU. The transverse velocity projected onto the observer plane is about . We argue that the lens is likely to be have a mass of at least a few solar masses, i.e., it could be a stellar black hole. The black hole hypothesis can be tested using the astrometric microlensing signature with the soon-to-be installed Advanced Camera for Surveys on board the Hubble Space Telescope. Deep X-ray and radio images may also be useful for revealing the nature of the object.
keywords:
gravitational microlensing - galactic centre - black hole1 Introduction
Gravitational microlensing is rapidly becoming an important astrophysical tool (for a review, see Paczyński 1996). The unique strength of this technique is that it provides a mass-selected sample for a variety of astrophysical applications, such as studying the Galactic structure and mass functions in the local group. So far, over one thousand microlensing events, mostly toward the Galactic bulge, have been discovered (e.g. Alcock et al. 2000; Woźniak et al. 2001; Bond et al. 2001). Most ( per cent) microlensing events are well described by the standard shape (e.g. Paczyński 1986). Unfortunately, from these light curves, one can only derive a single physical constraint, namely the Einstein radius crossing time, which involves the lens mass, various distance measures and relative velocity (see §3). This degeneracy means that the lens properties cannot be uniquely inferred, thus making the interpretation of the microlensing results ambiguous.
The parallax microlensing events are one class of exotic microlensing events that allow this degeneracy to be partially removed. The parallax effect we discuss here arises when the event lasts long enough that the Earth’s motion can no longer be approximated as rectilinear during the event (Gould 1992; see also Refsdal 1966 for a related effect). Unlike the light curves for the standard events which are symmetric, these parallax events often exhibit asymmetries in their light curves due to the motion of the Earth around the Sun. These events allow one to derive the physical dimension of the Einstein radius projected onto the observer plane and hence the lens degeneracy can be partially lifted.
A number of parallax microlensing events have been reported in the literature (Alcock et al. 1995; Mao 1999; Soszyński et al. 2001; Bond et al. 2001; see also Bennett et al. 1997). Smith, Mao & Woźniak (2001) recently developed a method to systematically search for parallax signatures in the OGLE-II microlensing candidates found by Woźniak et al. (2001). We have uncovered several parallax candidates in this database. One of these, OGLE-1999-BUL-32, turns out to be the longest microlensing event ever observed. The purpose of this paper is to analyze this unique event in some detail. We argue that this event is likely to be caused by a stellar mass black hole; other black hole candidates from microlensing have been reported in conference abstracts (Bennett et al. 1999; Quinn et al. 1999). The outline of the paper is as follows. In §2 we briefly describe the observations, data reduction and our parallax search algorithm, in §3 we describe our model for this spectacular microlensing event, and in §4 we propose future observations that can further test our model, particularly with the Hubble Space Telescope (HST).
2 Observations, Data Reduction and Selection Procedure
All observations presented in this paper were carried out during the second phase of the OGLE experiment with the 1.3 m Warsaw telescope at the Las Campanas Observatory, Chile. The observatory is operated by the Carnegie Institution of Washington. The telescope was equipped with the ‘first generation’ camera with a SITe 3 20482048 pixel CCD detector working in the drift-scan mode. The pixel size was 24m, giving the scale of 0.417′′per pixel. Observations of the Galactic bulge fields were performed in the ‘medium’ speed reading mode with the gain 7.1 e- ADU-1 and readout noise about 6.3 e-. Details of the instrumentation setup can be found in Udalski, Kubiak & Szymański (1997). The majority of the OGLE-II frames were taken in the I-band, roughly 200-300 frames per field during observing seasons 1997–1999. Udalski et al. (2000) gives full details of the standard OGLE observing techniques, and the DoPhot photometry (Schechter, Mateo & Saha 1993) is available from the OGLE web site at http://www.astrouw.edu.pl/~ogle/ogle2/ews/ews.html.
Woźniak et al. (2001) searched for microlensing events in the three year OGLE-II bulge data analyzed using difference image analysis. The difference image analysis pipeline is designed and tuned for the OGLE bulge data (Woźniak 2001), and is based on the algorithm from Alard & Lupton (1998) and Alard (2000). The difference image analysis pipeline returned a catalog of over 200,000 candidate variable objects, from which 520 microlensing candidates were identified using a combination of an algorithmic search, visual inspections and a cross-correlation with the candidates identified by Udalski et al. (2000) from the DoPhot analysis. The details can be found in Woźniak et al. (2001) and will not be repeated here.
We then searched for parallax microlensing events using the method developed in Smith et al. (2001). Here we outline the prescription. In the first step, we fit each microlensing light curve with both the standard model and the parallax model (see §3 for the procedure applied to OGLE-1999-BUL-32). The events that show significant improvements with the incorporation of the parallax effect are then recorded and subjected to further studies. Among the recorded events, we then select those events for which the peak is at least 30 times higher than the noise level and the time interval during which the microlensing variability is at least above the noise level is longer than 100 days. These two filters properly account for the fact that (subtle) parallax signatures are most likely to be detectable in long-duration events and those with high signal-to-noise ratio. We found this prescription to be successful. Several good candidates and a number of marginal ones were identified. We refer the readers to Smith et al. (2001) for further details.
In this algorithmic search, one microlensing event in Woźniak et al.’s
catalog, sc33_3764, passed all our criteria. The microlensing variability
was in fact first identified
in real-time by the MACHO alert system as MACHO-99-BLG-22; it was also
detected by the OGLE early-warning-system as
OGLE-1999-BUL-32. The star, however, first escaped detection as a microlensing
candidate (or even as a ‘transient’,
see Woźniak et al. 2001) in the difference image analysis, because
the star never
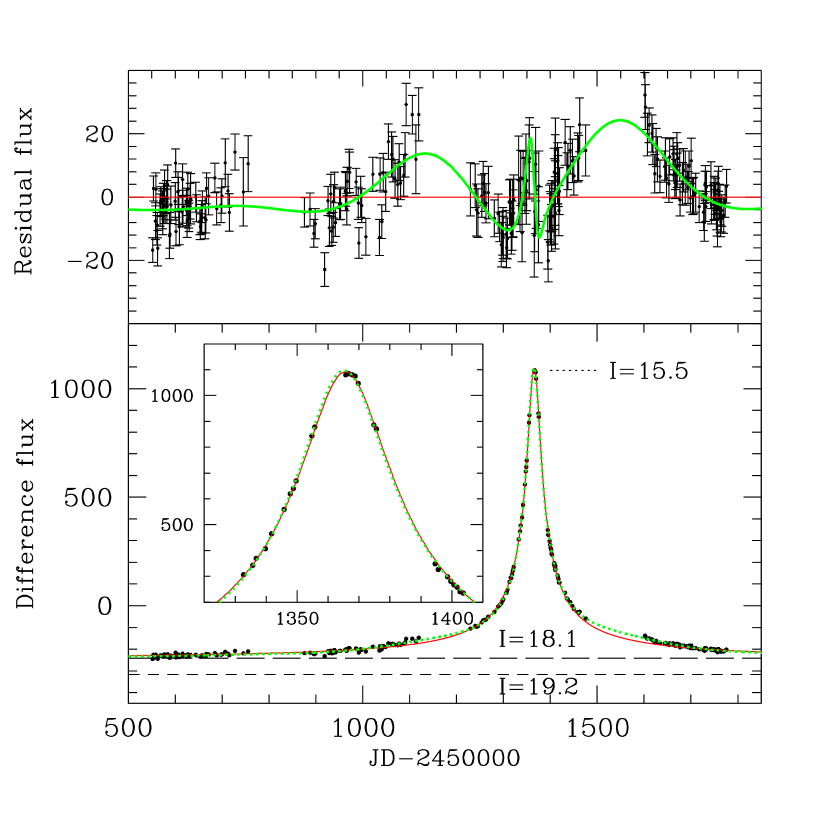
reached a ‘constant’ baseline (see Fig. 2). The event was
recovered by cross-correlating the variable stars with the microlensing
candidates found by Udalski et al. (2000).
Throughout this paper, we shall refer to this event as
OGLE-1999-BUL-32, following the notation of Udalski et al. (2000). The position
of the star is RA=18:05:05.35, and DEC=28:34:42.5 (J2000). The
Galactic coordinates are . The
DoPhot photometry and finding chart for the star are available online.
111http://www.astrouw.edu.pl/~ogle/ogle2/ews/1999/bul-32.html;
ftp://darkstar.astro.washington.edu/macho/Alert/99-BLG-22/
The total I-band magnitude of the
lensed star and the nearby blend(s) is about
(uncertain by about 0.05mag, Woźniak et al. 2001). The baseline
magnitude of the lensed star alone is about
(see §3).
There are several -band frames in the OGLE-II database when the composite
was fainter than magnitude. The average colour of the
composite is about 1.6.
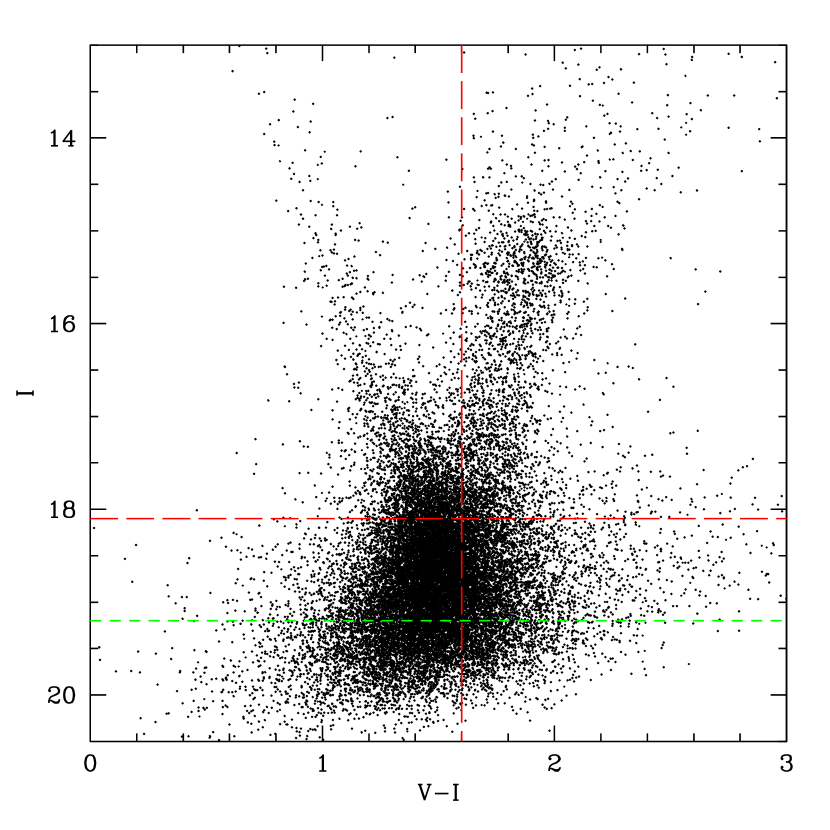
Fig. 1 shows the colour-magnitude diagram for the stars
within a field of view around OGLE-1999-BUL-32. From
this figure, it is clear that the magnitude
and colour of the total light is similar to most stars in this
direction. This is also true for the magnitude of the lensed star,
although its colour is unknown. Therefore OGLE-1999-BUL-32 is entirely consistent
with being approximately at the Galactic centre. In the same
diagram, the red clump stars around and are
clearly visible.
The (online) DoPhot photometry is quite noisy, because the lensed star is heavily blended with nearby star(s) (see §3), the fluctuations in the seeing make it difficult for DoPhot to disentangle the relative contributions. In fact, it is so noisy that the time-scale of this event is hard to determine with the DoPhot photometry. In contrast, the difference image analysis automatically subtracts out any blending. As a result, the errors are much reduced and the number of usable images is also increased. Both improvements are crucial for determining the long-duration nature of the event and, more importantly, for detecting the subtle parallax effect. Initially we analysed just the three season data from 1997 to 1999 available online (Woźniak et al. 2001). However, the parallax model predicts deviations from the standard model in the 2000 season and to test this we subsequently analysed the data from this season. Reassuringly, this confirmed the prediction of our parallax model. The four-season data from the difference image analysis is shown in Fig. 2222The data are available at http://www.jb.man.ac.uk/~smao/bul33.dat. In total, there are 246 data points in the light curve. In the next section, we present both the best standard and parallax model for this unique event.
3 Model
We first fit OGLE-1999-BUL-32 with the standard single microlens model. In this model, the (point) source, the lens and the observer are all assumed to move with constant spatial velocities. The standard light curve, is given by (e.g. Paczyński 1986):
| (1) |
where is the impact parameter (in units of the Einstein radius) and
| (2) |
with being the time of the closest approach (maximum magnification), the Einstein radius projected onto the observer plane, the lens transverse velocity relative to the observer-source line of sight, also projected onto the observer plane, and the Einstein radius crossing time. The Einstein radius projected onto the observer plane is given by
| (3) |
where is the lens mass, the distance to the source and is the ratio of the distance to the lens and the distance to the source. Eqs. (1-3) shows the well-known lens degeneracy, i.e., from a measured , one can not infer , and uniquely even if the source distance is known.
The flux difference obtained from difference image analysis can be written as
| (4) |
where is the baseline flux of the lensed star, and is the difference between the baseline flux () and the flux of the reference image (). includes the (unmagnified) flux of the lensed star and blended star(s), if present. Note that in general does not have to be zero or even positive as the reference image can be brighter than the true baseline image (). For OGLE-1999-BUL-32, the reference image flux is (Woźniak et al. 2001). Therefore, to fit the I-band data with the standard model, we need five parameters, namely, , (or ), , and . Best-fit parameters (and their errors) are found by minimizing the usual using the MINUIT program in the CERN library333http://wwwinfo.cern.ch/asd/cernlib/.
Our attempts to fit the light curve with the standard model reveal an ambiguity. This is due to the degeneracy between , and for a heavily blended light curve (Woźniak & Paczyński 1997). In such cases, only the combinations and are well determined, but not and individually. If the parameter is left unconstrained for this event, then a value close to zero is formally preferred, with for 241 degrees of freedom. However, such a perfect alignment is statistically unlikely. For illustrative purposes, in Fig. 2, we show the best fit with fixed to be 0.01, which has a slightly worse than the best fit with left unconstrained. The fit parameters are presented in Table 1. The top panel in Fig. 2 shows the difference between the data points and the standard model. Clearly the observed light curve shows systematic deviations from the model. Quantitatively, the per degree of freedom is about , which is unacceptably large. Since the microlensing variability can be clearly seen over at least four years, during which time the Earth has moved through four orbits, it is natural to ask whether the incorporation of the parallax effect will remove the inconsistency. We show next that this is indeed the case.
To account for the parallax effect, we follow the natural formalism of Gould (2000) and describe the lens trajectory in the ecliptic plane. This requires two further parameters, namely the projected Einstein radius onto the observer plane, and an angle in the ecliptic plane, which is defined as the angle between the heliocentric ecliptic -axis and the normal to the trajectory (This geometry is illustrated in Fig. 5 of Soszyński et al. 2001). Once these two parameters are specified, the resulting lens trajectory in the ecliptic plane completely determines the separation between the lens and the observer (i.e., the quantity which is analogous to the standard model’s parameter from eq. 1). This allows the light curve to be calculated; the complete prescription is given in Soszyński et al. (2001), to which we refer the reader for further technical details (see also Alcock et al. 1995; Dominik 1998). For the parameters , , , and , we take the fit parameters from the standard model as the initial guesses, while and are arbitrarily chosen for a number of combinations to search for any degeneracy in the parameter space. The best-fitting parameters are again found by minimizing the . Notice that in the parallax model, and describe the closest approach and the corresponding time of the lens trajectory with respect to the Sun in the ecliptic plane. They no longer have straightforward intuitive interpretations as analogous parameters in the standard model, due to geometric projections and the parallax effect. For example, the closest approach in the ecliptic plane is in general not the closest approach in the lens plane, and hence does not correspond to the peak of the light curve.
| Model | (day) | (AU) | /dof | |||||
|---|---|---|---|---|---|---|---|---|
| — | — | 550.62/241 | ||||||
| P | 257.0/239 |
The model parameters for the best-fitting parallax model are presented in Table 1. The best fit has a for 239 degrees of freedom. We found that the lens trajectory parameters ( and ) are not well-specified in the ecliptic plane, very likely due to the fact parallax signature is only modest for OGLE-1999-BUL-32. Fortunately, the most important lens parameters are well constrained, in particular, we have
| (5) |
The Einstein radius crossing-time is about 641 days, the largest ever reported for a microlensing event. The projected Einstein radius on the observer plane is also very large. As the flux in the reference image is (Woźniak et al. 2001), one sees that the total baseline flux is therefore (cf. eq. 4). The lensed star therefore only contributes per cent of the total baseline flux. Note the blending fraction is well constrained in the model. The baseline I-band magnitude of the lensed star is about . The lensed star was highly magnified, reaching a magnification of about at the peak.
The projected Einstein radius and the time-scale immediately allow us to derive a transverse velocity projected onto the observer plane
| (6) |
The lens mass can be expressed as a function of the relative lens-source distance (see Soszyński et al. 2001; Gould 2000),
| (7) |
As can be seen from this equation, the lens mass depends on the relative lens-source parallax, : If the source is about 7 kpc away, and the lens lies in the disc half-way between the observer and the source (), then mas, which gives a lens mass of about ; as a comparison, for a bulge self-lensing event with and , then mas, which would give a lens mass of about . However, this latter scenario may be less likely since the projected velocity of the lens is relatively low (see §4, Derue et al. 1999). In either case, the implied lens mass seems to be rather large, well beyond the measured mass for neutron stars ().
4 Discussion
We have systematically searched for parallax events in the 520 microlensing candidates identified using the difference image analysis (Woźniak et al. 2001). In this process, we have discovered an extremely long microlensing event with an Einstein radius crossing time , the longest time-scale ever reported. The event shows a small but significant parallax effect caused by the motion of the Earth around the Sun. This allows one to derive the projected Einstein radius on the observer plane of AU. We emphasize that while some parameters are not well-constrained, the limit on is quite robust, and it is important to understand why. is limited from below because the parallax effect is quite subtle: a smaller value would mean that the Earth motion makes a larger relative excursion, and hence the perturbation on the light curve may become too large to be compatible with observations. is limited from above because if it is too large, then the parallax model would become similar to the standard model, i.e., it will be inconsistent with the data. Somewhat paradoxically, had the parallax effect been smaller than observed, the projected Einstein radius on the observer plane would have to be even larger, implying an even larger lens mass.
In this paper, we have adopted the point source approximation, ignoring the finite size of the lensed star. It is important to see whether the assumption is justified particularly because the star was highly magnified. The finite source size effect becomes important when the closest approach is smaller than or comparable to the stellar radius (Gould 1994; Witt & Mao 1994; Nemiroff & Wickramasinghe 1994). In the source plane, the closest approach, , is given by
| (8) |
From the color-magnitude diagram (Fig. 1), the lensed star is likely to have a stellar radius no more than a few solar radii. So the closest approach is much larger than the stellar radius, justifying the point source approximation.
The derived and from the fitting allow us to express the lens mass with a dependence on the relative lens-source parallax (see eq. 7). If we assume the source is at , then the lens mass only depends the parameter, , the ratio of the distance to the lens and the distance to the source. The low projected velocity constrains the value of . If the lens and the Sun follow the pure galactic rotation, but the source is stationary at the Galactic centre, then . The derived transverse velocity then implies , which in turn gives a lens mass of . In principle, a maximum likelihood analysis on can be performed following Alcock et al. (1995) using the observed velocity information. However, such an analysis depends on the uncertain Galactic model (both on the mass density distribution and the kinematics of stars). We do not perform such a calculation here. We note, however, that our lensed star is roughly in the same direction as theirs and has nearly the same projected transverse velocity (), so we expect to obtain a similar probability distribution for ; their calculation indicates a value of x which is slightly smaller than the naïve estimate above, and this would imply a lens mass that is even larger. If a star with is still burning nuclear fuels, it will be much more luminous than . Hence, if the lens is indeed this massive, then it must be dark, and it follows that it is likely to be a stellar mass black hole.
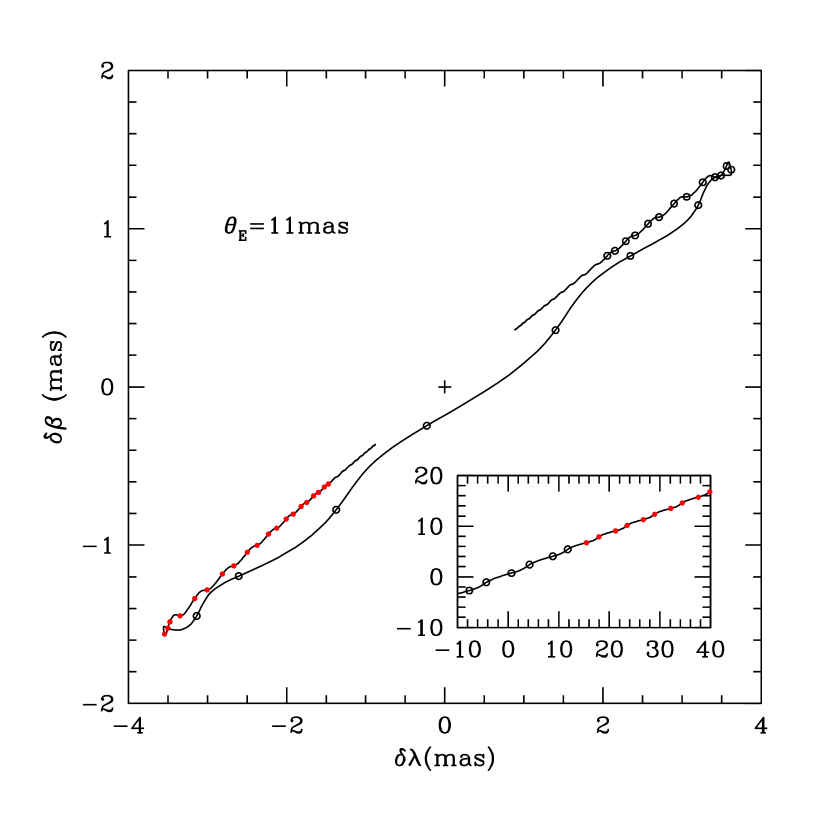
There may be a better and empirical method to test the black hole hypothesis. While the photometric microlensing event is now over, the astrometric microlensing signature is still ongoing, owing to the much slower decay of the astrometric signature as a function of the impact parameter (e.g. Gould 1992; Hosokawa et al. 1993; Hg, Novikov & Polnarev 1995; Miyamoto & Yoshi 1995; Walker 1995; Paczyński 1998). Ignoring the Earth’s motion, the astrometric signature follows an ellipse. The major axis and minor axis are both proportional to the angular Einstein radius, given by
| (9) |
The predicted astrometric motion is not very well specified due to the uncertainty in the trajectory. Fig. 3 illustrates the prediction for the best-fitting model with (). The origin of the astrometry is chosen to be the position of the star when the lens is at infinity. One sees that the astrometric motion is no longer an ellipse due to the parallax effect. The largest astrometric motion from the origin is for this case. The soon-to-be installed Advance Camera for Surveys 444http://www.stsci.edu/cgi-bin/acs on board HST will be an ideal instrument for detecting this signature. The point spread function is well sampled for this instrument, and it may be able to reach an astrometric accuracy as high as . HST has another distinctive advantage over the ground based interferometers as it can resolve the blends much more easily. Multi-colour data from HST will also be useful for studying the colour of the lensed star as currently only the I-band photometry is available. However, the astrometric motion is quite gradual and may be confused with the star’s proper motion, hence a multi-year monitoring project would have to be undertaken. Spectroscopic observations of the lensed source will be useful to put further constraints on the lensing kinematics involved. The lens may also be accreting interstellar gas, and could be luminous in the X-ray. It would be very interesting to obtain a deep image using sensitive X-ray satellites such as XMM-Newton and Chandra. It will also be interesting to see whether the source is luminous in the radio. Radio observations have distinct advantages, as it is not affected by dust, and VLBI observations could reach astrometry. The inset in Fig. 3 shows the position of the lens relative to the source centroid, which already reaches tens of for our example. Such a shift, if detected, will be a dramatic confirmation of our model.
Acknowledgement
We acknowledge Bohdan Paczyński for many stimulating discussions and comments on the manuscript. SM was supported by the NSF grant AST-9820314 as a visiting scientist to Princeton. MCS acknowledges the financial support of a PPARC studentship. PW was supported by the Laboratory Directed Research & Development funds (X1EM and XARF programs at LANL). This work was also supported by the polish grant KBN 2P03D01418.
References
- [1] Alard C., Lupton R. H., 1998, ApJ, 503, 325
- [2] Alard C., 2000, A&A Suppl., 144, 363
- [3] Alcock C., et al., 1995, ApJ, 454, L125
- [4] Alcock C., et al., 2000, ApJ, 541, 734
- [5] Bennett D. P., et al. 1997, BAAS, 191, 8303
- [6] Bennett D. P., et al. 1999, BAAS, 195, 3707
- [7] Bond I. A. et al. (the MOA collaboration) 2001, preprint (astro-ph/0102181)
- [8] Derue F. et al., 1999, A&A, 351, 87
- [9] Dominik M., 1998, A&A, 329, 361
- [10] Gould A., 1992, ApJ, 392, 442
- [11] Gould A., 1994, ApJ, 421, L71
- [12] Gould A., 2000, ApJ, 542, 785
- [13] Hosokawa M., Ohnishi K., Fukushima T. , Takeuti M. 1993, A&A, 278, L27
- [14] Hg E., Novikov I.D., Polnarev A.G. 1995, A&A, 294, 287
- [15] Mao S. 1999, A&A, 350, L19
- [16] Nemiroff R.J. Wickramasinghe W.A.D.T., 1994, ApJ, 424,L21
- [17] Miyamoto M. Yoshi Y., 1995, AJ, 110, 1427
- [18] Paczyński B., 1986, ApJ, 304, 1
- [19] Paczyński B., 1996, ARAA, 34, 419
- [20] Paczyński B., 1998, ApJ, 494, L23
- [21] Quinn J. L. et al. 1999, BAAS, 195, 3708
- [22] Refsdal S., 1966, MNRAS, 134, 315
- [23] Schechter P.L., Mateo M. Saha A., 1993, PASP, 105, 1342
- [24] Smith M. C., Mao S., Woźniak P. 2001, MNRAS, submitted
- [25] Soszyński I. et al. 2001, ApJ, 552, 731
- [26] Udalski A., Kubiak M. Szymański M., 1997, Acta Astron., 47, 319
- [27] Udalski A., Żebruń K., Szymański M., Kubiak M., Pietrzyński G., Soszyński I., Woźniak P., 2000, Acta Astron., 50, 1
- [28] Walker M. A. 1995, ApJ, 453, 37
- [29] Witt H.J., Mao S., 1994, ApJ, 430, 505
- [30] Woźniak P., Paczyński B. 1997, ApJ, 487, 55
- [31] Woźniak P., 2000, Acta Astron., 50, 421 (astro-ph/0012143)
- [32] Woźniak P. et al., 2001, Acta Astron., submitted (astro-ph/0106474)