Positional Coincidence between the High-latitude Steady Unidentified Gamma-ray Sources and Possibly Merging Clusters of Galaxies
Abstract
We report an evidence for the first time that merging clusters of galaxies are a promising candidate for the origin of high galactic-latitude, steady unidentified EGRET gamma-ray sources. Instead of using past optical catalogs of eye-selected clusters, we made a matched-filter survey of galaxy clusters over areas around seven steady unidentified EGRET sources at together with a 100 area near the South Galactic Pole as a control field. In total, 154 Abell-like cluster candidates and 18 close pairs/groups of these clusters, expected to be possibly merging clusters, were identified within estimated redshift . Five among the seven EGRET sources have one or two cluster pairs/groups (CPGs) within 1 from them. We assess the statistical significance of this result by several methods, and the confidence level of the real excess is maximally 99.8% and 97.8% in a conservative method. In contrast, we found no significant correlation with single clusters. In addition to the spatial correlation, we also found that the richness of CPGs associated with EGRET sources is considerably larger than those of CPGs in the control field. These results imply that a part of the steady unidentified EGRET sources at high-latitude are physically associated with close CPGs, not with single clusters. We also discuss possible interpretations of these results. We argue that, if these associations are real, they are difficult to explain by hadronic processes, but best explained by the inverse-Compton scattering by high energy electrons accelerated in shocks of cluster formation, as recently proposed.
1 Introduction
The Energetic Gamma Ray Experiment Telescope (EGRET) aboard the Compton Gamma Ray Observatory (CGRO) has left us the third EGRET (3EG) catalog (Hartman et al., 1999), the largest and deepest catalog of high-energy gamma-ray sources to date. However, more than 60% of the 3EG gamma-ray sources (170 out of 271) are yet to be identified, mainly because of the poor accuracy of the position determination. The distribution of the unidentified EGRET sources can be explained as the sum of the Galactic () component and another isotropic (likely extragalactic) component (Mukherjee et al., 1995; Özel & Thompson, 1996). While several candidates were proposed for the origin of Galactic sources including molecular clouds, supernova remnants, massive stars, and pulsars (e.g., see Gehrels & Michelson, 1999, and references therein), no astronomical object except for AGNs has been proposed as the origin of the isotropic component consisting of about 20 sources at ( 65 in the whole sky). All AGNs identified as EGRET sources belong to the blazar class, and there is no evidence that other types of AGNs are emitting gamma-rays detectable by EGRET.
Clusters of galaxies have been studied as a possible source of high energy gamma-rays, since high energy cosmic rays are expected to exist in intracluster medium (ICM), which could be emitted by member galaxies, or could be generated by AGNs or shocks in cosmological structure formation. Most previous studies concentrated on the hadronic processes, i.e., pion-decay gamma-rays produced by interaction between cosmic ray protons/hadrons with intracluster matter (Völk, Aharonian, & Breitschwerdt, 1996; Berezinski, Blasi, & Ptuskin, 1997; Colafrancesco & Blasi, 1998), and predictions are well below the detection sensitivity of the EGRET even for the case of the Coma cluster, for which only an upper limit has been set by the EGRET (Sreekumar et al., 1996). However, attention to high energy emission from nonthermal electrons is recently increasing. Existence of high energy electrons in intracluster medium has been suggested by diffuse nonthermal hard X-ray emission and diffuse radio emission for several clusters (see e.g., Sarazin, 2001, for a review). Loeb & Waxman (2000) pointed out that the extragalactic gamma-ray background in the GeV band may be explained by the inverse-Compton (IC) scattering of the cosmic microwave background (CMB) photons by electrons accelerated in large-scale shocks generated in structure formation, if about 5% of the shock kinetic energy is converted into nonthermal electrons. Totani & Kitayama (2000, hereafter TK) calculated the expected gamma-ray source counts by this process, and found that a few tens of sources are expected above the EGRET sensitivity from nearby dynamically forming clusters, and a part of unidentified EGRET sources may be accounted for (see also Waxman & Loeb, 2000). The preheating of the intergalactic medium, which is inferred from X-ray luminosity versus temperature relation of clusters and groups, may severely suppress the gamma-ray background flux, but still about 10 massive forming clusters could remain as gamma-ray sources detectable by the EGRET (Totani & Inoue, 2001).
TK estimated that “gamma-ray clusters” detectable by EGRET should have typical redshift of and mass of . However, no statistically significant correlation between the unidentified EGRET sources and known clusters has been found. There are several possible reasons for this result. First, only a small fraction of clusters should be emitting gamma-rays by the process considered by TK, since the cooling time of electrons emitting high-energy gamma-rays is very short (yr) and hence only clusters which are dynamically forming with active shocks can emit GeV gamma-rays. The no detection from the Coma cluster is thus explained. We may not observe gamma-rays even from clusters with merging signatures in X-ray or radio bands, which remains on a much longer time scales than the gamma-ray emission. It is also difficult to select the candidates of gamma-ray clusters from all unidentified EGRET sources, since the Galactic gamma-ray sources extend to relatively high galactic latitude of (Gehrels et al., 2000), and a part of sources at even higher latitude seem to be variable and hence they are likely to be AGNs. Even if the candidates are appropriately selected, the typical redshifts reached in the existing all-sky cluster catalogs in optical (Abell, Corwin, & Olowin, 1989) or X-ray (Ebeling et al., 1998) are not much greater than the expected redshift of gamma-ray clusters (), and hence a part of gamma-ray clusters detected by EGRET could have been missed by the past cluster surveys. These facts make it difficult to search the correlation efficiently. Furthermore, TK pointed out that, since gamma-rays can be emitted only from just dynamically forming clusters, their structure may be considerably different and extended when compared with stable, well-established clusters detected by X-rays or optical surveys. This effect might make the correlation search with known clusters even more inefficient.
However, most of such forming gamma-ray clusters should have some sub-structure or merging signature within them, as expected by the hierarchical structure formation in the CDM universe.111The terms “forming” and “merging” are difficult to clearly discriminate in the standard hierarchical structure formation, and hence we use them in essentially the same meaning. Therefore, an intensive search for these signatures in the regions around the unidentified EGRET sources with sensitivities better than existing all-sky catalogs of galaxy clusters is a straightforward test of the gamma-ray cluster hypothesis.
In this paper, we report the first results from our project to systematically examine the gamma-ray cluster hypothesis using optical galaxy data. Among the 19 unidentified EGRET sources at , we focus here on the 7 sources classified as “steady” (Gehrels et al., 2000, and D.Macomb 2000, private communication) since the remaining 12 variable sources should be other objects such as flaring AGNs. To perform a correlation analysis between the EGRET sources and galaxy clusters more efficiently than past studies, we make a new sample of galaxy clusters detected automatically based on the matched-filter cluster finding algorithm (Kawasaki et al., 1998). This catalog should be better for statistical study of correlation, than the past optical cluster catalogs selected by eyes that inevitably induce some systematic bias. We found a statistically significant correlation at maximally level between the 7 EGRET sources and close pairs of galaxy clusters, while no significant correlation was found with single clusters. We will argue that these results give an indirect support, though not conclusive, for the gamma-ray cluster hypothesis.
2 Data
We use the galaxy sample extracted from the APM catalog. The data around the seven EGRET sources were obtained via APMCAT service222http://www.ast.cam.ac.uk/{̃}apmcat/ while the data near the SGP were kindly distributed from S. Maddox and M. Irwin. Only blue passband ( or ) data have been used since the red passband data seemed much noisier for some EGRET source regions especially at the edge of photographic plates. Both and data were available and analyzed for 3EG J1235+0233. After correcting galaxy dimming due to Galactic absorption using the extinction maps and tools by Schlegel, Finkbeiner, & Davis (1998) 333http://astron.berkeley.edu/davis/dust/index.html, galaxies within magnitude range of were selected as the input data for cluster-finder. The seven areas centered at each EGRET source are searched. For comparison, a 100 area near the South Galactic Pole (hereafter SGP) is also used as a control field. Owing to the presence of holes and photographic plate edges in the data region, the total analyzed area is 182.93 .
3 Cluster Identification
To make an original cluster sample, we employed a revised version of the matched-filter method by Kawasaki et al. (1998), an automated and objective cluster-finding technique based on maximum-likelihood method. Here we briefly describe the essence of this revised matched-filter. A likelihood value that a cluster is centered at a given point on the sky is computed using galaxies in a circular region with radius centered at the point. The circular region is divided into five annular subregions and the galaxies in each subregion are then used to compare with the “filter”, a model of spatial and magnitude distribution of cluster galaxies. Since we assume the King model for the surface density profile and the Schechter function for galaxy luminosity function, the “filter” has several control parameters including cluster core radius , shape parameter of King model , Schechter parameters and , redshift , and richness defined as the number of cluster galaxies brighter than and within Abell radius (=1.5 Mpc). The relationship between and Abell richness (the number of cluster galaxies within 2 magnitudes from the third brightest galaxy), obtained with Monte Carlo simulation, is given as with uncertainty of 20%. All parameters but , , and are fixed as , , , and . For K-correction, the values for E/S0 galaxies by K.Shimasaku (2001, private communication) and Shanks et al. (1984) were used respectively for and passbands. Cosmological parameters are fixed as and . The number and magnitude distribution of the foreground/background galaxies are locally estimated using the galaxies in an annular region around the point with the inner and outer radii of and , respectively.
In the first step of the actual procedure, we fix () as (0.14, 50 kpc) and tune only to maximize likelihood at a point in order to simplify calculation. Maximized likelihood and corresponding are computed at lattice points with the interval of 0.01 to draw a “likelihood map” and a “richness map”. We use the latter to detect clusters because of simpler appearance of clusters in “richness map” (see Figure 2 of Kawasaki et al., 1998). After smoothing the raw “richness map” with Gaussian filter with , we detect cluster candidates appearing as local maxima with (i.e., Abell richness class ). Then and are surveyed in the range of and (in kpc), respectively, to estimate redshift and richness for each candidate. To avoid erroneous estimation, the above procedure is run for four cases of different galaxy sampling with . Basically we adopt the values () for the case unless they are far apart from the other values for the case . The uncertainty of is estimated to be with Monte Carlo simulation. Finally we obtain a volume-limited, “three-dimensional” sample of 154 cluster candidates with Abell richness class complete out to .
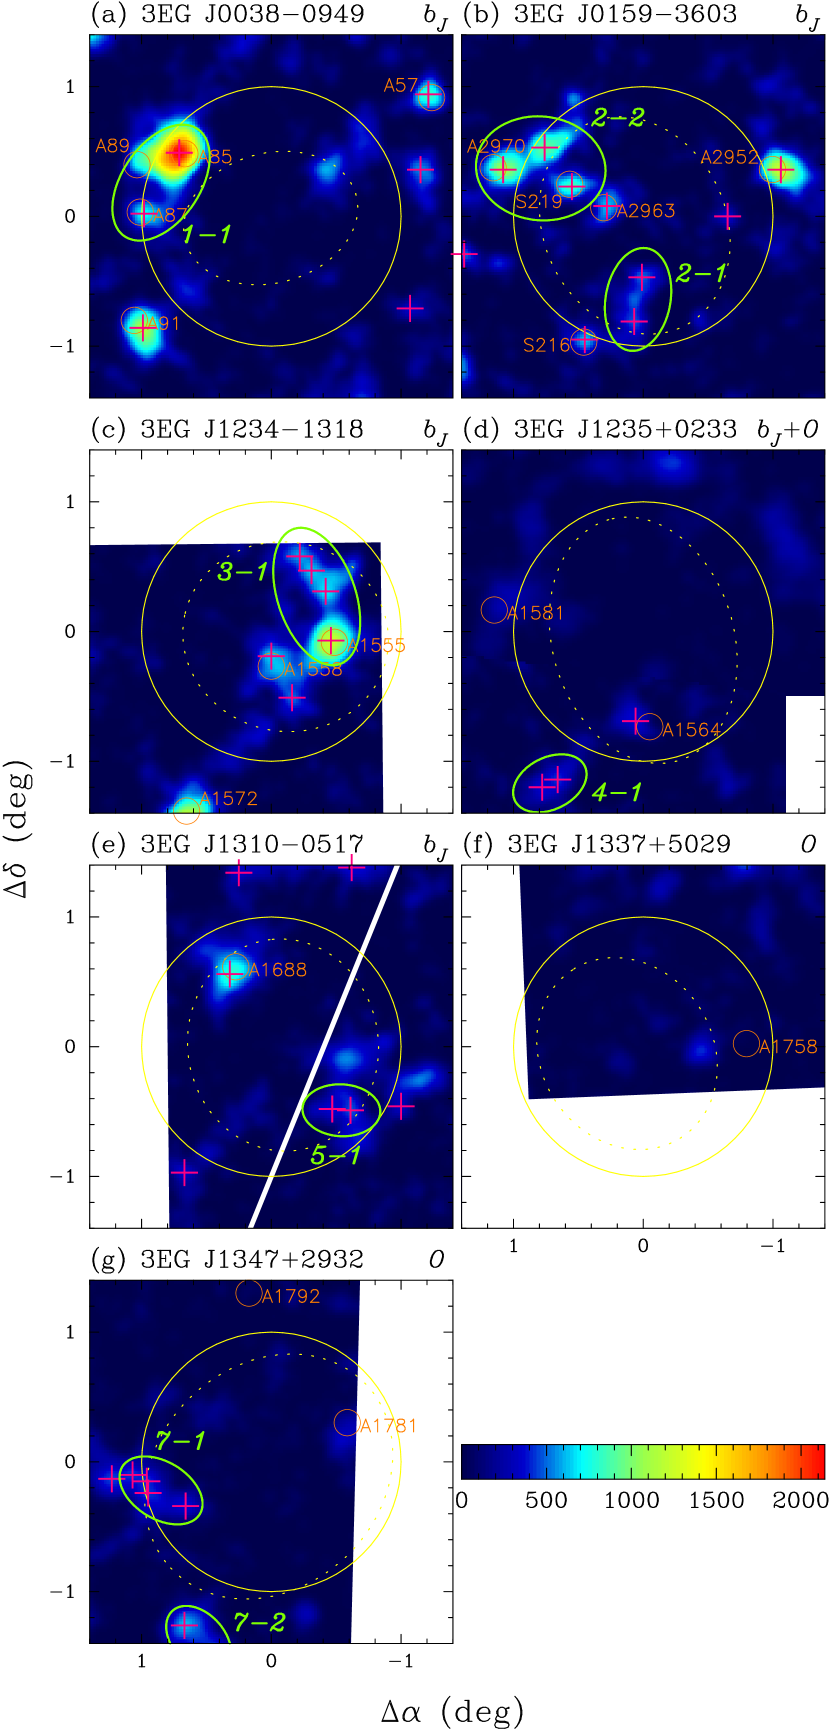
Figure 1 shows central areas of the “richness maps” around the seven EGRET sources. Cluster candidates are seen as local peaks of color contour. It should be noted that this color contour just indicates the amplitude of the “best-fit” filter with a fixed redshift parameter () and does not directly reflect cluster’s richness except for the ones at . Only the clusters with and Abell richness class 0 (i.e., ), which we utilize below, are marked with the pluses.
Using this cluster sample, we search for close cluster pairs or groups (hereafter CPGs) as candidates of merging clusters. If there are close clusters satisfying two criteria that (1) their estimated redshifts equal one another within the uncertainty of redshift estimation () and that (2) their transverse separation at that redshift is less than 2Mpc, we regard them as a CPG. In total, we identify 18 CPGs consisting of 2-4 clusters. Table 1 lists relative position (columns 3 and 4) and separation (column 5) from the nearest EGRET source, mean estimated redshift (column 6), total Abell richness (column 7), and number (column 8) of member clusters for the 9 CPGs found in the EGRET data areas. Some of the CPGs are shown as the green ellipses enclosing member clusters in Figure 1.
4 Results
Here we try several statistical tests for the correlation between clusters and the 7 EGRET sources.
4.1 Projected Number Density
We examine if there is an excess overdensity of clusters or CPGs in the vicinity of the EGRET sources (hereafter VES). VES is defined as the sum of all area within 1 from the seven EGRET sources, and the boundary is shown as the yellow solid circles in Figure 1. Considering the extended nature of CPGs, the VES radius is fixed at 1 rather than the EGRET error radius; the value is close to the typical size of both EGRET error circle and expected gamma-ray clusters detectable by EGRET (TK). The rest of the data area (the EGRET region outside VES plus the SGP region) is referred to as “control field” hereafter. Considering the lack of galaxy data due to the photographic plate edges, VES and the control field cover 20.07 and 162.86 , respectively.
Simply counting all clusters, VES and the control field contain 21 and 133 clusters, respectively. The number of clusters expected by chance in VES should obey the Poisson distribution with the expectation value inferred from the control field, 13320.07/162.86 = 16.4 if we ignore cluster-cluster correlation. We see that there is only a weak density excess of clusters at 1.1 level in VES.
However, situation changes greatly for CPGs. Five among the seven EGRET sources, namely, all except for 3EG J1235+0233 and 3EG J1337+5029 have CPGs within 1 from them. Four EGRET sources (3EG J0038-0949, 3EG J1234-1318, 3EG J1310-0517, and 3EG J1347+2932) have one CPG and the other one (3EG J0159-3603) has two CPGs within 1. Anyway, there are 6 and 12 CPGs in VES and the control field, respectively. Therefore, the number of CPGs expected by chance in the 20.07 VES field is 1220.07/162.86 = 1.5, thus the number excess of CPGs in VES amounts to level (namely, 99.6% CL assuming Poisson distribution), which is in sharp contrast to the case for single clusters. Even in a conservative case (increasing CPG number of the control field to , namely +1 level), the CPG number excess is at 3.0 level (or 98.7% CL). The weak correlation between single clusters and EGRET sources seems to appear under the influence of the strong correlation between CPGs and EGRET sources.
4.2 Mean Closest Separation
Next we assess the correlation between CPGs and the EGRET sources in a slightly different way by computing the mean closest separation between CPGs and the EGRET sources and examining if it is smaller than that for the case if CPGs are randomly distributed. Using six EGRET sources except for 3EG J1337+5029, for which no CPG is found in the data area, the mean closest separation is 0.84. We then perform a Monte Carlo simulation to compute mean closest separation for random distribution case. We have 60000 realizations of random placement of CPGs with density of 12/162.86 = 0.074 / and then measure the distances of the closest CPGs from a given point. Computing mean of every six closest separations, we obtain the distribution of 10000 values of mean closest separation for random case. The mean and the standard deviation of this distribution are 1.84 and 0.39, respectively. Using this distribution, the observed mean closest separation for the six EGRET sources is apparently smaller than that for random case with (1.84-0.84)/0.39 = 2.6 level or 99.8 % CL (for the conservative case in the previous subsection, 2.3 level or 99.5 % CL). These results change only very little if we assume that there is a CPG just outside the area around 3EG J1337+5029.
4.3 Bayesian Statistics Using Elliptical Fits
In addition to the rather simple-minded analyses in the previous two sections, we also performed more sophisticated correlation study based on the Bayesian statistics, with the same procedure that has been used in some past studies on EGRET source identifications (Mattox et al., 1997; Mattox, Hartman, & Reimer, 2001). We can calculate the likelihood ratio of identification, , for a CPG located at a separation angle of from the center of an EGRET source, where or are differential probabilities that a CPG is found at when the CPG is a correct identification of the EGRET source or a confusion noise, respectively. Here, the information of a mean CPG number density (12/162.86) and elliptical fits to the 95% C.L. contour of the likelihood of the EGRET source location (shown by yellow dotted lines in Fig. 1) are used to calculate (see Mattox et al., 1997, in detail). The distribution of the likelihood ratio can be used as an empirical indication of the strength of a potential identification. The values of are given for the 9 CPGs in Table 1.444The relative positions of CPGs in Table 1 are from EGRET locations given in the 3EG catalog, while the centers of elliptical fits given by Mattox, Hartman, & Reimer (2001) are slightly different. We corrected this offset here. To compare with this distribution, we performed a Monte Carlo simulation (MC) to produce 900 random location of 9 CPGs (i.e., 100 per each) around the six EGRET sources, assuming no correlation between the two. Since of the 9 CPGs is distributed in a range of –9.4, we compare the cumulative distribution of to the MC in the same range, as shown in Figure 2. Clearly the distribution of the 9 CPGs is deviated towards higher compared with that of the MC. The Kolmogorov-Smirnov test (KS) gives a chance probability of this deviation as 2.3%, i.e., the observed distribution is different from the MC with a confidence level of 97.7%.
Although this result also indicates the physical correlation between the CPGs and EGRET sources, the significance seems less than those estimated in the previous two sections. However, we should emphasize that the test in this section should be conservative because of the following reason. Due to the limited time to perform the matched-filter calculation, the search for CPGs is made only for regions surrounding EGRET error circles, and hence CPGs far from EGRET sources are excluded in the above sample of CPGs. Therefore we do not have any real CPG with , and we have to compare the observed distribution to the MC only in the limited range of . This means that the absolute number of CPGs with is not taken into account in the statistical significance. On the other hand, the result of §4.1 indicates that finding 9 CPGs with in the region around EGRET sources is higher than expected from random coincidence. Therefore the statistical significance only by the KS test in this section might be an underestimate. In addition, we took the separation to the center of CPGs, but it is uncertain where is the gamma-ray emitting region in the extended region of CPGs. Therefore the calculation of likelihood ratio might be too strict.
We can infer the a priori probability, , that each of the 9 CPG is a correct identification of EGRET sources, and the a posteriori probability, , that a CPG located at is the correct identification, as follows. Again following Mattox et al. (1997), we can calculate for each observed CPG when unknown is specified. Then, we solve a self-consistent such that the integral of divided by the number of CPGs considered (=9) yields the assumed value of . We found here, and assuming this value of is also given for every CPG in Table 1. According to this estimate, we can calculate a chance probability that all CPGs are misidentification, i.e.,
| (1) |
where the subscript runs over the 9 CPGs. We found this probability to be 2.2%; i.e., at least one GPG is the correct identification with 97.8% CL.
4.4 Estimated Redshift and Richness
The bottom panel of the Figure 1 of TK shows that the redshift and mass of gamma-ray clusters detectable by EGRET is 0.1 and , respectively. Both of them are roughly consistent with the estimated values of the CPGs in the vicinity of EGRET sources (see columns 6 and 7 of Table 1). Noting for richness, column 7 of Table 1 shows that the most CPGs have total Abell richness of 100 (Abell richness class 2-4). This means that they are quite massive systems with mass of .
We also found that the 6 CPGs within the VES of EGRET sources seem to have larger compared with those not associated with EGRET sources. The 6 CPGs have = 79, 109, 128, 165, 206, and 217, which should be compared with those of 12 CPGs in the control field: 62, 67, 90, 91, 92, 99, 102, 110, 111, 114, 119, and 154. If CPGs are not related to EGRET sources at all, the distribution of richness should be the same for the EGRET region and the control field. The KS test indicates that the chance probability of getting this result from the same distribution function is 8.0%. This is not very compelling only by itself, but it should be noted that this test is completely independent of the spatial correlation discussed in the previous three sections. If this result is added to the spatial correlation, significance would be further increased.
5 Discussion
5.1 Variability of EGRET Sources
In this work we selected 7 sources at that are showing no evidence of variability, according to Gehrels et al. (2000). However, the variability of EGRET sources cannot be determined clearly for many cases. In fact, there are two other studies on the variability by Tompkins (1999) and Torres et al. (2001), and the classification of EGRET sources into variable or non-variable sources is sometimes different among these authors. We also checked the variability indicators defined by Tompkins () and Torres et al. () for the seven EGRET sources here. According to the plausible criteria given by Torres et al. for these two indicators, they can be classified into either of “variable”, “dubious”, and “non-variable” sources. We found that all but one of them are classified as non-variable or dubious sources in both the two indicators; however, only one source, 3EG J1310-0517 is classified as a variable source by the indicator, while it belongs to non-variable sources by the indicator. The difference seems to come from the analysis of Tompkins et al. utilizing EGRET data that are not included in the 3EG catalog, while the classification by Gehrels et al. or Torres et al. is based only on the 3EG catalog (P.L.Nolan 2001, a private communication).
Considering this point, we also give statistical significance of correlation when 3EG J1310-0517 is removed from the sample. The number of CPGs expected by chance within the 6 VES of EGRET sources (18.15) is 1.33, and hence the observed 5 CPGs are excess of random coincidence (98.8% CL in Poisson distribution). The KS chance probability of the likelihood ratio distribution in the Bayesian analysis becomes 5.1%, and the chance probability that all CPGs are misidentification becomes 7.1%.
5.2 Theoretical Interpretation and Comments on the Other Work
After the submission of this paper, we learned a recent study of Colafrancesco (2002, hereafter C02) who investigated the correlation between unidentified EGRET sources and Abell clusters. Our analysis is based on the newly produced cluster catalog based the automated matched-filter method, which is more reliable and objective for statistical cluster study than the eye-selected Abell clusters. On the other hand, C02 also examined radio and X-ray fluxes of clusters associated with unidentified EGRET sources. C02 found interesting correlations between X-ray, radio and EGRET gamma-ray fluxes that further strengthen the possible connection between clusters and EGRET sources. All but one (3EG J1235+0233) EGRET sources considered here are also included in the list of candidates selected by C02. Therefore, at first glance, observational results seem consistent with ours. However, it should be noted that only about half of the CPGs presumably associated to the EGRET sources have Abell clusters as their members. We also found no statistically significant excess of number density for single clusters. The correlation claimed by C02 is between single clusters and a larger number of EGRET sources at including variable sources than considered here. Such a correlation could also be induced by point sources (e.g., AGNs) residing in galaxy clusters. On the other hand, our result that only CPGs show strong correlation with steady EGRET sources indicates that origin of gamma-ray emission is shocks by cluster/structure formation.
The theoretical interpretation of these results by C02 is very different from ours; in fact, he strongly argued that the forming/merging clusters proposed by TK are not responsible for the association suggested by this work and/or C02. Here we give a detailed interpretation of our results giving some comments on C02’s arguments against forming/merging clusters, and argue that the suggestion made by TK is the best explanation of the possible association between CPGs and EGRET sources.
To begin with, let us make clear what are the essentially new aspects of the proposal by TK: this work considered the IC scattering by electrons accelerated in shocks generated by the process of hierarchical cluster formation. This work is the first to predict gamma-ray source counts expected by such process based on the standard structure formation theory in the CDM universe, and TK found that maximally a few tens of forming clusters could be detectable by the EGRET. On the other hand, previous studies concerning gamma-rays from galaxy clusters mostly considered the hadronic processes such as pion decays by primary cosmic ray protons and emission from secondary electrons (Völk, Aharonian, & Breitschwerdt, 1996; Berezinski, Blasi, & Ptuskin, 1997; Colafrancesco & Blasi, 1998). Generally these papers found gamma-ray fluxes well under the EGRET sensitivity limit, even for a sample of the closest clusters to us including Coma (Colafrancesco & Blasi, 1998). The energy loss time scale of high energy protons in clusters is comparable to, or longer than the Hubble time, and hence the gamma-ray luminosity should also be steady on this time scale. Then, there is no reason to expect even stronger gamma-ray flux from clusters other than Coma. Therefore gamma-rays produced by cosmic ray protons in galaxy clusters have not been seriously considered as a candidate of unidentified EGRET sources.
However, high energy electrons that can emit gamma-rays have much shorter cooling time scale (yr) than that of protons or ions. Therefore, if a comparable energy is going into cosmic-ray electrons and protons, then we expect much stronger gamma-ray luminosity of the electron origin when the shock is still active after formation or merging processes, since their energy is emitted within a duration of shock life time, i.e., dynamical time ( Gyr). (Note that we should not use here.) Furthermore, we expect gamma-rays only from clusters still having active shocks, and do not from well stabilized clusters without shocks. The gamma-ray flux is expected to vary strongly in the history of hierarchical formation of a cluster. Therefore, it is possible that Coma and other nearby clusters do not have strong gamma-ray emission, while other more distant, or less stabilized clusters emit gamma-rays detectable by EGRET. What TK found is that it is in fact quantitatively possible, based on the abundance of forming objects in the CDM universe.
C02 first criticized an inconsistency that TK claimed forming clusters with undetectable X-ray flux or galaxy clustering due to more extended profile than normal clusters, while this work claims the correlation between EGRET sources and cluster pairs as the support of the TK’s idea. It should be noted, however, that only 3 of the 8 CPGs shown in Fig. 1 are coincident with Abell clusters. This suggests that a significant part of CPGs found by our paper are very extended and only found as clustering of galaxy clusters, each of which is small and not in the Abell catalog. (However, as shown in §4.4, the total mass of these CPGs is as large as .) This is in fact consistent with the picture of TK. On the other hand, coincidence with known Abell clusters for some of CPGs and EGRET sources is also not surprising, since, in the hierarchical strucuture formation theory, forming or merging clusters sometimes should include rich clusters that can be detected by past surveys. One important point is that, even in such cases, TK predicts that gamma-ray emission should not be from the center of rich clusters. Rather, gamma-ray emission is expected from more extended region of CPGs including the rich clusters.
We note that Reimer (1999) set an upper limit on the gamma-ray flux from A85 as (100MeV), instead of accounting for the nearby unidentified source, 3EG J0038-0949 (On the other hand, this association is classified as the most probable association in C02). If gamma-ray flux is coming from hadronic processes, then we expect that the flux should be the strongest at the center of A85, where cosmic-rays are well confined and ICM density is the highest. Therefore the hadronic processes cannot explain the association of A85 and 3EG J0038-0949. On the other hand, as discussed by TK, the IC gamma-ray emission from forming or merging clusters should be more extended because of more extended ICM and uniform density of the CMB. Formation shocks are expected in the surrounding region of the CPG including A85, which seems marginally overlapping with the 95% ellipse of 3EG J0038-0949. Therefore, if A85 and 3EG J0038-0949 are physically associated, the IC gamma-rays should be a better explanation than hadronic processes.
Second, C02 claimed apparent discrepancy between the numbers of clusters in TK and this work: 20–50 predicted by TK and 7 found in this work. Here C02 did not take into account the sky coverage; 20–50 of TK is for all sky but 7 in this work is for . The correction factor makes these numbers consistent. We also note that 20–50 sources predicted by TK might be a rather optimistic value, since electron power index is assumed to be (). Somewhat softer spectrum is expected in reality (see Totani & Inoue, 2001), reducing detectable sources by EGRET. However, it should be noted again that even such reduced number of detectable sources is still much larger than that expected by the hadronic processes considered before TK.
Third, C02 claimed the difficulties of energetics in the theory of TK; the gamma-ray luminosity inferred from EGRET sources is much larger than that possible in the TK’s framework. We again emphasize that TK assumes that 5% energy injection from shock kinetic energy to nonthermal electrons. The kinetic energy is calculated based on the standard structure formation theory. It is a general thought that supernova remnants inject about 10% of explosion energy into cosmic ray protons, although it may seem relatively large for electrons when one considers the energetics ratio of –0.1 of cosmic ray electrons to protons observed at the Earth. However, radio observations of supernova remnants indicate that shocks convert at least a few percent of the shock energy into the acceleration of relativistic electrons (Blandford & Eichler, 1987; Sarazin, 2001). The EUV and hard X-ray emission from several clusters can be attributed to nonthermal electrons having the total energy of the same order (Fusco-Femiano et al., 1999; Sarazin, 2001). Therefore, the energetics assumed by TK is not extreme at all. C02 ignored this fundamental point, and showed discrepancies in some quantities assuming cluster mass of . It is not clear why C02 chose this very small mass instead of the standard value of . Since in eq. (7) of C02, this choice reduces the gamma-ray flux by a factor of 100. On the other hand, TK’s calculation shows that the typical mass of clusters that are detectable by EGRET is in fact . The richness estimate of CPGs in this paper also indicates similar masses (see §4.4). Therefore, it is not surprising that C02 found some discrepancy, but it does not give any argument against TK. C02 also claimed that TK’s scenario results in extraordinary temperature of intracluster matter, 27–270keV, but it again seems to originate from nonstandard choice of C02 for cluster parameters [keV for that is not supported by the - relation of observed clusters (e.g., Finoguenov, Reiprich, & Böhringer, 2001), and small density of rather than a typically used value of ]. TK predicts that temperature of clusters detectable by EGRET should not be much different from that of normal clusters. Rather, the temperature could be sometimes lower if the shock kinetic energy has not yet been dissipated well in most of the intracluster medium.
Forth, C02 claimed that there is no evidence for strong ongoing shocks in the sample presented in this work, while the model of TK predicts strong nonthermal emission in hard X-ray and extreme ultraviolet (EUV) bands by the IC scattering, and in the radio band by the synchrotron emission, by the same electron population producing gamma-rays. TK model indeed predicts hard X-ray and EUV emission at a similar flux (in ) to that in gamma-ray band in most cases555This may not be the case in the very early stage of merging; see the next paragraph.. However, as repeatedly mentioned by C02, there is almost no observational information in these bands for the sample of EGRET sources considered in this paper. No evidence by no observation is trivial, and it argues against neither of TK nor this paper. Instead, intensive follow-up observations for the sample presented here in hard X-ray and EUV bands would give an important test of the TK’s scenario. The synchrotron radio flux depends sensitively on the strength of magnetic field; the flux should scale as , where and are the energy density of magnetic field and CMB, respectively. When the cluster magnetic field is at a level of G (), we expect similar strong flux in radio bands. However, observed hard X-ray flux and radio flux from the Coma cluster indicates G for this cluster (Fusco-Femiano et al., 1999; Sarazin, 2001), and then the radio flux should be 0.25% of gamma-ray flux. Considering also that there is no deep radio observations for the sample in this paper, no evidence for strong radio emission does not necessarily contradict with TK’s suggestion.
C02 noted that A85 in the vicinity of 3EG J0038-0949 is associated with cold front that is a possible signature of early stage of merging. C02 claimed that this is not an ongoing violent merging processes, and hence this argues against TK. However this is not the case. A85 has a radio halo found on the border between substructures, where the cluster gas is first being shocked (Sarazin, 2001). Once the merging starts and shocks are generated, the IC gamma-ray flux should rapidly increase with a minimum time scale of cooling and acceleration of high energy electrons (yr, TK). After this situation is achieved, gamma-ray flux is expected to be rather steady during the shock is propagating. On the other hand, nonthermal radiation in other wavebands (X, EUV, and radio) will achieve this steady state at a time scale of energy dissipation of responsible particles. Since this time scale is longer than that for gamma-ray band, the initial rise of luminosity could be slower than in gamma-rays. Therefore, strong gamma-ray flux is theoretically expected even when observations in other wavebands show evidences only for early merging stage.
C02 concluded that “the energy release at gamma-ray energies MeV of the EGRET-cluster associations is probably due to a superposition of diffuse (associated with the active ICM of the cluster) and concentrated (associated with the active galaxies living within the cluster) gamma-ray emission”. We do not disagree with this statement; our claim is that the physical process responsible for “the active ICM of the cluster” should be IC scattering by primary cosmic-ray electrons produced by structure formation, which is the central point of TK’s proposal. On the other hand, other processes within the standard physics, such as hadronic processes, are unlikely to explain gamma-ray flux detectable by EGRET from active ICM, as mentioned above. In fact, based on the hadronic processes, Colafrancesco & Blasi (1998) predicted gamma-ray flux much smaller than the EGRET sensitivity limits for nearby clusters at 0.01–0.07. The majority of Abell clusters that are claimed to be associated with EGRET sources by C02 have even larger distances of 0.1 (see Table 1 of C02). Since the gamma-ray flux by hadronic processes is not expected to vary significantly from cluster to cluster because of the long dissipation time scale, it seems difficult to explain the gamma-ray flux from ICM by the Colafrancesco & Blasi model.
6 Conclusions
We performed a correlation analysis between the 7 steady unidentified EGRET sources in the high-latitude sky () and a quasi-three-dimensional catalog of galaxy clusters newly generated with a matched-filter algorithm. While there is no correlation between the EGRET sources and the individual clusters, in sharp contrast, we found a strong (maximally 99.8%CL level) correlation between the EGRET sources and close pairs/groups (CPGs). This result is consistent with the gamma-ray cluster hypothesis proposed by Totani & Kitayama (2000), which expect that the gamma-ray emission comes only from ongoing mergers with active shocks, but not from usual ones in dynamically “quiet” regime where the violent shock has subsided. Because of the short time scale of energy dissipation, gamma-ray luminosity should more rapidly rise with the generation of the shock, and decay with the disappearance of the shock, compared with the thermal or nonthermal emission in longer wavelength. This suggests that some clusters may have strong gamma-ray emission with still weak or only early signatures of merging in other bands, and others may have weak gamma-ray flux but with still remaining merging signature in longer wavelength. Confirmation of merging signatures in CPGs found in this paper is important for further verification, but deep observation is necessary when the merging is still in the early stage.
Clearly, the weak point of our analysis is the small sample (seven) of the steady unidentified gamma-ray sources due to the flux limit of 3EG catalog (though it is deepest to date). However, TK predicted that future gamma-ray telescope such as GLAST could find hundreds to thousands of gamma-ray clusters up to 0.2-0.3. The coming three-dimensional deep galaxy catalogs from ongoing SDSS and 2dF survey projects will be ideal resources to directly compare with the GLAST gamma-ray sources. When it is established that a part of the extragalactic steady gamma-ray sources are from forming (merging) clusters, large-scale distribution of gamma-ray clusters will offer unique and valuable information about the dynamical side of cosmological structure formation, in contrast to the more stationary side that has been probed by conventional galaxy clusters in X-ray and optical bands.
References
- Abell, Corwin, & Olowin (1989) Abell, G.O., Corwin, H.G., & Olowin, R.P., 1989, ApJS, 70, 1
- Berezinski, Blasi, & Ptuskin (1997) Berezinski, V.S., Blasi, P., & Ptuskin, V.S. 1997, ApJ, 487, 529
- Blandford & Eichler (1987) Blandford, R.D. & Eichler, D. 1987, Phys. Rep., 154, 1
- Colafrancesco & Blasi (1998) Colafrancesco, S. & Blasi, P. 1998, Astropart. Phys., 9, 227
- Colafrancesco (2002) Colafrancesco, S. 2002, A&A, in press. (astro-ph/0203443) (C02)
- Ebeling et al. (1998) Ebeling, H. et al. 1998, MNRAS, 301, 881
- Finoguenov, Reiprich, & Böhringer (2001) Finoguenov, A., Reiprich, T.H., & Böhringer, H. 2001, A&A, 368, 749
- Fusco-Femiano et al. (1999) Fusco-Femiano, R. et al. 1999, ApJ, 513, L21
- Gehrels & Michelson (1999) Gehrels, N. and Michelson, P. 1999, Astropart. Phys., 11, 277
- Gehrels et al. (2000) Gehrels, N., Macomb, D.J., Bertsch, D.L., Thompson, D.J., & Hartman, R.C. 2000, Nature, 404, 363
- Hartman et al. (1999) Hartman, R.C., et al. 1999, ApJS, 123, 79
- Kawasaki et al. (1998) Kawasaki, W., Shimasaku, K., Doi, M., & Okamura, S. 1998, A&AS, 130, 567
- Loeb & Waxman (2000) Loeb, A. & Waxman, E. 2000, Nature, 405, 156
- Mattox et al. (1997) Mattox, J.R., Schachter, J., Molnar, L., Hartman, R.C., & Patnaik, A.R. 1997, ApJ, 481, 95
- Mattox, Hartman, & Reimer (2001) Mattox, J.R., Hartman, R.C., & Reimer, O. 2001, ApJS, 135, 155
- Mukherjee et al. (1995) Mukherjee, R., Bertsch, D.L., Dingus, B.L., Kanbach, G., Kniffen, D.A., Sreekumar, P., & Thompson, D.J. 1995, ApJ, 441, L61
- Özel & Thompson (1996) Özel, M.E. & Thompson, D.J. 1996, ApJ, 463, 105
- Reimer (1999) Reimer, O., 1999, in Proc. 26th International Cosmic Ray Conference, edited by D.Kieda, M.Salamon, B.Dingus, Salt Lake City, Vol. 4, p.89
- Sarazin (2001) Sarazin, C.L. 2001, To appear in Proceedings of XXI Moriond Conference: Galaxy Clusters and the High Redshift Universe Observed in X-rays, edited by D. Neumann, F. Durret, & J. Tran Thanh Van (astro-ph/0105458)
- Schlegel, Finkbeiner, & Davis (1998) Schlegel, D.J., Finkbeiner, D.P., & Davis, M. 1998, ApJ, 500, 525
- Shanks et al. (1984) Shanks, T., Stevenson, P.R.F., Fong, T., & MacGillivray, H.T. 1984, MNRAS, 206, 767
- Sreekumar et al. (1996) Sreekumar, P. et al. 1996, ApJ, 464, 628
- Tompkins (1999) Tompkins, W. 1999, Ph.D. Thesis, Stanford University
- Torres et al. (2001) Torres, D.F., Pessah, M.E., & Romero, G.E. 2001, Astronomische Nachrichten, 322, 223
- Totani & Inoue (2001) Totani, T. & Inoue, S. 2001, Astroparticle Phys., in press. (astro-ph/0104072)
- Totani & Kitayama (2000) Totani, T. & Kitayama, T. 2000, ApJ, 545, 572 (TK)
- Völk, Aharonian, & Breitschwerdt (1996) Völk, H.J., Aharonian, F.A., & Breitschwerdt, D. 1996, Sp. Sci. Rev. 75, 279
- Waxman & Loeb (2000) Waxman, E. & Loeb, A. 2000, ApJ, 545, L11
| ID | EGRET Source | Separation (°) | Note | |||||||
|---|---|---|---|---|---|---|---|---|---|---|
| 1-1 | 3EG J00380949 | 0.85 | 0.26 | 0.88 | 0.055 | 128 | 2 | 6.6E-2 | 2.2E-2 | |
| 2-1 | 3EG J01593603 | 0.04 | -0.64 | 0.64 | 0.141 | 109 | 2 | 4.7 | 0.64 | |
| 2-2 | 3EG J01593603 | 0.79 | 0.37 | 0.88 | 0.116 | 206 | 3 | 6.1E-1 | 0.19 | |
| 2-3 | 3EG J01593603 | -1.71 | -0.20 | 1.72 | 0.104 | 111 | 2 | 1.43E-6 | 5.5E-7 | outside VES |
| 3-1 | 3EG J12341318 | -0.35 | 0.32 | 0.48 | 0.101 | 217 | 4 | 9.4 | 0.78 | |
| 4-1 | 3EG J12350233 | 0.72 | -1.17 | 1.37 | 0.071 | 67 | 2 | 5.7E-3 | 2.2E-3 | outside VES |
| 5-1 | 3EG J13100517 | -0.54 | -0.49 | 0.73 | 0.092 | 79 | 2 | 2.4 | 0.48 | |
| 7-1 | 3EG J13472932 | 0.91 | -0.21 | 0.93 | 0.044 | 165 | 4 | 1.2 | 0.32 | |
| 7-2 | 3EG J13472932 | 0.56 | -1.37 | 1.48 | 0.054 | 62 | 2 | 7.5E-2 | 2.7E-2 | outside VES |
Note. — Col.(1): IDs corresponding to those in Fig. 1. Col.(3)–(5): Relative celestial coordinate and separation from the central position of the 3EG catalog. Col.(6): Mean of estimated redshift for CPGs. Col.(7): Total Abell richness. Col.(8): Number of cluster members included in a CPG. Col.(9): Likelihood ratio of identification as an EGRET source. Col. (10): The a posteriori probability of identification.