Spectral Structure in FRII Radio Galaxies and Jets
Abstract
Using spectral tomography to separate overlapping spectral features in a sample of FRII radio galaxies, we find a variety of spatial/spectral features that are not easily described in the context of current models. In particular, we find mixtures of flat and steep spectrum features in the hot spot regions, and non-monotonic spectral index gradients along jets. Additional findings include spectral gradients in compact hot spots and possible transitions in jet properties at the downstream ends of the diffuse lobes. The complexity of behaviors uncovered here points to the need for a thorough investigation of numerical models for radio galaxies, as well as detailed observational studies of larger, unbiased samples. We also perform the first quantitative assessment of errors in the use of spectral tomography for spectral index measurements.
keywords:
GALAXIES: INDIVIDUAL ALPHANUMERIC: 3C401, GALAXIES: INDIVIDUAL ALPHANUMERIC: 3C438, GALAXIES: JETS, GALAXIES: STRUCTURES, RADIO CONTINUUM:GALAXIES, RADIATION MECHANISMS: NONTHERMAL1 Introduction
Radio source spectral indices are used to probe the gain and loss mechanisms of the relativistic electron population in extragalactic radio sources. Steeper spectra may indicate that the electrons in the source have “aged” through synchrotron and other losses. Flatter spectra can be caused by in situ particle acceleration or compression of the medium. (Leahy, 1991 and Eilek & Hughes, 1991). The spectral index variations in a source are therefore fundamental for testing models for the evolution of the relativistic particle populations in radio galaxies. The relative importance of acceleration at the jet terminus, or along the jet itself, or in the more diffuse lobes is indeterminate at present. Challenges to the standard picture from recent numerical simulations (e.g., Tregillis, Jones & Ryu, 2001) and from non-thermal emission in optical and X-ray bands (e.g., Celotti, Ghisellini & Chiaberge, 2001, Wilson, Young & Shopbell 2001) raise questions about the origins of spectral variations in the much lower energy radio spectra.
Unfortunately, the observation and interpretation of spectral variations in radio galaxies is often ambiguous (e.g., Rudnick, 2001a). One problem is that the observed spectral index of a feature in a radio source is misleading when two structures with different spectral indices overlap in the plane of the sky. For example, flatter spectrum jets often overlap steeper spectrum lobes. Spectral tomography is one way around this problem where a feature with a specified spectral index can be subtracted out of the image leaving only the second structure.
Spectral tomography has been used to analyze the spectra of several Wide Angle Tail sources (Katz-Stone & Rudnick, 1997b and Rudnick & Katz-Stone, 1995) and Compact Steep Spectrum sources (Katz-Stone & Rudnick, 1997a). Tomography of one FRII, Cygnus A, isolated features similar to those seen in the “frequency-corrected” images of this prototypical source (Rudnick, Katz-Stone & Anderson, 1994). In each case, features that were unexpected from current radio galaxy models were found. We therefore initiated this exploratory study of additional FRII radio galaxies using existing maps. Below we examine the results from our spectral tomography on these distant, FRII sources and estimate the spectral index of several jets along their lengths. We then briefly describe some implications of these results for radio galaxy models, and make suggestions for future work.
2 Observations
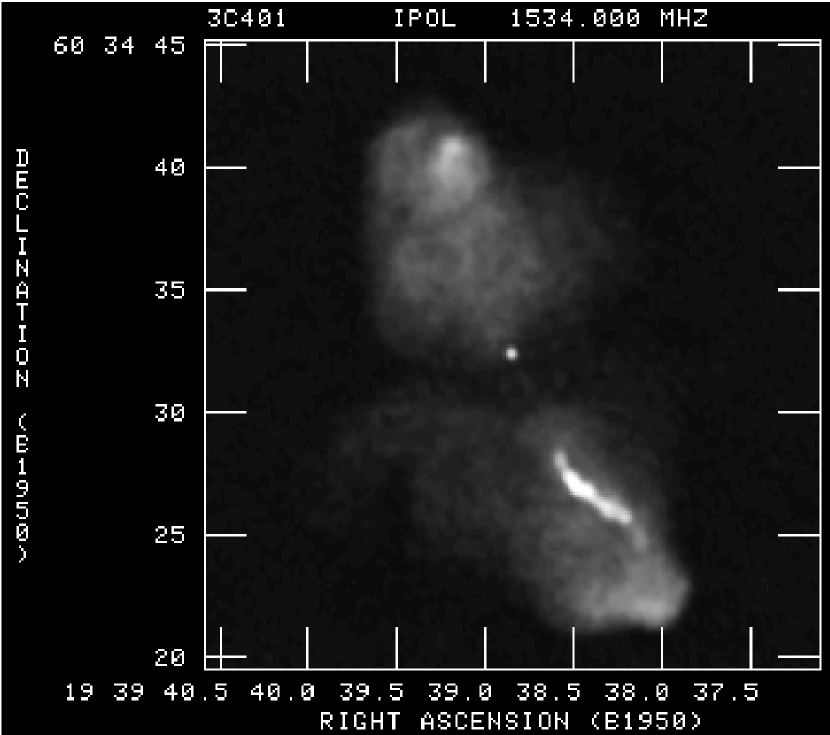
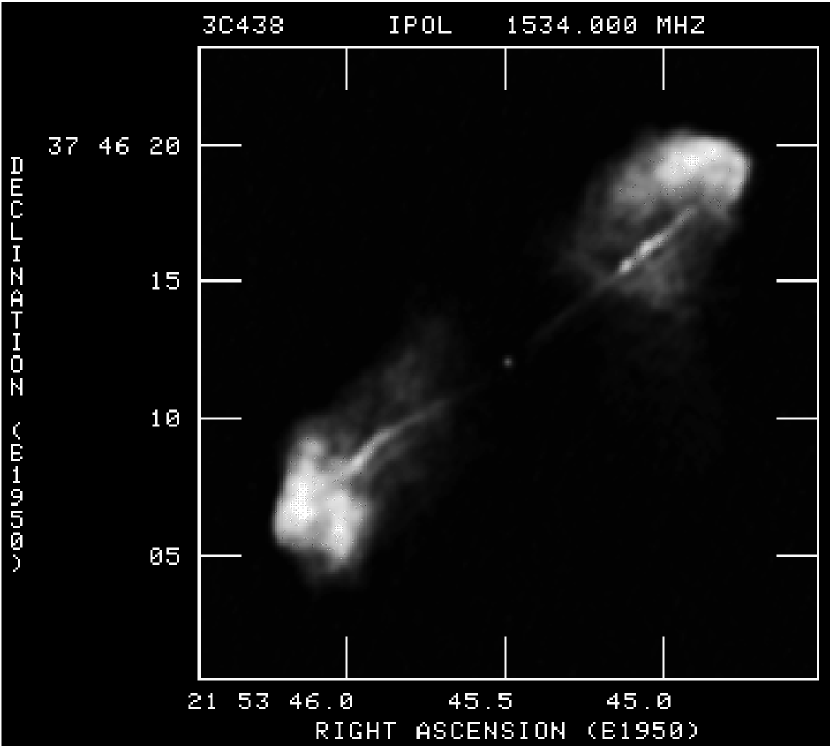
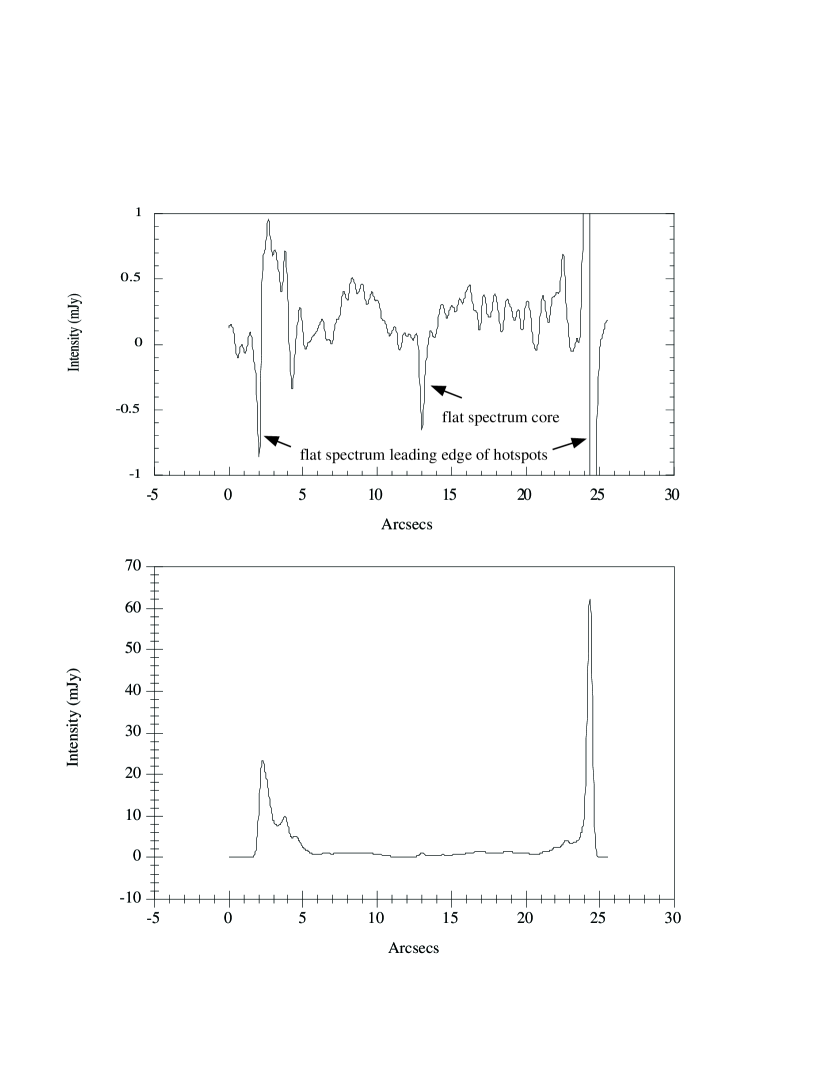
The maps used in this study were all obtained from previous studies. The maps at 8.4 GHz are VLA 111The Very Large Array is a facility of the National Radio Astronomy Observatory, operated by Associated Universities, Inc., under contract with the National Science Foundation. data from Hardcastle et al. (1997). The maps of the sources at a second frequency come from Leahy and Perley (1991) for 3C173.1, 3C349, 3C381, and 4C14.11 (VLA data); from Leahy et al. (1997) 222Available at URL: http://www.jb.man.ac.uk/atlas for 3C153, 3C401, and 3C438 (VLA and MERLIN data) 333MERLIN is a national facility operated by the University of Manchester on behalf of the UK Particle Physics and Astronomy Research Council (PPARC); and from Laing (private communication) for 3C132 (VLA data). Table 1 contains a list of each source at both frequencies used and the beamsize and noise of each map. For all maps, the center of the uv plane was well sampled, so the flux in the extended structure was well constrained. Total intensity maps of the two sources with prominent jets, 3C401 and 3C438, are shown in Figures 1 and 3. Tests of map fidelity and the robustness of the tomography results are discussed in the following section.
3 Analysis and Results
3.1 Map preparation
Prior to constructing the spectral tomography galleries, we first convolved the maps at each frequency to the same resolution. Then the maps were aligned by matching up the peak of the core or a hot spot (if the core was absent from the images). The peak locations were found by fitting the core or hot spot to elliptical gaussians. These alignments were verified by subtracting the maps at the two frequencies with small relative shifts in position and minimizing the rms residuals in a small area surrounding and including the core or hot spot. Any misalignment would result in a gradient in spectral index seen throughout the spectral tomography maps. No such global gradient was seen, and the alignments are correct to within 0.1 pixels.
3.2 Map fidelity
Because our work was based on previously published maps, constructing the spectral tomography galleries involved comparing images which had normally been imaged and deconvolved using different algorithms or weightings. In addition, some of our pairs of maps were made from observations which had very different samplings of the plane. It was important to be certain that these differences did not affect the reliability of the tomography images for the structures of scientific interest.
To assess the effect of these differences, we returned to the original data for the two jetted sources 3C 401 and 3C 438. The 8.4-GHz VLA data for these sources are a combination of observations with the A, B and C configurations of the VLA, with no more than an hour’s observation at each configuration (together with a 10-minute snapshot at D-array in the case of 3C 438). At our second frequency, 1.4 GHz, the data consist of a long track with MERLIN together with short observations with the A configuration of the VLA. While the longest and shortest baselines sampled by these observations are very similar, the detailed coverage of the plane is quite different. Because of the uneven sampling of the plane, the MERLIN+VLA data were particularly prone to the ‘rice pudding’ effect introduced by instabilities in the CLEAN algorithm (Cornwell 1983), and so they were deconvolved using a hybrid CLEAN/MEM technique (e.g. Leahy & Perley 1991), whereas the 8.4-GHz VLA data were simply deeply CLEANed. Because of these differences, and because of the complex structure seen in the two sources, they are good test cases for our investigation.
We quantified the effects of different sampling and deconvolution by simulating observations of the same source using the two different datasets. To do this we took the CLEAN components from a deep CLEAN of the 8.4-GHz data for the two sources at full resolution, assuming that this map represents adequately the total-intensity structures of interest. Using the aips task UVSUB, we replaced the real visibilities in both 1.4 and 8.4-GHz datasets with a model based on the CLEAN components. We then mapped the datasets using deconvolution techniques that were similar to those used to produce the real maps, convolved to a common resolution, and compared the resulting images.
If the deconvolution had been ideal, and the sampling perfect, we would expect to obtain identical maps from this process. In fact, there were small differences, particularly in the low-surface-brightness structure, which presumably result either from different sampling or, more likely, from artifacts introduced by deconvolution (such as rice-pudding effects in the deeply cleaned simulated 8.4-GHz maps). However, there were no systematic differences in the sources, which would reflect serious undersampling, and the high-surface-brightness regions of the simulated sources were essentially identical in the two maps. When we constructed maps of ‘spectral index’ between the two maps, the r.m.s. variation was of order 0.05 in the high-surface brightness regions, and the mean was indistinguishable from zero. We are therefore able to conclude that the differences in plane sampling and deconvolution do not introduce any significant errors into the analysis that follows; by contrast, the detailed structure of low surface brightness tomography images is not reliable and not discussed here.
The deconvolution procedures recovered most of the expected total fluxes. The maps contain approximately 90%, 100% at 1.4, 8.4 GHz, respectively, for 3C401, and 95%, 100% for 3C438. Any missing fluxes, which are likely to correspond to the largest-scale components, would not significantly affect any of the results in this paper. Tomography of well-sampled small-scale features, as discussed below, effectively removes any biases due to underlying diffuse structures, so errors in the reconstruction of the latter do not propagate. This would not be true, by contrast, with the standard method of calculating spectral indices using map division.
3.3 Spectral Tomography
To take a closer look at overlapping structures, one wants to first subtract out of the image a feature of a particular spectral index. Since we do not know a priori which spectral index to use to remove confusing structures, we construct a gallery of maps, each with a different spectral index “zeroed” out. That is, we construct a set of maps where,
.
If a structure has spectral index , the structure will disappear in map .
The intensity of the signal that is left behind in a tomography image has two origins - its overall intensity and a factor which depends on the difference between its actual spectral index and . We quantify this as follows: Suppose a feature has intensities and and a spectral index that is different than that of a particular tomography image . Then its intensity in that tomography image will become:
Thus, the presence of a feature in a tomography image shows that it has a different spectral index than the corresponding . However, its strength is the product of both its original intensity and a function depending on the difference between and . One cannot deduce the spectral index of a feature from tomography images, except where it disappears.
Because spectral tomography maps are a linear combination of total intensity maps, they have the same reliability and noise characteristics of the original intensity maps. Therefore, in the absence of deconvolution or other systematic problems, the off-source noise can be used as an indicator of the reliability of individual features on the tomography map. Deconvolution problems, such as described above, can be present in the same way on intensity or tomography maps. However, such problems are often more visible on tomography images; this is because a large fraction of the signal has been subtracted, while the artifacts at the two frequencies are unlikely to be identical and therefore do not subtract cleanly. We will refer back to these guidelines in our discussion of findings from the tomography images.
3.3.1 Mixed Spectral Indices in 3C401 and 3C438
When looking through the galleries, the first thing one notices is the mixture of spectral indices throughout the lobes of the sources. The most dramatic example is in source 3C438 as shown in Figure Spectral Structure in FRII Radio Galaxies and Jets. Figure Spectral Structure in FRII Radio Galaxies and Jets shows two spectral tomography maps, the north lobe of 3C438 at , and the south lobe at . In these maps, lighter tones indicate regions with spectral index flatter than the respective above values of while dark regions are steeper than . For example, the jet is flatter than in both these maps and shows up white. In the southern lobe, one can see a dark ring that has a steeper spectral index. There is also a light, therefore flat, “c”-shaped structure to the west.
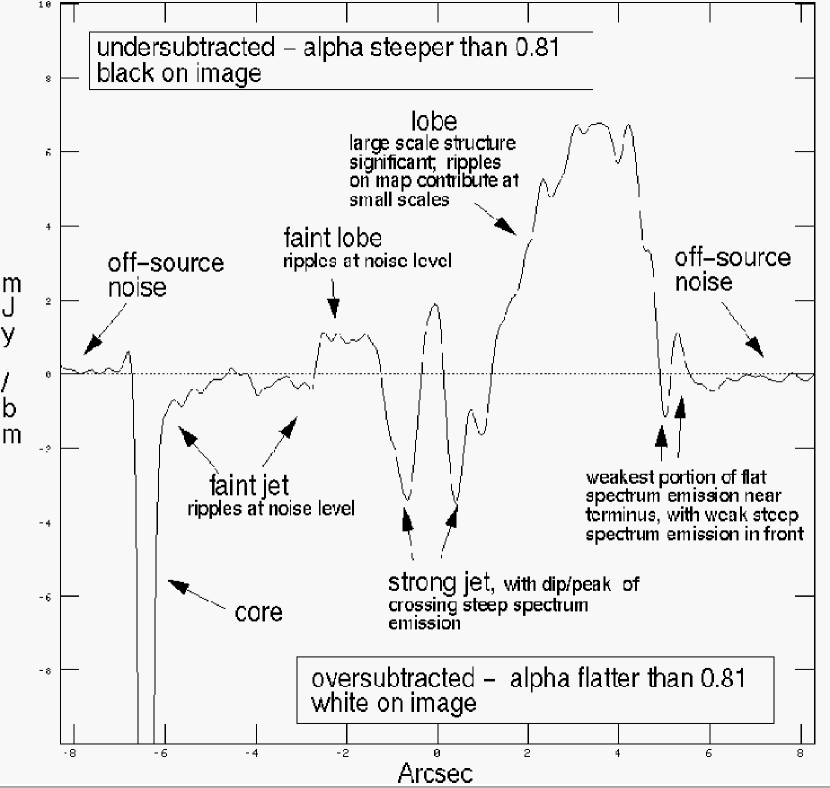
Regarding the reliability of features, the off-source ripple indicates the level of background noise. Additional spurious details are seen in the lobe emission from likely CLEAN artifacts, which can be recognized and assessed as they would in any other total intensity image. The existence of the separate flat/white and steep/black features are clear, high signal-to-noise results. The detailed small-scale fluctuations in the lobes are not. A slice along the N jet from the Figure Spectral Structure in FRII Radio Galaxies and Jets tomography image is shown in Figure 4 and details the noise trustworthiness of the various features.
3C401 and 3C153 had complex spectral structures similar to those in 3C438. The other sources had spectral gradients in their hot spots (see below). but lacked sufficient resolution or dynamic range to show more than an overall steepening of the lobe going from the hot spots towards the core.
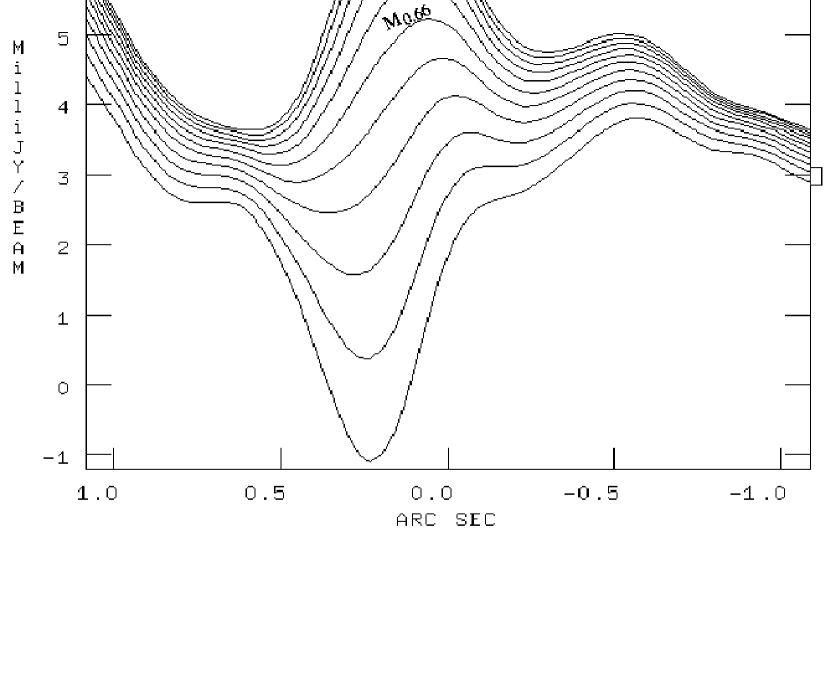
When examining the spectral tomography maps, we noticed that the hot spots appeared to have a spectral index gradient with of the outer edges of the hot spots being about 0.2 flatter than that of the inner edges. The first assumption upon seeing this was that the maps were misaligned, since a spectral index gradient can be a product of misalignment. But if the maps were misaligned, the gradient would be in the same direction in both hot spots, not in opposite directions as we see in Figure 17. In this figure of a slice across a tomography map, , intensities less than zero indicates regions with and intensities greater than zero indicate . Out of the eight sources we studied, four sources had no well defined hot spots or confusing structures near the hot spots. In the remaining four sources with clear hot spots, we saw a spectral index gradient clearly in three sources (3C132, 3C349, and 3C381) and tentatively in the fourth (3C173).
3.3.2 Structure Parallel to Jet
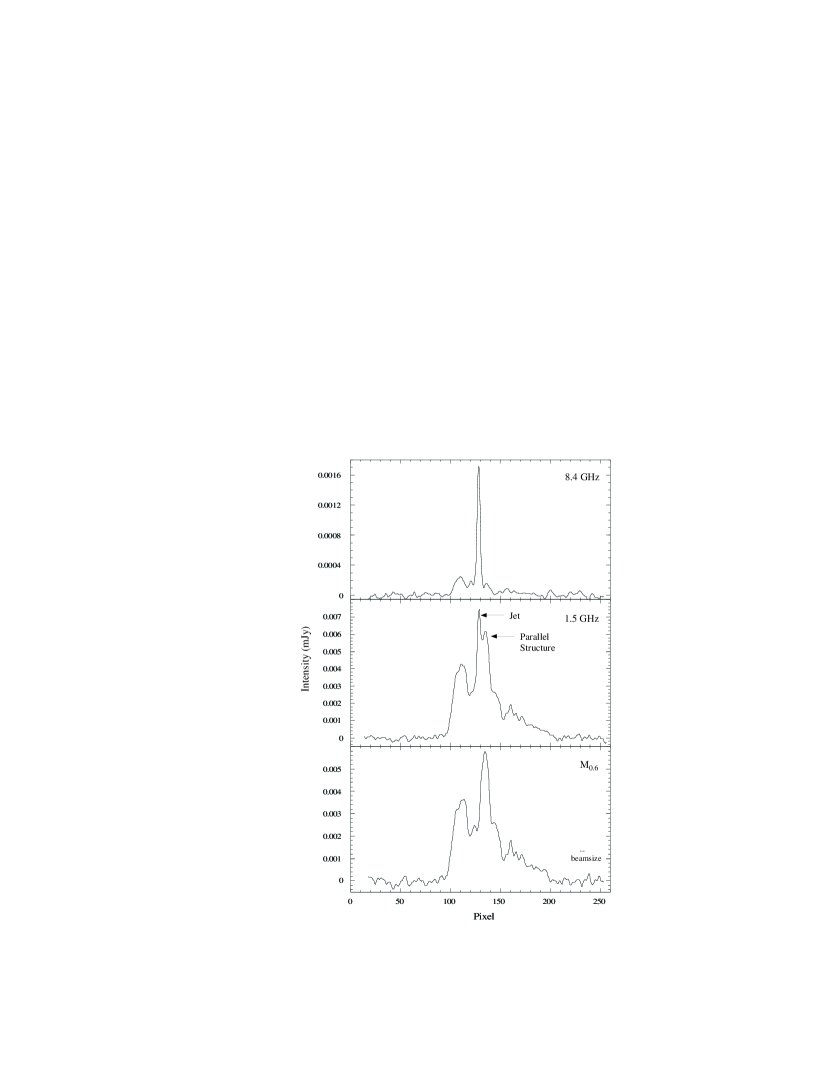
Among these structures of differing spectral index, one can see a structure that runs parallel to the jet in 3C438. This structure has a steeper spectral index () than the jet, as is shown in Figure 5.
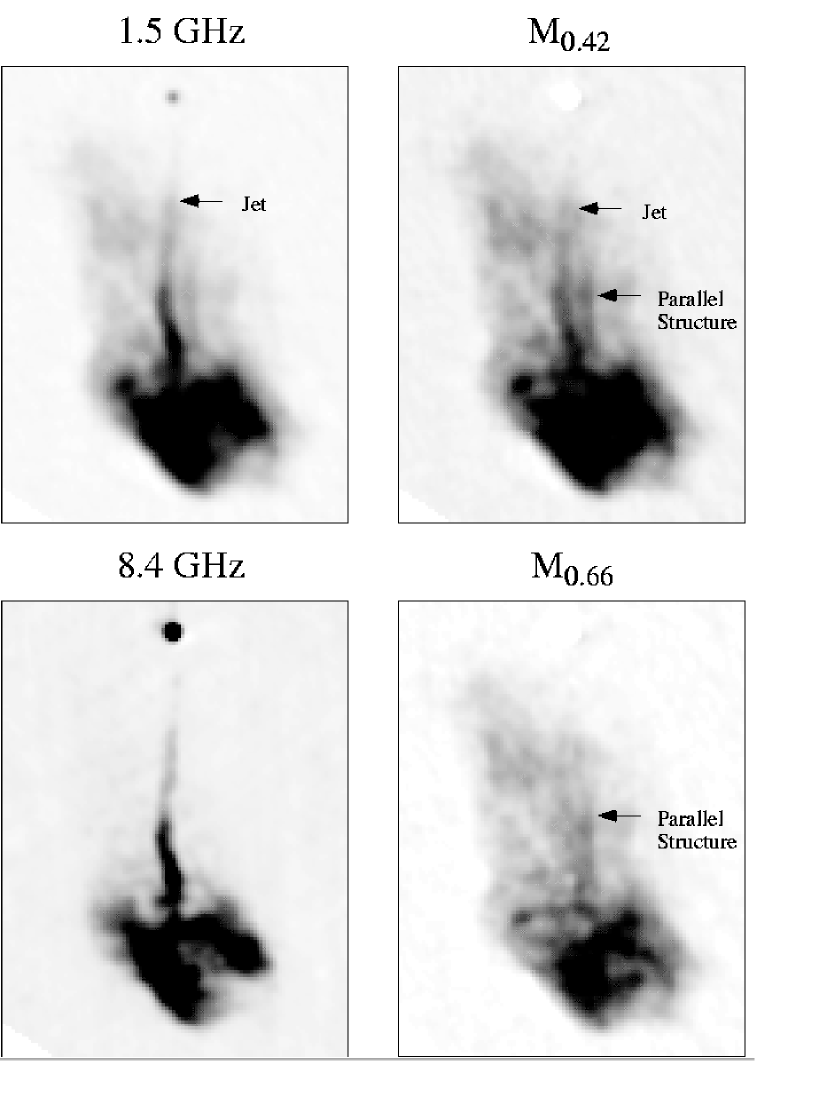
To take a closer look at this structure, we compressed the approximately 4” in the northern lobe that included the parallel structure to create an integrated slice across the jet. This integrated slice is shown in Figure 6 for 8.4 GHz, 1.5 GHz, and for , where the jet has disappeared from the tomography maps. The parallel structure is easily seen in the 1.5 GHz map, but is weaker in the 8.4 GHz map. The slices show that there may also be a steep spectrum feature partially blended with the jet on the opposite side from the parallel structure.
Figure 6 clearly shows that the structure we examined consists of a single peak, not multiple peaks or a sinusoidal pattern which would be expected if the structure was simply an imaging artifact. To further ensure that the structure was not an imaging artifact, a slice was taken along the jet and along the parallel structure. These slices are shown in Figure 7. The intensity of the parallel structure does not mimic the major small-scale peaks in the jet as would be expected for an imaging artifact. Furthermore, a similar structure parallel to the jet can be seen in the southern lobe where the jet bends. In the southern lobe, the parallel structure closely, but not perfectly, follows that bend of the jet. This behavior is not likely to result from an imaging artifact.
3.4 Error Analysis of Jet Spectra
To obtain more quantitative results on jet spectra in the two strongly jetted sources, 3C401 and 3C438, slices were taken across the jet for each spectral index in the gallery. When , the jet will disappear from the slice. Note, however, that the intensity at the position of the jet in does not go to zero, but instead reflects the residual lobe intensity at .
Determining , when the jet disappears, is necessarily subjective. In some cases, the determination is straightforward, in others, confusion from the background (lobe) emission makes identification of the local jet spectral index difficult. Examples of each of these cases are shown in Figure 8. Below, we estimate the errors in our results caused by confusing structures.
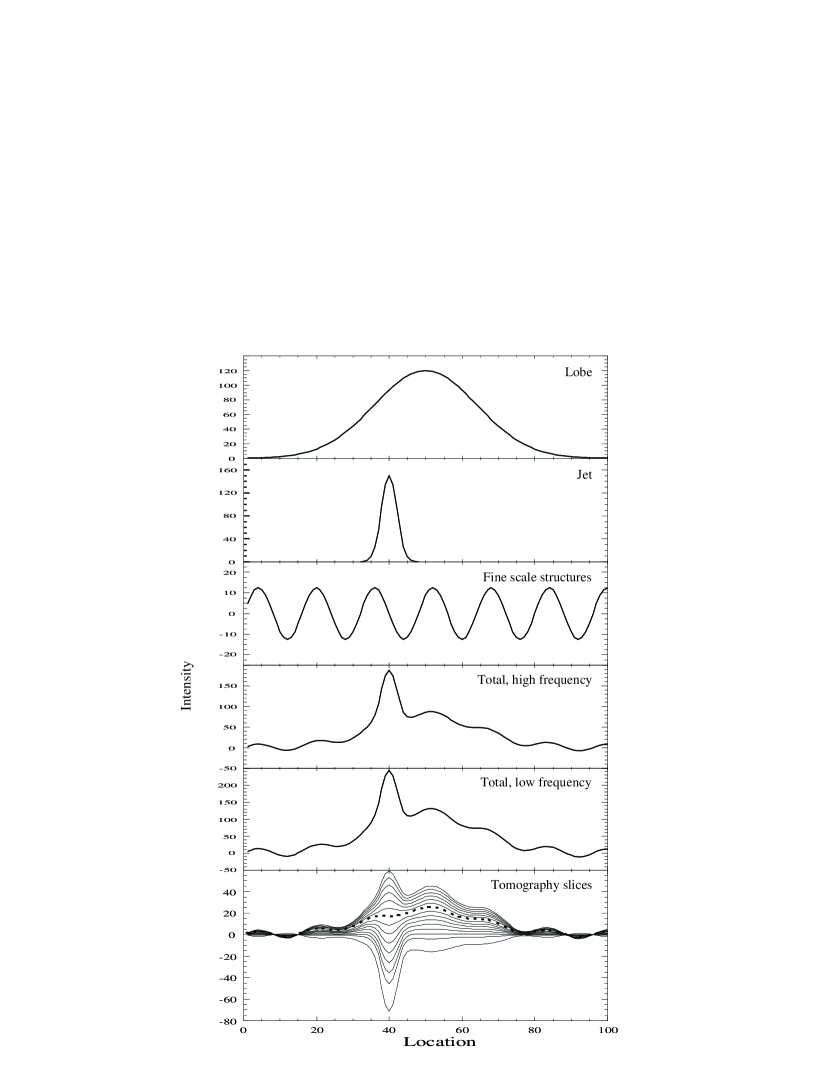
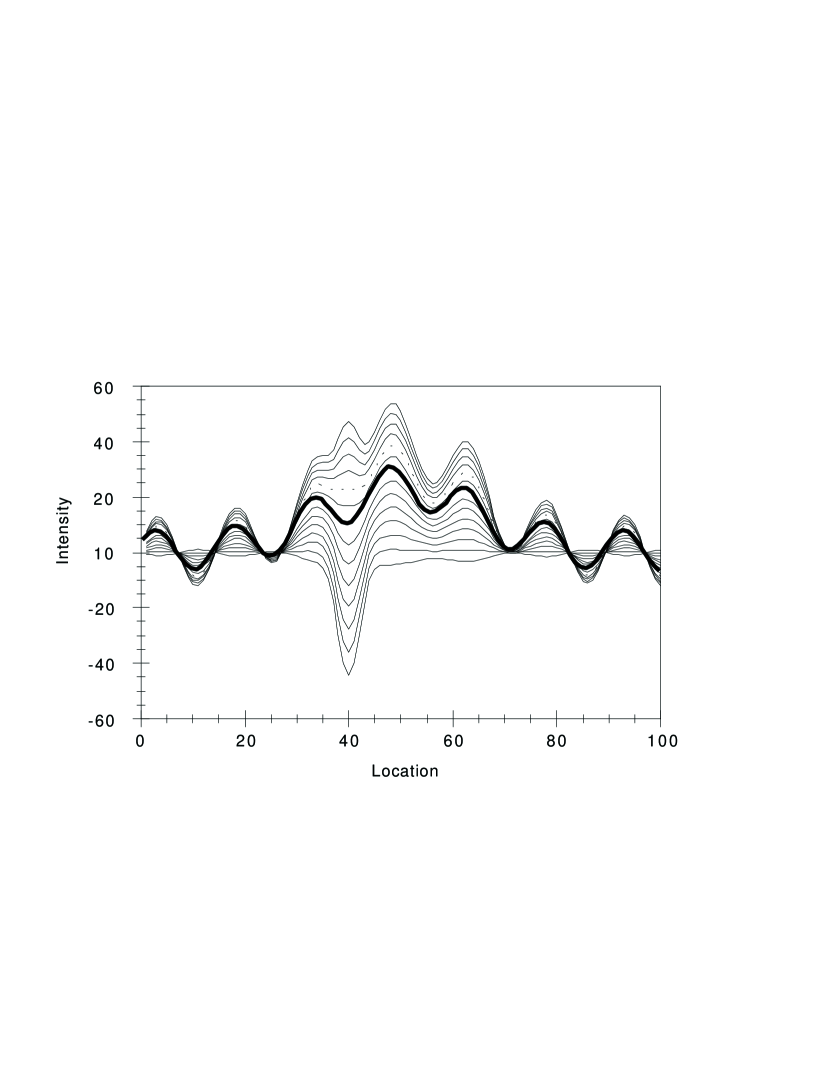
To test the reliability of determining spectral indices using tomography in the presence of confusing structures, we made a series of simple, one-dimensional, numerical models at two frequencies with a ratio of 1.44:1. These models included a narrow gaussian jet (FWHM = 3), a wide gaussian lobe (FWHM = 20), and superposed sine waves of different wavelengths to simulate irregularities in the lobe emission. The spectral index of the jet was set to 0.5, while the lobe and irregularities were set to 1.1 (see Figure 9). Then we varied several characteristics of the jet and lobe including the position of the jet relative to the lobe, and the width, intensity, and phase of the sine wave. Obviously, using a sine wave to simulate random irregularities is artificial, as the eye can detect the sine wave pattern in the unconfused area and follow it into the confused area, i.e. the jet. Whereas, when looking at the real data, it is impossible to tell when a confusing structure is perfectly overlapping the jet. But using the sine wave gives a useful approximation to the errors in identifying the “correct” jet spectral index.
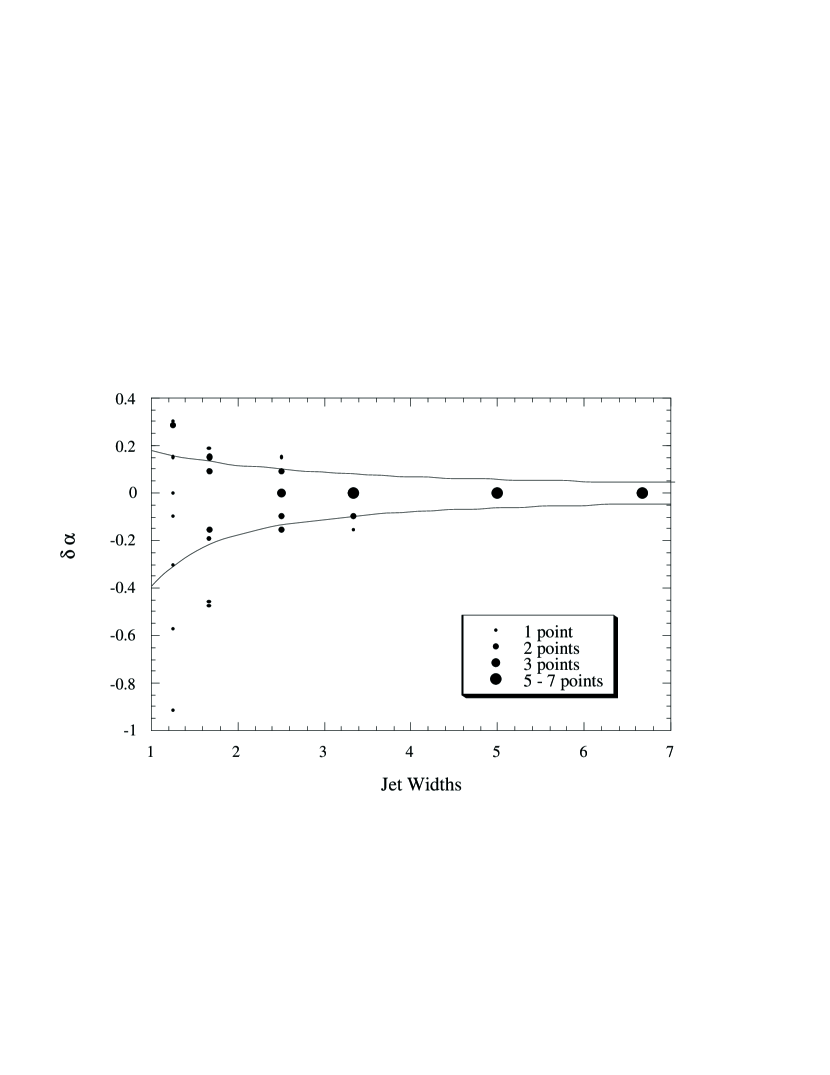
The most important effects on whether or not the correct spectral index was determined were the interfering sine wave’s width and intensity at the jet position (i.e., the phase of the sine wave); the jet’s position with respect to the lobe was not important. When looking at the slices, any sine waves significantly wider than the jet were easily distinguishable; determining the spectral index of the jet was difficult only when the width of the sine wave was on the same order as the jet. Figure 10 shows how the width of the sine wave affects the size of the error in . Plotted in this figure are the differences between the correct and the determined by spectral tomography for various sine waves of different wavelengths and different offsets of the peak from the jet. This figure shows that the correct spectral index falls within the range mean error about 2/3 of the time, with errors calculated analytically as discussed below. This implies that our calculated errors correspond to 1 .
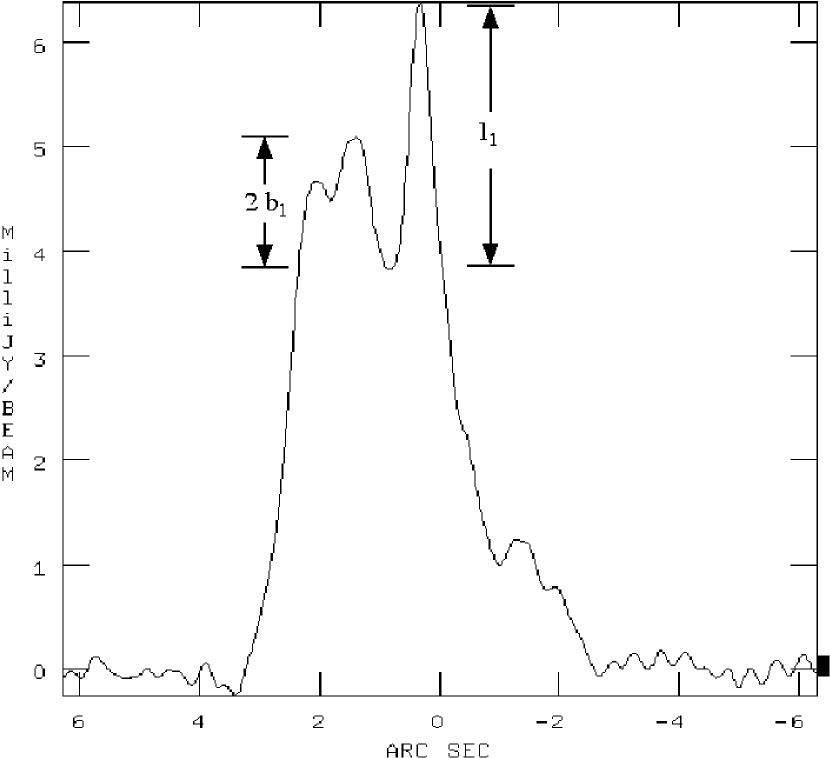
Figure 11 shows an extreme case where the minimum of the sine wave occurs at the jet. In this situation, inspection by eye gave a spectral index which was incorrect by 0.21. Analytically, the same error can be found by defining the true spectral index as , where and are the intensities at frequencies and respectively. With a confusing structure of intensity and , the observed spectral index will be . This leads to an error in spectral index of the jet of
We thus took the above analytical errors as a reasonable estimate and applied this to the real sources. Using slices from the total intensity maps at both frequencies, the intensities of the jet ( and ) and irregularities in the lobe ( and ) were estimated by eye. Since our models showed that irregularities with a width up to twice that of the jet created the largest errors, any irregularities on scales larger than this were ignored. To be conservative, we chose values for and equal to the largest deviations from the smoother background lobe. See Figure 12 for an example of how these values were determined. In this slice, the lobe intensity is estimated to be mJy/beam. This gives a conservative estimate for the jet intensity of mJy/beam. The intensity of the “noise” that we modeled as a sine wave is estimated as half of the total peak-to-peak deviation from the lobe - in this case mJy/beam.
In one situation, the spectral index of the jet could not be determined due to a third structure overlapping both the jet and lobe. This occurred in the northern lobe of 3C438 where a ring crosses the jet about 5” from the core.
Rudnick (2001b) also determined the spectral index along the jets of 3C438 and 3C401 using a multi-resolution filtering technique which automatically removes the contributions from large scale structures. The spectral index values found in that independent method agree quite well with those found here using spectral tomography.
3.5 Jet Properties
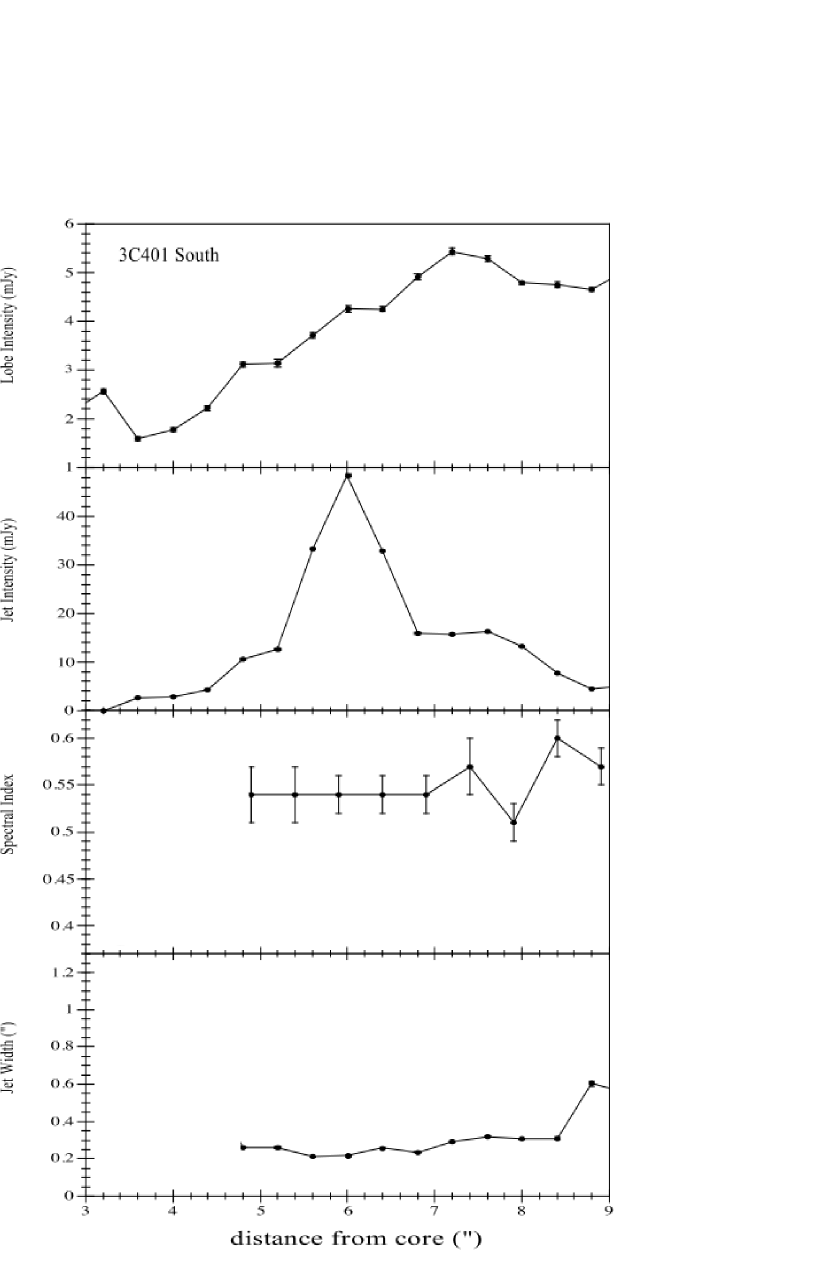
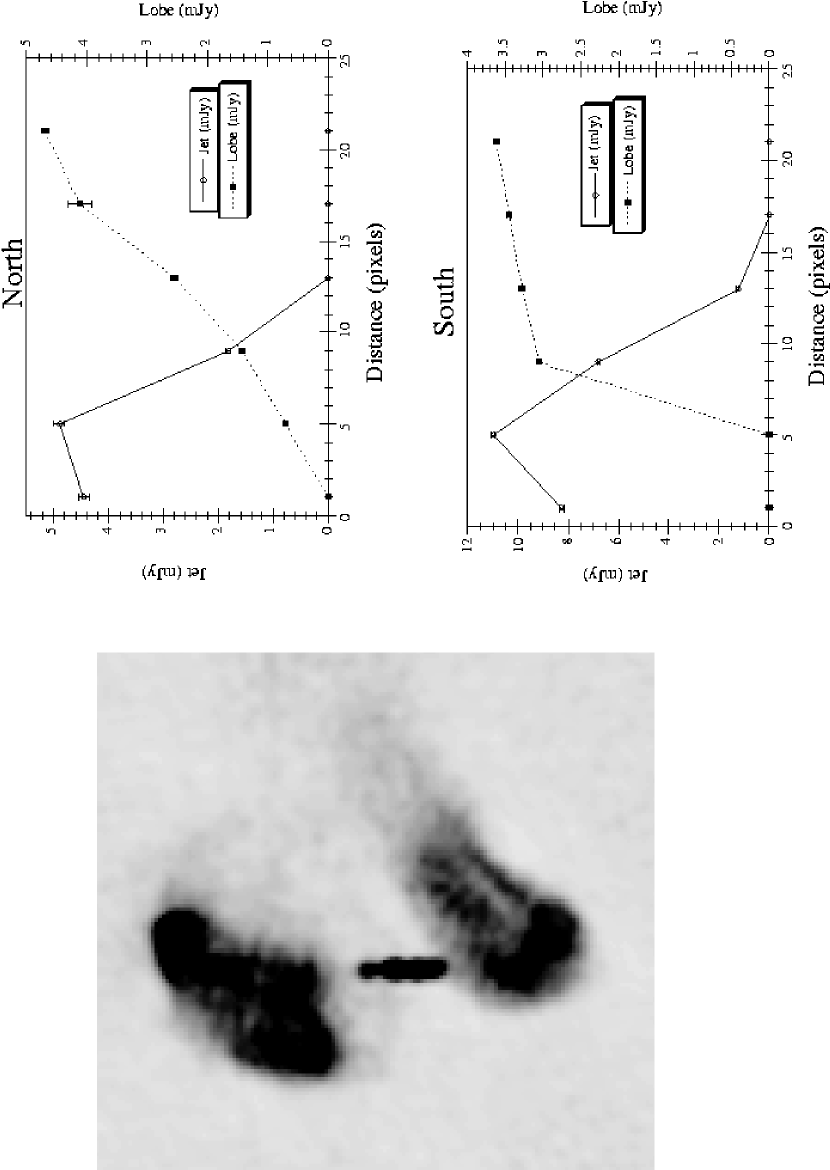
In order to compare the jet spectra with other jet properties, we determined the FWHM and peak intensity of the jet, and the peak intensity of the lobe by fitting a narrow and a wider gaussian to a slice perpendicular to the jet at each location. Occasionally, a third narrow gaussian was used to improve the fit when a filament or other structure was present in the slice. The errors shown for the width and intensity of the gaussians are formal errors in the fit. They do not take into account the fact that the jet and lobe are not perfect gaussians and that intermediate size structures may also be present.
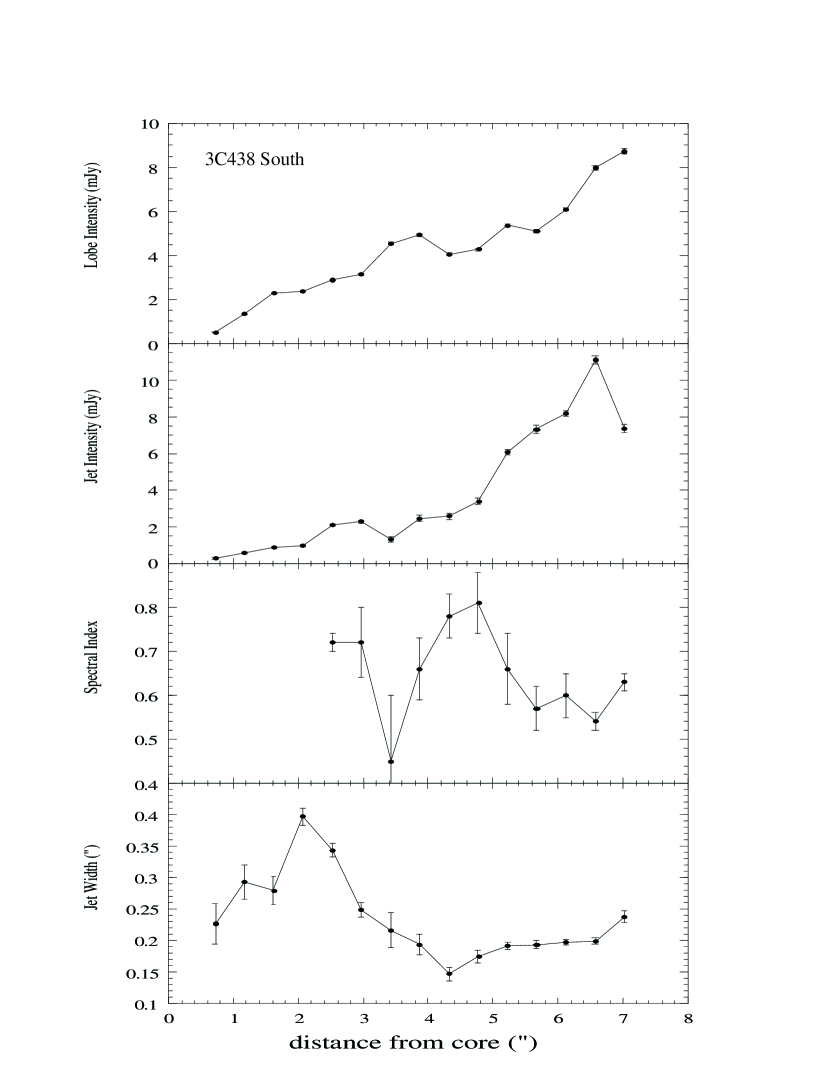
Figure 13 shows the results for 3C401. In this jet, the spectral index stays nearly constant at along the length of the jet. The jet width is unresolved by the Xband 0.27” beam until from the core. Figures 14 and 15 are the graphs for the northern and southern jets of 3C438, respectively. In the northern jet, the spectral index is flattest at approximately 3.5” from the core with almost monotonic steepening in both directions. Just beyond the point that the spectrum flattens, there is a dramatic widening of the jet and an increase in the intensities of both the jet and the lobe. The steepest spectral indices in the southern jet are seen between 4”-5” from the core. This steepening happens at the same point that the jet narrows in width - the opposite direction of the relation seen in the northern lobe.
3.6 Jet/Lobe Interactions
When looking at the intensities of the jet and lobe in the northern lobe of 3C438 (Figure 14), we found that while the jet can be seen well before the lobe emission, it then brightens considerably as it enters the lobe. Seeing this effect in one source prompted us to look for similar examples in other sources. We used the DRAGN Atlas 444Available at URL: http://www.jb.man.ac.uk/atlas/ (Leahy et al. 1997) to identify a sample of FRII radio galaxies that had a jet and a lobe that did not remain bright all the way back to the core, i.e. there was a jet that “entered” the bright region of the lobe. Of the fifteen jets that fit this criteria, twelve had cleanly separable jet and lobe emission enabling further study.
Our sample of twelve jets (see Table 2) included nine which showed a significant change in jet brightness as they entered the bright lobe and three (3C200, 3C305, and 3C401) which showed no significant change. In one source, 3C288, the jet faded after it entered the lobe (see Figure 16), while in the rest of the sources the jets brightened after entering the bright region of the lobe.
4 Discussion
4.1 Mixed Spectral Indices
The basic model of FRII radio galaxies includes lobes whose spectra gradually steepen with distance from the hot spots due to aging of the emitting electrons. In the lobes of 3C438, 3C401, and 3C153, the most diffuse parts of the emission follow this trend. However, we also see a complicated mixture of steep and flat spectral indices within the lobes. This mixture is seen in numerical simulations by Jones et al. (1999). These simulations show that electrons may encounter a variety of shock types and strengths as they emerge from the jet, creating different pockets of steep and flat spectrum electrons. This implies that these pockets of steep and flat spectra represent the history of particle acceleration of these electrons and do not necessarily reflect a current site of particle acceleration.
The “c”-shaped, flat-spectrum structure seen in the southern lobe of 3C438 may also be a past termination point for a flapping jet. Such a jet has been suggested by Hardcastle et al. (1997) and is seen in numerical simulations (e.g. Norman, 1996).
It is curious that our two best examples of mixed spectral indices, 3C438 and 3C401, are both in high density environments. (They are found in clusters, are surrounded by faint, diffuse x-ray emission, and have unusually low polarization, indicating a dense magneto-ionic environment, Hardcastle et al., 1997.) But is it also possible that the dense environment in some way caused the complicated spectral index structures that we see? Further comments about the interesting structures in these sources can be found in the DRAGN Atlas.
The gradient in spectral index that we see in several of our sources is also seen in numerical simulations by Ryu & Jones (private communication). In their simulations, the spectral index of the hot spots varied from 0.5 to 1.0 due to a strong magnetic field found at the end of the jet which caused severe spectral steepening. The hot spots in our study had spectral indices that ranged from 0.68 to 1.28, but each individual hot spot only varied up to 0.2.
4.2 Structures Parallel to Jet
There is a growing number of structures seen parallel to jets, as we found in 3C438. Other than their proximity and structural similarities to the jets, there is currently no way to separate these structures from random filamentary features in the lobes. Some parallel structures are seen in polarization (e.g. 3C66B, Hardcastle et al., 1996 and 3C219, Clarke et al., 1992) while others are seen in total intensity maps (e.g. Cygnus A, Katz-Stone & Rudnick, 1994). For 3C353 (Swain et al., 1998), structures parallel to the jets are seen in both polarization and total intensity. These structures seen in FRIs may also be related to the steep “cocoons” found around jets in WATs (Katz-Stone & Rudnick, 1994; and Katz-Stone et al., 1999). It is not clear how these various parallel structures are related to each other or to the particular example found in 3C438.
One interpretation of these features is as a slower moving sheath surrounding a faster spine, or inner jet (Laing, 1996). Spine/sheath models of jets have been shown to stabilize jets and may dominate jet dynamics (Sol et al., 1989 and Hanasz & Sol, 1996). If the sheaths are slower moving, then at a given distance from the core the electrons in the sheath could have aged and steepened more if the magnetic fields in the jet and sheath are comparable. Alternatively, the same curved electron energy distribution could appear steeper in the sheath due to lower magnetic fields (Katz-Stone et al., 1999). While it may be possible that the parallel structure we see in 3C438 is unrelated to the jet, this appears unlikely due to the close correspondence in their structure and brightness.
4.3 Spectra of Jets
The spectra of jets should reflect both the relativistic particle acceleration and loss histories. In WATs and other lower luminosity sources, the radio spectral index appears to be constant along the inner jet (3C449, Katz-Stone & Rudnick, 1997b: ; 3C66B, Hardcastle et al., 1996: ; M87, Owen et al., 1989: .) This suggests either that radiative losses are unimportant in the radio, or that the acceleration process is important all along the jet, and robust to the physical variations causing brightness and width changes. Even the radio/optical spectral indices for 3C66B (Jackson et al. 1993) or the derived power laws for M87 (Meisenheimer et al., 1996) show little variation along the jets. The strongest support for acceleration distributed along the jet comes from their X-ray detection, (e.g. 3C66B, Hardcastle, Birkinshaw and Worrall 2001), for which the lifetime of the presumed synchrotron emitting electrons can be as short as 30 years.
Very little information exists on the spectra of FRII jets. 3C236 shows considerable variation in the radio spectral index () of its inner components (Schillizzi et al. 2001). Cygnus A’s jet shows a similarly steep spectrum and significant curvature up to , with possible variation along the jet that is difficult to separate from the background (Katz-Stone, Rudnick & Anderson 1993). As noted earlier, we find that 3C401’s jet has an approximately constant spectral index of , similar to the FRI results above. We do see spectral variation in both jets of 3C438, but these are not monotonic steepenings as one might expect from simple radiative losses.
The origin of the spectral variations in the FRII jets is not clear. We looked for clues from the variations of spectrum, width and intensity in 3C438’s jets. In the southern jet, we found that the spectral index steepens at the same point that the jet narrows. In this same sense, in the northern jet the spectrum flattens as the jet widens. There are several possible explanations for this phenomenon among which we are unable to distinguish at this time. One possibility is that there is no evolution of the particle spectrum along the jet, but that varying magnetic fields result in different local spectral indices. An arbitrary tuning of the relativistic electron densities would then be required to fit the local brightnesses. Another possibility is that particle acceleration is occurring along the jet, and varies with the local conditions. For example, the increase in jet width could be accompanied by increased jet turbulence which could also increase particle acceleration, flatten the spectrum and increase the intensity. A dramatic increase in intensity is seen immediately after the spectrum flattens at 3.5” from the core in the northern lobe of 3C438. If there is particle acceleration at this point, multi-frequency observations should show a power law spectrum with a high break frequency.
We cannot draw conclusions from a single example, but the literature on FRII jets provides little additional guidance. Cygnus A’s jet shows regions of expansion and constant width (Perley, Dreher & Cowan 1984), although the connection to its knotty brightness profile is unclear. 3C219 shows significant variations in jet width, which Bridle, Perley & Henriksen (1986) suggest may be related to its local brightening. 3C353 has a well resolved jet width that remains virtually constant, although it has significant changes in brightness (Swain, Bridle & Baum 1998). Jet widths of four quasars are shown by Bridle et al. 1994, and have similar patterns of widening and narrowing as seen here for 3C438. These various behaviors, and the different possible interpretations of 3C438’s behavior, reflect very different physical pictures for the jet and the supply of relativistic particles to the hot spots and lobes. Sorting this out is likely to depend on multifrequency observations to measure local spectral shapes, with sufficient resolution to separate knots from the underlying structure in the jets.
4.4 Jet/Lobe Interactions
As discussed above, in nine of the twelve cases where we could isolate the jet and lobe intensities, we found significant changes in these jets as they entered the bright part of the lobe. How does the lobe affect the jet? One possibility is that the turbulence in the lobe may disrupt the jet and cause it to lose its coherency; the jet will decrease in brightness as seen in 3C288. Or the lobe material may stimulate shocks in the jet (Jones, Ryu & Engel, 1999), increasing its brightness as we see for the majority of the sources we studied. Another possibility is that when the jet enters the lobe, a second-order Fermi process reaccelerates particles in the boundary layer between the jet and lobe. If the increased brightness is caused by shocks stimulated by lobe material or by a second-order Fermi process in the boundary layer, the jet’s spectrum should flatten as it enters the lobe. This flattening is a signature of particle acceleration. For the one jet in our study which enters the lobe and which we have spectral index information (3C438 North), we see a slight, but inconclusive, flattening of spectral index.
5 Concluding Remarks
The relevance of the simple cartoons of powerful radio galaxies has eroded over the years. The jets are not steady (e.g., Burns, Christiansen & Hough 1982; Clarke & Burns 1991); indeed they may flap around near their terminus (Scheuer 1982). as indicated by both observations (Hardcastle et al. 1997) and numerical simulations (Hardee & Norman 1990). As a consequence, the canonical steady terminal shock (Blandford & Rees 1974), at which relativistic particles can be accelerated, does not exist. This raises the question about where particle energy gains and losses actually occur in radio galaxies. This question is highlighted by recent optical and X-ray observations of jets (M87, Perlman et al. 1999; Pictor A, Wilson, Young & Shepbold 2001) which may require particle acceleration along the entire length of the jet. The nature of the broad but “jet-like” structure in Cygnus A’s X-rays is unknown (Wilson, Young & Shepbold 2001). As far as simple pictures of the backflowing cocoons, we instead see that backflows are not smooth, and lobes may be populated by filamentary features (Owen, Eilek and Kassim 2000; Swain, Bridle & Baum 1998; Katz-Stone, Rudnick, & Anderson 1994). These may indicate flow instabilities, shocks or turbulence from interaction with the jet and surrounding medium. In the weaker, FRI, sources, there are clear indications of stratified jets, or jet/sheath structures (Katz-Stone et al. 1999).
This new level of complexity is well-illustrated in the latest generation of numerical simulations (Tregillis, Jones & Ryu 2001) which include relativistic particle acceleration along with 3D MHD. At issue is not simply the “weather” of radio galaxy structure, but the fundamental questions of what parts of the outgoing flow are actually visible as the “jet”, how the unstable jet drives the overall source dynamics and structure, and where and how the bulk of the relativistic particle acceleration takes place.
The spectral tomography work presented here illustrates the type of information available and needed to address such issues. Further work using high-quality data is especially needed to follow up on a) the spectral index structure in hot spot regions, b) spectral index variations along jets, and c) possible jet/lobe interactions. At the same time, broad explorations of parameter space with numerical simulations are needed to determine under what conditions behaviors such as reported here are found.
Acknowledgements.
We would like to thank Robert Laing and Rick Perley for the use of their data. MJH acknowledges support from PPARC grant number GR/K98582. This work is partially supported at the University of Minnesota by grants AST96-16964 and AST00-71167 from the National Science Foundation.References
-
- (1) Blandford, R.D. & Rees, M.J., 1984, Reviews of Modern Physics, 56 255
- (2) Bohringer, H. et al. 2001, A&A, 365 181
- (3) Bridle, Alan H. et al. 1989, AJ97 674
- (4) Bridle, A. H., Perley, R. A. & Henriksen, R. N. 1986 AJ92 534
- (5) Burns, J. O., Christiansen, W. A. & Hough, D. H. 1982 ApJ, 257 538
- (6) Celotti, A., Ghisellini, G. & Chiaberge, M., 2001 MNRAS, 321 L1
- (7) Clarke, David A. et al. 1992, ApJ, 385 173
- (8) Clarke, D. A. & Burns, J. O. 1991, ApJ, 369 308
- (9) Cornwell, T., 1983, A&A121 281
- (10) Eilek, J. A. and Hughes, P. A. 1991 in Beams and Jets in Astrophysics P. Hughes, Cambridge: Cambridge University Press 428
- (11) Ge, J. & Owen, F.N. 1994, AJ108, 1523
- (12) Feretti, L. et al. 1984, A&A139 50
- (13) Hanasz, M. and Sol, H. 1996, A&A, 315 355
- (14) Hardcastle, M. J. et al. 1996, MNRAS, 278 273
- (15) Hardcastle, M. J. et al. 1997, MNRAS, 288 859
- (16) Hardcastle, M. J. Birkinshaw, M. & Worrall, D. 2001, (preprint)
- (17) Hardee, P. & Norman, M. L. 1990, ApJ365 134
- (18) Jackson, N., Sparks, W. B., Miley, G. K., & Macchetto, F. 1993, A&A, 269 128
- (19) Jones, T. W., Ryu, D. & Engel, A., 1999, ApJ512 105
- (20) Katz-Stone, D. M., and Rudnick, L. 1994, ApJ, 426 116
- (21) Katz-Stone, D. M., and Rudnick, L. 1997a, ApJ, 479 258
- (22) Katz-Stone, D. M., and Rudnick, L. 1997b, ApJ, 488 146
- (23) Katz-Stone, D. M., Rudnick, L., Butenhoff, C. & O’Donaghue, A., 1999, ApJ, 516 716
- (24) Laing, R.A. 1996 in Energy Transport in Radio Galaxies and Quasars ASP Conference Series Vol. 100 P. E. Hardee, A. H. Bridle and J. A. Zensus, Provo: Brigham Young University Press, 241
- (25) Leahy, J. P. 1991 in Beams and Jets in Astrophysics P. Hughes, Cambridge: Cambridge University Press 100
- (26) Leahy, J. P. et al. 1986, MNRAS222 753
- (27) Leahy, J. P., Bridle, A. H. & Strom, R. G. 1997, “An Atlas of DRAGNs,” http://www.jb.man.ac.uk/atlas
- (28) Leahy, J. P., and Perley, R. A. 1991, AJ, 102 537
- (29) Meisenheimer, K. et al. 1996, A&A, 307 61
- (30) Norman, M. L. 1996 in Energy Transport in Radio Galaxies and Quasars ASP Conference Series Vol. 100 P. E. Hardee, A. H. Bridle and J. A. Zensus, Provo: Brigham Young University Press, 319
- (31) Owen, Frazer N. et al. 1989, ApJ, 340 698
- (32) Owen, F.N., Eilek, J. A. & Kassim, N. E., 2000, ApJ, 543 611
- (33) Perley, R. A., Dreher, J. W. & Cowan, J. J. 1984 ApJ285 L35
- (34) Roettiger, Kurt et al. 1994, ApJ421 L23
- (35) Rudnick, L. 2001, “What Shape are Your Spectra In?” in Proceedings of the Oxford Radio Galaxy Workshop, eds. R. Laing & K. Blundell, ASP Conf. Series (in press)
- (36) Rudnick, L. 2001b, “Simple Multiresolution Imaging and the Spectra of Synchrotron Sources”, submitted to ApJ
- (37) Scheuer, P.A.G. 1982, in Extragalactic Radio Sources, Proc. of IAU Symp. 97, Dordrecht, D. Reidel, 163
- (38) Schilizzi, R. T., Tian, W. W., Conway, J. E., Nan, R., Miley, G. K., Barthel, P.D. Normandeau, M., Dallacasa, D. & Gurvits, L. I., 2001 A&A, 368 398
- (39) Sol, H. et al. 1989, MNRAS, 237 411
- (40) Swain, Mark R., Bridle, A.H., & Baum, S. 1998, ApJ, 507 29
- (41) Tregillis, I., Jones, T.W. & Ryu, D., 2001, ApJ(in press, astro-ph/0104305)
- (42) Wilson, A., Young, A. J., & Shopbell, P.L., 2001, preprint (astro-ph/0101422)
![[Uncaptioned image]](/html/astro-ph/0108264/assets/x3.png)


| Source | Frequency | Beamsize | RMS Noise | Reference |
| (GHz) | (”) | (Jy/beam) | ||
| 3C132 | 4.96 | 0.33 | 38 | 1 |
| 8.44 | 0.22 | 29 | 2 | |
| 3C153 | 1.53 | 0.15 | 95 | 3 |
| 8.44 | 0.25 | 28 | 2 | |
| 3C173.1 | 1.45 | 2.60 | 77 | 4 |
| 8.44 | 2.60 | 89 | 2 | |
| 3C349 | 1.50 | 2.90 | 102 | 4 |
| 8.44 | 2.90 | 59 | 2 | |
| 3C381 | 1.45 | 3.25 | 151 | 4 |
| 8.44 | 3.25 | 99 | 2 | |
| 3C401 | 1.53 | 0.35 | 76 | 3 |
| 8.44 | 0.27 | 24 | 2 | |
| 3C438 | 1.53 | 0.29 | 97 | 3 |
| 8.44 | 0.23 | 25 | 2 | |
| 4C14.11 | 1.45 | 3.00 | 68 | 4 |
| 8.44 | 3.00 | 29 | 2 |
| Source | Number of | Change in Jet | Reference |
|---|---|---|---|
| Jets | Brightness? | ||
| 3C28 | 1 | Increase(1) | Leahy, Bridle & Strom, 1997 |
| 3C33.1 | 1 | Increase(2) | Leahy, Bridle & Strom, 1997 |
| 3C200 | 1 | No | Clarke, D. A. and Burns, J. O. (unpublished) |
| 3C219 | 1 | Increase(2) | Clarke et al., 1992 |
| 3C285 | 1 | Increase | Leahy et al., 1986 |
| 3C288 | 2 | Decrease | Bridle et al., 1989 |
| 3C305 | 1 | No | Leahy, Bridle & Strom, 1997 |
| 3C388 | 1 | Increase(2) | Roettiger et al., 1994 |
| 3C401 | 1 | No | Hardcastle et al., 1997; Leahy, Bridle & Strom, 1997 |
| 3C438 | 2 | Increase | Hardcastle et al., 1997; Leahy, Bridle & Strom, 1997 |