submitted to The Astrophysical Journal
Gamma Ray Burst in a Molecular Cloud:
Destruction of Dust and H2, and Emergent Spectrum
Abstract
A gamma ray burst with strong optical-UV emission occuring in a molecular cloud will photodissociate H2, photoionize H2, H, and He, and destroy dust grains. We model these processes, including time-dependent radiative transfer in both continuum radiation and the resonance lines of . The UV will pump into vibrationally-excited levels. We calculate the absorption spectrum imprinted on radiation from the GRB at various times. In addition to the strong absorption lines of at due to cold ambient gas, we find that radiation reaching us from the GRB and its afterglow will show strong absorption lines due to vibrationally-excited at . These absorption lines, if observed, would provide unequivocal evidence for association of the GRB with molecular gas. Low-resolution spectra will exhibit conspicuous features due to clustering of individual lines; a list of the strongest such absorption features is given for spectral resolution characteristic of the grism on the Swift UV-Optical Telescope.
1 Introduction
Gamma-ray bursts (GRBs) rank among the most dramatic, most energetic, and least understood celestial phenomena. Although at least some GRBs are now known to originate from cosmological distances, the progenitor objects, or their locations in galaxies, are not yet known. Only 40% of GRBs have detectable optical afterglows, whereas the X-ray afterglow detection rate is 100%; the undetected optical afterglows may have been extinguished by dust in the host galaxy (see Lazzati, Covino, & Ghisselini 2001; Ramirez-Ruiz, Trentham, & Blain 2001; and references therein). Since GRBs may be associated with star-forming regions (Paczyński 1998, 1999; MacFadyen, Woosley, & Heger 2001), it is of interest to consider phenomena which would be indicative of molecular gas in the vicinity of the GRB.
At least some GRBs are accompanied by intense optical emission, as demonstrated by detection of a 9th magnitude optical transient coinciding with GRB 990123 (Akerlof et al. 1999) and optical afterglows associated with other GRBs (e.g., GRB 990510: Stanek et al. 1999; Israel et al. 1999). The energy radiated in the optical-UV flash and afterglow can be substantial, and can have dramatic effects on interstellar gas and dust in the vicinity of the GRB. The emission will photoionize the gas, and the pulse of optical radiation will vaporize dust grains out to substantial distances from the GRB (Waxman & Draine 2000, hereafter WD00). The gamma-rays and hard X-rays emitted by the GRB will contribute to ionization of the nearby gas, but the UV and soft X-rays have the dominant effect because of the much greater number of photons, and much larger photoabsorption and photoionization cross sections. The time-dependence of atomic and ionic absorption lines and photoionization edges in the spectra of GRBs has been discussed by Perna & Loeb (1998), Böttcher et al (1999), and Lazzati, Perna, & Loeb (2001). In the present work we focus on the rich absorption spectrum of .
Ultraviolet radiation will destroy in the vicinity of the GRB, but before destruction some of the molecules will be vibrationally excited by UV pumping. A preliminary study of the UV pumping (Draine 2000) found that high degrees of vibrational excitation would prevail in the undergoing photodissociation and photoionization, and an estimate of the column density of this vibrationally-excited gas indicated that it could imprint a conspicuous absorption spectrum on light reaching us from the GRB flash and afterglow. If observed, this absorption at would be a clear sign that the GRB was in close proximity to a molecular cloud.
The previous study did not explicitly include self-shielding in the lines, or the details of the competition between photoionization and photodissociation of the , and therefore it was only possible to make approximate estimates of the column density of vibrationally-excited . In the present work we carry out a detailed calculation of the effects of a high-luminosity optical transient on surrounding dust and molecular gas. We calculate the evolution of the dust and gas in the neighborhood of the source of radiation, including radiative transfer through the absorbing medium. We include the dominant sources of opacity: dust grains, , , H, He, and . Computational limitations dictate using radial zones which can be optically thick to 13.6 eV – 100 eV ionizing photons, and in the Lyman and Werner band transitions of . We describe a numerical method which can be used to follow the motion of the ionization and dissociation fronts in this regime.
The GRB light curve adopted for the calculation is given in §2, where it is compared with the observed light curve of GRB 990123. Because GRB 990123 appears to have been unusually bright, in this paper we consider the effects of an optical transient with a peak ultraviolet luminosity less than 1/40 that of GRB 990123, and an integrated optical luminosity per steradian perhaps 1% of GRB 990123. The computational method is described in §3, and the physical processes (dust destruction, photoexcitation, and photoionization) are summarized in §4.
In §6 we present results for our adopted lightcurve , for two cloud densities ( and ) and for two different power-law indices ( and -1) for the UV-X-ray spectrum . In §7 we discuss the prospects for observing these absorption features in the spectrum of a GRB fireball or afterglow, either with ground-based observations of GRBs at redshift , or using the grism on the Swift GRB Explorer for GRBs at redshift . We summarize our results in §8.
2 The Optical-UV Flash
Let where is the radiated power per solid angle in our direction. It is not yet known what should be taken for the “typical” for a GRB at optical – soft X-ray wavelengths.
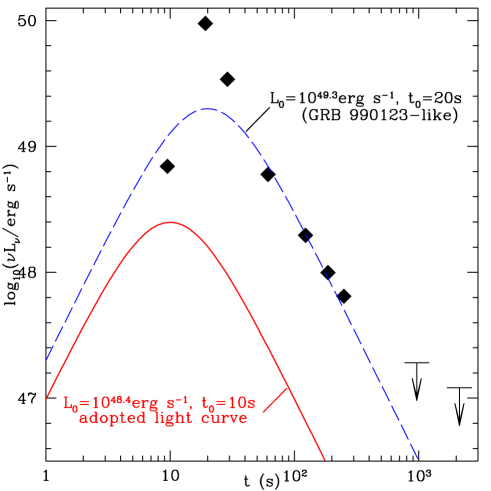
In Figure 1 we show of GRB 990123, at redshift ,111Assuming , an open cosmology with , and zero extinction. at rest-frame wavelength .
As a simple fitting function to describe the time-dependent luminosity, we adopt
| (1) |
A spectral index is suggested by simple models for the reverse shock (Waxman & Draine 2000). Steeper spectral indices have been observed for optical-UV afterglows: for GRB 010222, at redshift (Masetti et al. 2001) Lee et al. (2001) find at , Stanek et al. (2001) find at , and Masetti et al. (2001) find for .
With , and , eq. (1) approximates the light curve of GRB 990123 at , although falling at least a factor 5 below the observed peak bightness at (see Fig. 1).
The dependence of equation (1) at is required to approximate the observed rapid decline in brightness of GRB 990123 between 20 and 300 sec (see Fig. 1). However, at later times afterglows appear to fade less rapidly: for GRB 010222, for , and for (Stanek et al. 2001; Masetti et al. 2001). For the present study we are concerned with the lightcurve at , which we will approximate using equation (1).
GRB 990123 was in the top 0.4% in gamma-ray fluence for GRBs detected by the BATSE instrument, and LOTIS observations further suggest that most GRBs detected by BATSE have lower ratios of optical to gamma-ray emission (Williams et al. 1999). Accordingly, we adopt – i.e., a peak luminosity about of what was observed for GRB 990123 – and as “typical” parameters. For this corresponds to the optical transient having an energy between 1 and 13.6 eV given by ; for , .
3 Radiative Transfer
We divide the cloud into spherical shells of uniform thickness , with outer radii and midpoints . At each radius , let be the “retarded” time.
The shell thickness is small enough () so that an individual shell is optically thin in dust, but the shells may be optically thick to photoionizing radiation, or in absorption lines of . We therefore calculate rates for photoionization, photodissociation, or photoabsorption averaged over the shell volume
| (2) |
At frequency , the optical depth contributed by shell is
| (3) |
where , , , , , and are the contributions in shell due to extinction by dust, and continuous absorption by , , , , and , respectively; is the contribution of an individual absorption line (see §3.3). Absorption by metals not in dust grains (initially O, N, Ne, and S will be most important, and C, Mg, Si, and Fe will enter the gas phase in regions where grains are vaporized) has been neglected in eq. (3), because the present calculation is limited to the gas phase species H, H+, H2, H, He, He+, and He2+. We have thereby underestimated the attenuation at eV.
We divide the electromagnetic spectrum into 3 intervals: , , and . For purposes of modelling the heating of dust grains by the UV-optical radiation, we include the contribution of absorption lines only within the interval ; the summation in equation (3) is restricted to lines within this interval, with calculated from eq. (14) below.
The total optical depth from to is
| (4) |
3.1 Absorption and Scattering by Dust
The contribution by dust in shell is
| (5) |
where is the dust radius in shell at retarded time , and and are the usual efficiency factors for absorption and scattering. The radiation from the GRB is concentrated in a shell-like “pulse” with a spatial thickness of light-sec (see Fig. 1). Scattering is important because it reduces the intensity in the pulse; the scattered photons will fall behind the outward-propagating pulse unless the scattering angle is very small. For scattering angle , after travelling a distance the scattered photon will fall behind the unscattered pulse by a time
| (6) |
so that the time delay will be significant for scattering angle . The dust grains will have radii (see §5.1). For , the characteristic scattering angle is arcmin at 2 keV, and arcmin at 0.5 keV (see Figs. 3 and 4 of Smith & Dwek 1998) so we take the scattering efficiency factor to be
| (7) |
In Fig. 2 we show calculated for graphite and silicate grains. At , the silicate absorption efficiency is much larger because of the inner shell absorptions from Mg, Si, and Fe. In the present calculation we do not distinguish between grain types, and we need a simple estimate for the absorption efficiency which can be rapidly evaluated. As a simple approximation, we adopt
| (8) |
which can be seen in Fig. 2 to approximate the average absorption cross sections of graphite and silicate grains.
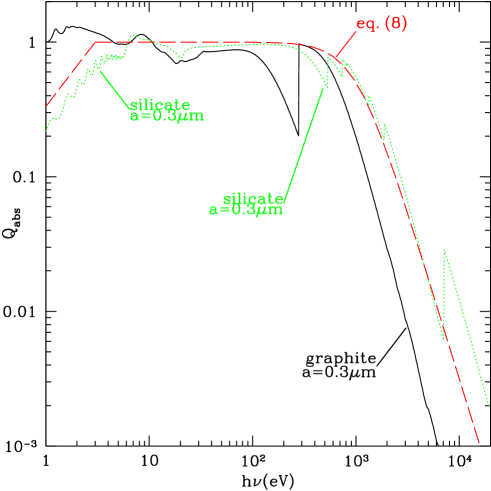
When grain destruction has reduced the grain radius to , eq. (8) will overestimate ; when this is true, however, grain destruction is nearly complete and the error in overall grain destruction will be unimportant.
3.2 Continuous Absorption by Atoms, Molecules, and Ions
Continuous absorption by species contributes
| (9) |
where is the abundance of in shell at retarded time , and is the continuous absorption cross section.
The probability that a photon which enters the shell will be absorbed or scattered is . For a homogeneous shell, a fraction of the absorptions will be due to continuous absorption by species (e.g., ). The photon absorption rate per , averaged over the shell, is
| (10) |
Integration over frequency is accomplished numerically, with and evaluated using equations (3) and (4).
3.3 Line Absorption
Line absorption is important for . Consider a specific absorption line , with central frequency . We assume that the has a Maxwellian velocity distribution with broadening parameter , and we compute the dimensionless equivalent width
| (11) |
where is the (Voigt profile) absorption cross section for absorption line , and
| (12) |
is the column density of the vibration-rotation state producing absorption line .
The incremental equivalent width contributed by shell is
| (13) |
If we approximate the line absorption as due to many lines randomly distributed over the frequency interval , the optical depth contribution due to line averaged over the wavelength interval is (see Draine & Bertoldi 1996)
| (14) |
and the mean photoabsorption rate in radial shell for excitation out of level by the absorption line is
| (15) |
Strong line absorption by occurs primarily in , so we include the optical depth correction (14) only for this interval.
4 Physical Processes
4.1 Dust Destruction by Thermal Sublimation
The thermal sublimation rate from a grain at temperature can be approximated by (Guhathakurta & Draine 1989, hereafter GD89)
| (16) |
where is the mean atomic mass, and is the chemical binding energy per atom. We take , , and as representative values for refractory grains (GD89; WD00). We assume that all of the energy of absorbed photons (including X-rays) is converted to heat – we neglect the energy of photoelectrons and X-ray fluorescence, but this is a smal fraction of the total absorbed energy.
In the middle of shell , the grain temperature is determined by (WD00)
| (17) |
where is the Plank-averaged absorption efficiency. For the temperature range of interest for dust sublimation, , we approximate (WD00)
| (18) |
intermediate between the emissivities of astronomical silicate and graphite.
4.2 Dust Destruction by Electrostatic Stresses?
Waxman & Draine (2000) noted that a highly-charged dust grain can also be destroyed by “Coulomb explosion” if the electrostatic stress exceeds the tensile strength of the grain materials, when the grain potential reaches
| (19) |
The importance of this process is controversial. Waxman & Draine argued that submicron grains would likely have high enough tensile strengths () that highly-charged grains would not undergo fission by this process, but would instead be gradually eroded by the process of “ion field emission”, where singly-charged ions are emitted one-by-one when the grain potential exceeds a critical value
| (20) |
(Muller & Tsong 1969; Draine & Salpeter 1979). Fruchter, Krolik, & Rhoads (2001), on the other hand, have argued for lower tensile strengths (), in which case grain fission would take place when the grain potential reached . Fruchter et al argue that “the large flux of energetic photons bombarding the grain is likely to damage the grain’s crystalline structure”, reducing the tensile strength.
While chemical bonds will undoubtedly be disrupted by ionization, it seems likely that chemical bonds will be promptly reestablished in the warm grain – i.e., “annealing” will take place. In this case, a grain which has already been charged to the ion-field emission threshold potential would emit one ion per escaping photoelectron. To sustain ion field emission, the grain must emit photoelectrons with sufficient energy to overcome the potential . Consider, for example, a grain with radius , charged to : only photoelectrons with kinetic energy at the grain surface are able to escape. For a grain with composition MgFeSiO4, a photon of energy (for example) has a total absorption coefficient in the grain material, but only of the absorptions produce photoelectrons with ,222 photons absorbed by the Mg, Si, and Fe K shells (with photoelectric thresholds 1.32, 1.87, and 7.11 keV) produce photoelectrons with 8.68, 8.13 and 2.89 keV, respectively. for an effective absorption coefficient . The total electron density in the grain is , so the effective photoabsorption cross section per electron is – a factor of 24 larger than estimated by Waxman & Draine (2000), but a factor smaller than the absorption cross section just above the Si K edge which Fruchter et al used to estimate the rate of photoelectric emission driving grain fragmentation by electrostatic stresses.
Grain destruction by ion field emission requires a fluence , where is the atomic density and is the effective absorption coefficient for producing photoelectrons with energies . For kV, we have and of photons. For and distance , the fluence of photons is (neglecting absorption), so we might expect grain destruction by ion field emission at distances . However, as we will see below (§6), grain destruction by thermal sublimation is effective out to distances of several pc.
4.3 Photoexcitation of H2
Let index denote the vibration-rotation levels of the electronic ground state X. At a given point in the cloud, let be the fraction of H nuclei which are in vibration-rotation level .
Prior to the GRB, is almost entirely in the first two or three rotational levels (=0,1,2) of the =0 vibrational level of the electronic ground state (X). The first UV photons to be absorbed will photoexcite the to the B and C electronic states (via Lyman or Werner band transitions), which requires and , respectively) or photoionize the to , which requires [for ]. which is photoexcited to the B or C states will decay back to the ground electronic state in , but typically to a vibrationally-excited level (e.g.,) with the rotational quantum number changed by . The lifetimes of the vibrationally-excited levels are long compared to the timescale for photoexcitation or photoionization, so depopulation of the vibrationally-excited levels of will be primarily by UV photoexcitation and photoionization.
The intensity of the radiation field at 1000Å relative to the local interstellar radiation field estimate of Habing (1968) is
| (21) |
Stimulated emission in the UV transitions is negligible if . We therefore assume that photoexcitation out of level of X to vibration-rotation states of B and C will be followed (immediately) by spontaneous decay either to bound levels of the ground electronic state X, or else to the vibrational continuum of X (i.e., photodissociation). formation on grains or in the gas will be neglected since we will be concerned with conditions where the is destroyed in a matter of seconds or minutes. Collisional deexcitation can be neglected if . The spontaneous decay via quadrupole transitions out of vibrationally-excited level can also be neglected if .
Let be the rate for photopumping of out of level into level , and let and be the rates for photodissociation and photoionization out of level . If
| (22) |
then the abundances evolve according to
| (23) |
Following Draine & Bertoldi (1996), we consider the 299 bound states of with , and calculate equivalent widths using Lyman and Werner band oscillator strengths from Abgrall et al. (1993a,b) and Roueff (1993).
Let denote a Lyman or Werner band transition from a specific vibration rotation state of the electronic ground state to an excited state . Photoexcitation rates in shell are calculated using eq. (15). Let be the probability that electronically-excited state will decay to vibration-rotation state of the electronic ground state. Averaged over the shell, the rate for UV pumping from vibration-rotation level to vibration-rotation level is
| (24) |
where the summation is restricted to transitions out of level . The photodissociation rate out of level is
| (25) |
where is the probability that level will decay by a transition to the vibrational continuum.
We neglect line absorption by the ion, as it is likely to be of secondary importance.
4.4
The different vibrationally-rotation levels of the electronic ground state of will have different energy thresholds for photoionization. We will, however, neglect these differences and assume that all in the ground electronic state requires to be photoionized, with the cross section as given by eq.(17-19) of Yan et al. (1998). The photoionization rate averaged over the shell is evaluated using eq. (10).
4.5
has 19 vibrational levels; for photoionization of the vibrational distribution is expected to peak at , with 80% of the population in (Busch & Dunn 1972). With radiative lifetimes , there will be negligible deexcitation by spontaneous decay during the optical transient. Averaged over the vibrational distribution, the photodissociation cross section found by von Busch & Dunn (1972) can be fit by
| (26) |
giving a peak cross section at (). The photodissociation rate averaged over the shell is evaluated using eq. (10).
4.6
For photoionization of we adopt a cross section
| (27) |
which approximates the photoionization cross section calculated by Bates & Opik (1968) for the ground vibrational state of . The photoionization rate averaged over the shell is evaluated using eq. (10).
4.7
Atomic from the photodissociation of or can be photoionized by photons with with a cross section (Osterbrock 1989)
| (28) |
The photoionization rate averaged over the shell is evaluated using eq. (10).
4.8 and
The cross sections for photoionization of He and are (Osterbrock 1989)
| (29) |
| (30) |
The photoionization rates and averaged over the shell are evaluated using eq. (10).
5 Photochemical Evolution
5.1 Initial Conditions
As initial conditions we take He to be neutral, and 100% of the hydrogen in , divided equally between the first two rotation levels:
| (31) |
We assume that dust grains of initial radius initially contribute a mass equal to 1% of the H mass, with initial number density
| (32) |
where is the assumed density of the grain material, is the number density of nuclei, and is the mass of one atom. Thus the initial geometric cross section per H atom is
| (33) |
Since the radiation propagates only in the outward direction (we are neglecting scattered light), the time evolution of each shell depends only on interior shells. We therefore calculate the complete time evolution for each shell, beginning with shell 1 and proceeding outward. For each shell , we begin integrating at retarded time . For each value of we use stored information for interior shells to compute the time- and frequency-dependent optical depth due to material interior to shell .
The calculation for shell is terminated when [see eq. (1)] and nearly all of the flash energy has been expended, or if all of the following conditions are fulfilled: 1. all has been photodissociated to and then photoionized into , or photoionized first to and then to [our criteria for this are , , and ]; 2. the dust has been destroyed (); 3. helium is fully photoionized to .
5.2 Integration Scheme
A very simple explicit scheme is used to advance the abundances in each shell:
| (34) |
where is , , , , , , or vibration-rotation level population .
For all cases we used radial zone thickness . At a given distance and retarded time , we take the time step to be
| (35) |
| (36) |
| (37) |
is the shortest time scale for destruction, while is the timescale for production of . The rates are given by equation (22). We used for all cases; we verified that the computed results were insensitive to factor-of-two variations in and .
6 Results
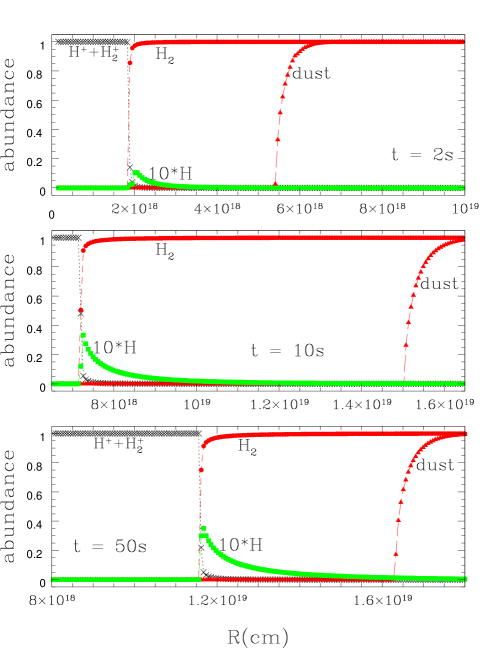
Radial abundance profiles are shown in Fig. 3, for three values of the retarded time , for an optical transient with the light curve given by eq. (1) with spectral index , located in a molecular cloud of density .
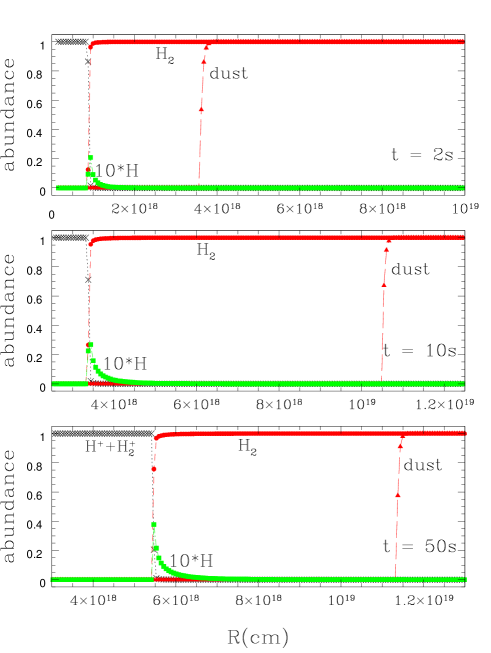
In Fig. 4 we show abundance profiles for the same three values of retarded time, for the same optical transient but situated in a cloud of density . In its initial molecular form, an individual shell is opaque to ionizing radiation , and is highly opaque in individual resononance lines; it is therefore essential to use the shell-averaged rates given by eq. (10) for continuum absorption, or (15) for line absorption. As one would expect, the increased opacity of the medium delays propagation of the destruction fronts.
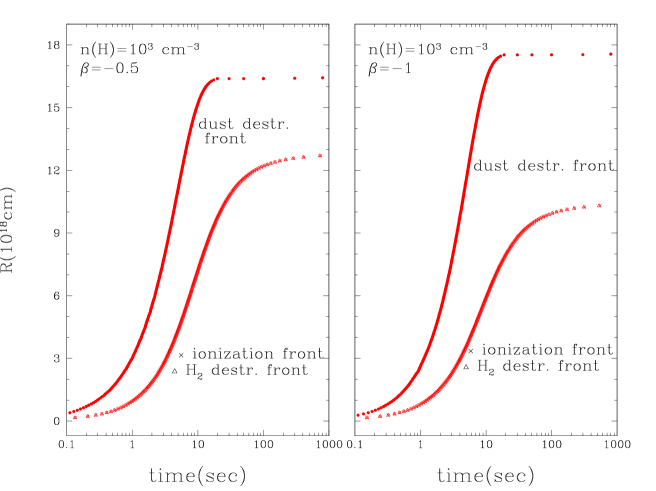
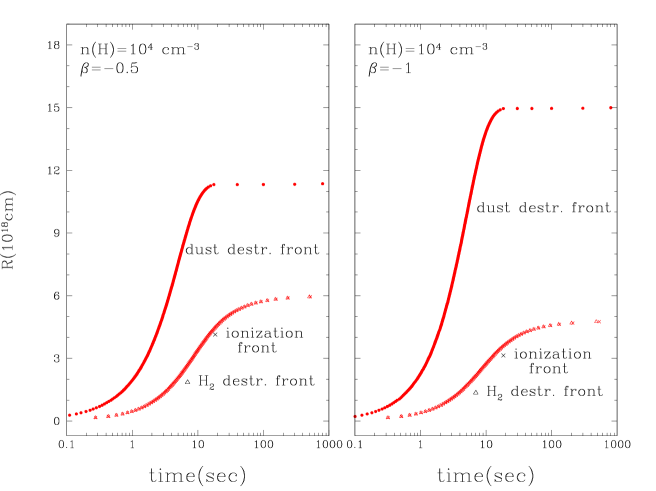
In Figs. 5 and 6 we show the locations of the dust destruction, dissociation, and ionization fronts as functions of time for our standard optical transient in clouds of density and , and we also show the front locations as functions of time for a GRB with a softer UV spectrum characterized by .
6.1 Dust Destruction
In Fig. 3 we see that by the dust destruction front has already reached , significantly ahead of the ionization/dissociation front at . At late times the dust destruction front “stalls” when the transient luminosity has dropped to the point where it can no longer heat dust at this distance to the temperatures required for significant sublimation, while the ionization/dissociation front continues to advance at a rate proportional to the luminosity. As a result, for this case the ionization/dissociation front catches up to the dust destruction front (at ) and moves past it at late times (see Fig. 5). The dust destruction front (see Fig. 3) has a thickness , corresponding to a gas column density , and an optical-uv extinction (prior to dust destruction) .
In Figs. 5 and 6 we show the location of the dust destruction front as a function of retarded time for our adopted optical transient (for spectral indices and ) and cloud densities and . For both cases we confirm the conclusion of WD00: the dust destruction front initially advances well ahead of the ionization/dissociation front, with the dust heated primarily by radiation which is not absorbed by H, He, or . For and the dust destruction radius for our adopted optical transient, while for we find .
For a transient with peak luminosity in 1–7eV photons – close to the peak 1–7.5 eV luminosity for our adopted light curve with – WD00 estimated the grain destruction radius to be for , and for . The grain destruction radius estimated by WD00 for these two cases is in good agreement with our detailed modelling.
6.2 Photodissociation and Photoionization
In Fig. 3 we can see that the dissociation front and ionization front are merged (i.e., they do not separate). However, the ionization front is relatively sharp (with the fractional ionization varying from 0.1 to 0.9 over a column density ), whereas the dissociation front (zone where H atoms are present) tends to be broader, and to extend ahead of the ionization front. For (see Fig. 3) the dissociation front extends , corresponding to the column density required for to absorb most of the photons between 11.1 and 13.6 eV (Draine & Bertoldi 1996). As expected, the ionization front is unresolved, since the column density of a single shell () corresponds to an optical depth of at the Lyman edge [hence the importance of using eq. (10) to obtain the average rate of photoionization in an optically-thick shell]. This is even more pronounced for the case, for which we have used the same shell thickness as for .
6.3 Vibrationally-Excited H2
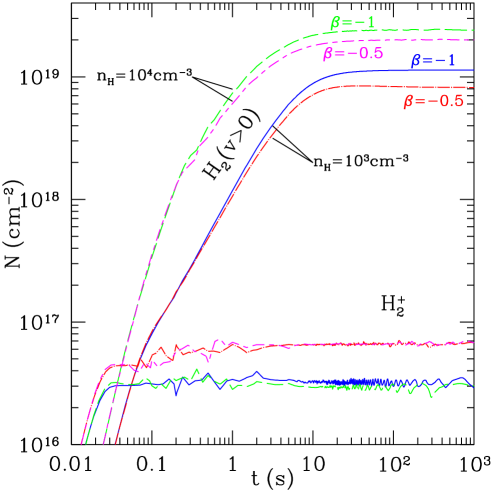
Following absorption of a Lyman or Werner band photon, about 85% of the time an molecule will undergo a spontaneous radiative decay (in ) to a vibrationally-excited level of the ground electronic state. The vibrationally-excited will persist until it is either photoionized or absorbs another Lyman or Werner band photon (on the timescales of interest here, spontaneous emission in the quadrupole lines is negligible, as are collisional processes). In Figure 7 we show the column density of vibrationally-excited as a function of time. For all cases considered, increases until the UV irradiation ceases [unlike the , which quickly stabilizes at a value ]. Photoionization acts to reduce the amount of vibrationally-excited present at any instant, so GRB with softer UV-EUV spectra would be expected to have larger column densities of vibrationally-excited . Our calculations confirm this: Fig. 7 shows that an optical transient with spectral index (i.e., ) produces more vibrationally-excited than a burst with .
As we see below, the large column densities of vibrationally-excited will produce strong absorption lines.
6.4 Emergent Spectrum
The radiation reaching us from the optical transient is filtered through the dust and gas. Unless and until the photoionization front reaches the edge of the gas cloud, photoelectric absorption by H will impose a cutoff at 13.6 eV, with photoelectric absorption by further contributing to absorption above 15.4 eV. At X-ray energies the gas cloud may again become transparent, allowing the X-ray flash and afterglow to be observed, but our attention here will be limited to energies , where there will be four main contributions to absorption: dust, the Lyman and Werner bands of , photodissociation of , and the Lyman lines of H.
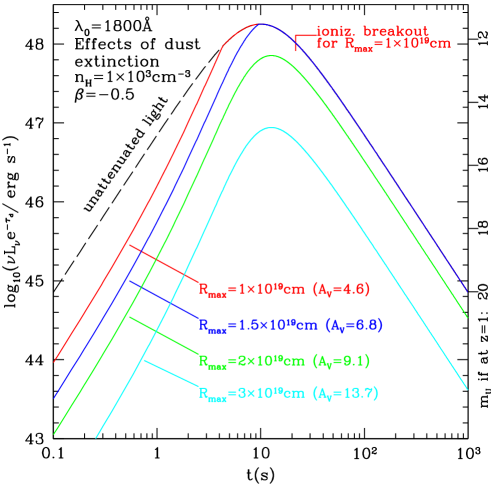
The extinction by dust will affect whether the optical transient is observable. In principle there could be spectral features (e.g., the 2175 feature) in this absorption, but our understanding of the optical properties of dust in these dense regions is such that no realistic estimate is possible. In Fig. 8 we show the emergent luminosity after extinction by dust for ambient density . Light curves are shown for various assumed cloud radii; for each case the initial visual extinction to the GRB is indicated. In the case of cloud radius, the ionization/dissociation front reaches the cloud surface at ; after this time, there will of course no longer be absorption features of appearing in the spectrum of the GRB. For , however, the ionization/dissociation front is contained within the cloud, and the absorption lines will persist in the spectrum of the GRB afterglow at late times.
For purposes of discussion we focus on our standard lightcurve with in a cloud of density . By destroying the dust out to , the GRB has reduced the extinction between us and the GRB by mag. Thus if, for example, the dust in the cloud had initially presented an extinction of, say, 8 mag to the GRB, the GRB afterglow would be subject to only 3 mag of foreground dust.
The column densities tend to be considerably smaller than those of (see Figure 7), so we have not attempted to calculate the column densities of the individual vibration-rotation levels and the ultraviolet absorption lines out of these levels. Most of the electronic absorption by will be in photodissociating transitions, which contribute continuous absorption which we have approximated by eq. (26).
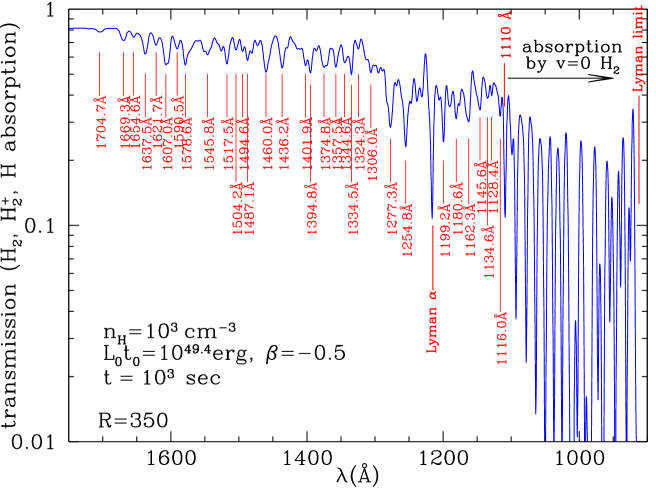
In Fig. 9 we show the transmission of the foreground medium for the cloud and spectral index , for spectral resolution characteristic of the grism on the Swift UVOT instrument. Fig. 9 shows only the absorption due to lines of and H, and the continuous absorption of . Voigt profiles were used for both the H and lines. Over the timescales of interest here, the H and gas is essentially collisionless. For the lines we have therefore used a Doppler broadening parameter characteristic of “microturbulence” in the quiescent pre-GRB molecular gas. The H atoms, on the other hand, will have a velocity distribution resulting from photodissociation of and . The mean kinetic energy per H atom is (Stephens & Dalgarno 1973) corresponding to a Maxwellian distribution with ; this will add in quadrature to the microturbulence, so we take for the H atoms.
The spectrum consists of literally thousands of saturated narrow lines, but even at resolution, a number of absorption features are conspicuous. In Figure 9 we have labelled 32 conspicuous features longward of . These features are all blends of a number of nearby lines. For each feature in Table 1 we list the three strongest lines within of the central wavelength of each feature. The strongest lines tend to be saturated (e.g., the strongest line in the conspicuous 1277.3Å feature is Lyman 8-6R(1) 1277.39Å with a central optical depth and an equivalent width ).
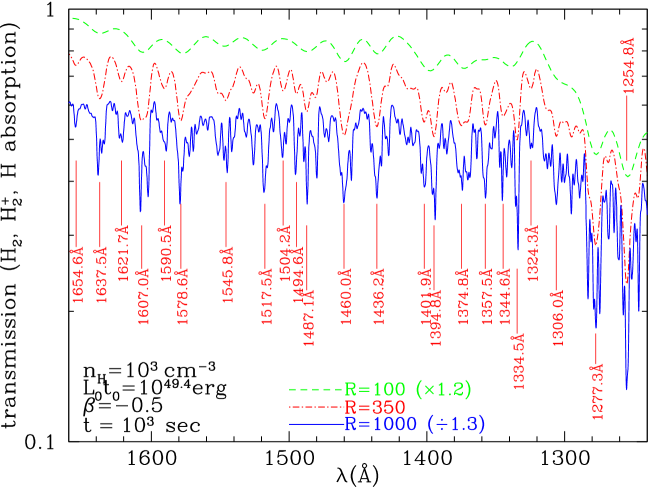
Figure 10 shows the transmission spectrum observed with three different spectral resolutions: , 350, and 1000. While the spectrum of course shows the most structure, we see that the resolution is quite well-matched to the widths of the prominent absorption blends. If the resolution is degraded to , most of the absorption blends still appear as well-defined minima, though a few do not (e.g., .) For observations, it would appear that a signal-to-noise ratio of 10 or more would be sufficient to test for the presence or absence of the stronger absorption features (e.g., 1607.0, 1460.0, 1401.9, 1277.3, 1254.8).
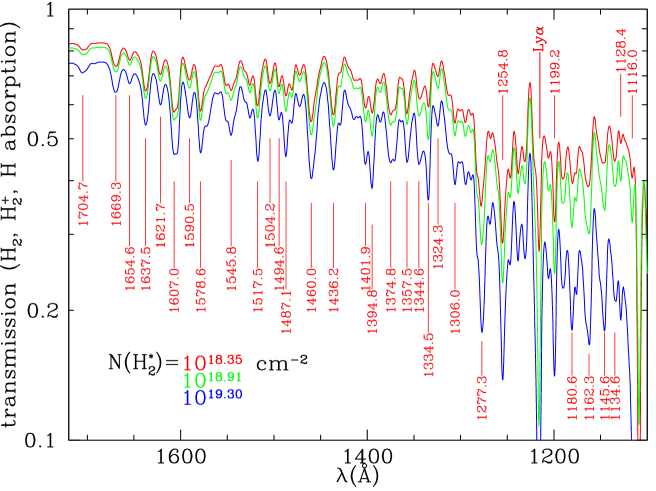
Because the lines are saturated, the overall spectrum is not sensitive to the precise amount of vibrationally-excited . To see this, in Figure 11 we show the spectrum for three different values of the column density of vibrationally-excited , ranging from (the value at for the , case) to (the value at for the , case). While the depth of the absorption features does increase with increasing , the increase is fairly modest despite the order-of-magnitude change in .
| (Å)a | Three strongest contributing linesb | ||
|---|---|---|---|
| 1704.7 | 3–13P(1) 1704.51 | 3–13R(0) 1702.63 | 3–13P(2) 1705.29 |
| 1669.3 | 2–11R(1) 1667.46 | 4–13R(1) 1667.28 | 2–11P(1) 1670.40 |
| 1654.6 | 1–10R(1) 1654.99 | 5–14P(1) 1654.19 | 1–10R(0) 1655.40 |
| 1637.5 | 4–12R(1) 1638.90 | 3–11P(1) 1636.33 | 4–12R(2) 1638.52 |
| 1621.7 | 2–10R(1) 1620.74 | 2–10P(1) 1623.51 | 2–10R(0) 1621.05 |
| 1607.0 | 6–13P(1) 1607.50 | 5–12R(0) 1608.43 | 5–12R(3) 1607.58 |
| 1590.5 | 3–10R(1) 1588.76 | 3–10P(1) 1591.31 | 3–10R(0) 1588.98 |
| 1578.6 | 7–13R(1) 1577.02 | 0–8R(1) 1576.88 | 7–13P(1) 1579.18 |
| 1545.8 | 1–8R(1) 1544.90 | 1–8P(1) 1547.54 | 1–8R(0) 1544.94 |
| 1517.5 | 0–7R(1) 1516.23 | 2–8P(1) 1517.44 | 0–7P(1) 1518.90 |
| 1504.2 | 10–13P(1) 1504.15 | 10–13P(2) 1504.92 | 9–12P(1) 1503.78 |
| 1494.6 | 1–7P(2) 1491.71 | 1–7P(3) 1495.22 | 11–14R(1) 1493.83 |
| 1487.1 | 1–7R(1) 1486.63 | 1–7P(1) 1489.08 | 1–7R(0) 1486.53 |
| 1460.0 | 0–6P(2) 1460.17 | 4–8R(1) 1460.77 | 0–6R(3) 1458.14 |
| 1436.2 | 3–7P(1) 1435.05 | 5–8R(1) 1436.09 | 5–8P(1) 1438.02 |
| 1401.9 | 2–6R(1) 1402.14 | 0–5P(3) 1402.66 | 2–6R(0) 1401.87 |
| 1394.8 | 0–5R(1) 1393.97 | 0–5P(1) 1396.23 | 0–5R(0) 1393.73 |
| 1374.8 | 10–9R(1) 1374.49 | 1–5P(2) 1373.66 | 10–9P(1) 1375.98 |
| 1357.5 | 4–6R(1) 1355.56 | 4–6R(2) 1357.35 | 4–6R(2) 1356.85 |
| 1344.6 | 2–5R(1) 1345.40 | 2–5R(0) 1345.04 | 7–7R(1) 1343.60 |
| 1334.5 | 0–4R(1) 1333.80 | 0–4R(0) 1333.48 | 0–4P(1) 1335.87 |
| 1324.3 | 3–5R(1) 1323.28 | 3–5R(0) 1322.80 | 3–5P(1) 1325.06 |
| 1306.0 | 9–7R(1) 1306.21 | 3–9R(1) 1305.59 | 9–7P(1) 1307.58 |
| 1277.3 | 0–3P(1) 1276.82 | 0–3R(2) 1276.33 | 0–3R(3) 1278.74 |
| 1254.8 | 1–3R(1) 1253.94 | 1–3R(0) 1253.50 | 1–3P(1) 1255.68 |
| 1199.2 | 1–2R(1) 1198.49 | 1–2R(0) 1198.01 | 1–2P(1) 1200.08 |
| 1180.6 | 2–2R(1) 1180.42 | 2–2P(1) 1181.89 | 2–2R(2) 1181.93 |
| 1162.3 | 1–4Q(1)c 1161.29 | 0–1R(1) 1162.17 | 3–2R(1) 1163.37 |
| 1145.6 | 1–1R(1) 1144.71 | 0–3Q(1)c 1145.90 | 1–1P(1) 1146.16 |
| 1134.6 | 2–1P(3) 1135.36 | 2–4Q(2)c 1133.77 | 15–5R(1) 1136.12 |
| 1128.4 | 2–1R(1) 1128.22 | 2–1R(0) 1127.68 | 2–1R(2) 1129.74 |
| 1116.0 | 1–3Q(1)c 1116.51 | 1–3R(1)c 1114.93 | 3–1R(3) 1116.66 |
7 Observational Prospects: HETE and Swift
The presence of absence of the absorption features in Table 1 will indicate whether or not GRBs occur in the vicinity of molecular gas. The present paper has carried out simulations of the effect which the optical and ultraviolet radiation from a GRB will have on nearby gas and dust, assuming that the GRB progenitor is located in a uniform molecular medium of density or . It is important to realize, however, that vibrationally-excited can be produced even if the GRB is in a low-density region, but there is molecular gas on the line-of-sight within a distance of a few parsecs from the GRB. Absorption features will be conspicuous for vibrationally-excited column densities . This will be produced provided the total column exceeds , and the GRB flash includes a flux , where of photons at . For the light curve (1), this flux occurs at a distance
| (38) |
where we have taken and . Therefore even if the GRB occurs in a low-density region, absorption by vibrationally-excited may be observable if there is a molecular cloud on the line-of-sight within pc of the GRB.
Early detection and accurate positions for GRBs will enable spectroscopic observations to be carried out while the fireball/afterglow is still bright. The High Energy Transient Explorer (HETE) is expected to provide rapid positions so that early ground-based observations may be possible for some GRBs. This may make allow ground-based telescopes to obtain spectra of the afterglow for afterglows at where the region is redshifted into the U band. For redshift , the entire spectrum would be observable from the ground with silicon CCD detectors.
The Swift Gamma Ray Burst Explorer mission, scheduled to be launched in 2003, is expected to return positions within seconds for 1000 GRBs over its 3 year mission. The UltraViolet and Optical Telescope on Swift will image 300 GRBs within 70 sec of the burst, with 6500–1700 wavelength coverage. For the brightest bursts, observations through a grism can be made, yielding a –400 spectrum over the 6500–1700 spectral range (Roming 2001). The UV sensitivity means that rest wavelengths 1705 – 1600 (a range which includes 6 of the absorption features in Table 1) could be observed for GRBs at redshifts . For GRBs at , the UVOT spectral range will include the entire 1705–1110 range where absorptions lines from vibrationally-excited are conspicuous.
8 Summary
The luminous optical transient associated with at least some GRBs will have drastic effects on surrounding molecular gas and dust, if the GRB is situated within a molecular cloud. To illustrate the effects, we have adopted a model light curve for the optical transient, and have considered power-law spectra and . We have calculated the resulting photoioinization and photodissociation of the surrounding gas, and thermal sublimation of the dust, for two values of the gas density, and . Our principal results are as follows:
-
1.
Dust will be destroyed out to distances in clouds of density , confirming earlier estimates by WD00.
-
2.
The ionization and dissociation fronts are merged for spectra and . The destruction of the is therefore due in part to photodissociation, and in part to photoionization.
-
3.
As proposed by Draine (2000), a substantial column density of vibrationally-excited is created as long as the ionization-dissociation front has not broken out of the molecular cloud. This vibrationally-excited will produce strong absorption lines in the region where normally Lyman- would be the only strong absorption line.
-
4.
Spectra of GRB optical transients and afterglows should be compared to the predicted absorption spectra shown in Figs. 9 – 11. Even if the signal-to-noise ratio does not permit detection of individual features, cross-correlation may make it possible to detect the ensemble of lines between 1650 and 1110Å. Detection of such absorption by vibrationally-excited would be unequivocal evidence for association of the GRB with molecular gas. The UVOT grism on the Swift Gamma Ray Burst Explorer mission may be able to measure these features in the spectra of the brighter GRBs at redshift .
References
- Abgrall et al. (1993a) Abgrall, H, Roueff, E., Launay, F., Roncin, J.-Y., & Subtil, J.-L. 1993a, A&AS, 101, 273
- (2) Abgrall, H, Roueff, E., Launay, F., Roncin, J.-Y., & Subtil, J.-L. 1993b, A&AS, 101, 323
- Akerlof et al. (1999) Akerlof, C.W., Balsano, R., Barthelmy, S. et al. 1999, Nature, 398, 400
- Bates & Öpik (1968) Bates, D.R., & Öpik, U. 1968, J. Phys. B, 1, 543
- Black & Dalgarno (1976) Black, J., & Dalgarno, A. 1976, ApJ, 203, 132
- Black & van Dishoeck (1987) Black, J., & van Dishoeck, E. 1987, ApJ, 322, 412
- Bloom et al. (1999) Bloom, J.S., Kulkarni, S.R., Djorgovski, S.G., et al. 1999, Nature, 401, 453
- Böttcher et al.. (1999) Böttcher, M., Dermer, C.D., & Liang, E.P. 1999, A&AS, 138, 343
- Dalgarno et al.. (1970) Dalgarno, A., Herzberg, G., & Stephens, T.L. 1970, ApJ, 162, L49
- Draine, B.T. (2000) Draine, B.T. 2000, ApJ, 532, 273
- Draine & Bertoldi (1996) Draine, B.T., & Bertoldi, F. 1996, ApJ, 468, 269
- Fruchter (1999) Fruchter, A. 1999, ApJL, 512, L1
- Fruchter, Krolik, & Rhoads (2001) Fruchter, A., Krolik, J.H., & Rhoads, J.E. 2001, ApJ, accepted [astro-ph/0106343]
- Ghisellini et al.. (1999) Ghisellini, G., Haardt, F., Campana, S., Lazzate, D., & Covino, S. 1999, ApJ, 517, 168
- Guhathakurta & Draine (1989) Guhathakurta, P., & Draine, B.T. 1989, ApJ 345, 230
- Habing (1968) Habing, H.J. 1968, Bull. Astron. Inst. Netherlands, 19, 421
- Israel et al.. (1999) Israel, G.L., Marconi, G., Covino, S., et al. 1999, A&A, 348, L51
- Jansen et al.. (1995) Jansen, D.J., van Dishoeck, E.F., Black, J.H., Spaans, M., & Sosin, C. 1995, A&A, 302, 223
- Lazzati etal (2001) Lazzati, D., Covino, S., & Ghisellini, G. 2001, MNRAS, submitted [astro-ph/0011443]
- Lazzati etal (2001) Lazzati, D., Perna, R., & Loeb, A. 2001, MNRAS, submitted [astro-ph/0106202]
- Lee etal (2001) Lee, B.C., et al. (2001), ApJ, accepted [astro-ph/0104201v2]
- MacFadyen etal (1999) MacFadyen, A.I., Woosley, S.E., & Heger, A. 2001, ApJ, 550, 410
- Masetti etal (2001) Masetti, N., et al. (2001), A&A, accepted [astro-ph/0103296v2]
- Osterbrock (1989) Osterbrock, D. E. 1989, Astrophysics of Gaseous Nebulae (Mill Valley: University Science Books)
- Paczyński (1998) Paczyński, B. 1998, ApJ, 494, L45
- Paczyński (1999) Paczyński, B. 1999, in The Largest Explosions Since the Big Bang: Supernovae and Gamma Ray Bursts, eds. M. Livio, K. Sahu, & N. Panagia (Cambridge: Cambridge Univ. Press), in press [astro-ph/9909048v2]
- Perna & Loeb (1998) Perna, R., & Loeb, A. 1998, ApJ, 501, 467
- Ramirez-Ruiz, E. etal (2001) Ramirez-Ruiz, E., Trentham, W., & Blain, A.W. 2001, MNRAS, submitted [astro-ph/0103239]
- Rodgers & Williams (1974) Rodgers, C.D., & Williams, A.P. 1974, J. Quant. Spectrosc. Radiat. Transfer, 14, 319
- Roming (2001) Roming, P. 2001, Swift Specification for the Ultra Violet Optical Telescope, SWIFT-UVOT-002-R00, http://www.swift.psu.edu/uvot/doc/index.html
- Roueff (1993) Roueff, E., private communication
- Smith & Dwek (1998) Smith, R.K., & Dwek, E. 1998, ApJ, 503, 831
- Stanek et al.. (1999) Stanek, K.Z, Garnavich, P.M., Kaluzny, J., Pych, W., & Thompson, I. 1999, ApJ, 522, L39
- Stanek et al.. (2001) Stanek, K.Z, et al. (2001), submitted to ApJ (Letters) [astro-ph/0104329v1]
- Stephens & Dalgarno (1973) Stephens, T.L., & Dalgarno, A. 1973, ApJ, 186, 165
- Sternberg (1988) Sternberg, A. 1988, ApJ, 332, 400
- Sternberg (1989) Sternberg, A. 1989, ApJ, 347, 863
- von Busch & Dunn (1972) von Busch, F., & Dunn, G.H. 1972, Phys. Rev. A5, 1726
- Vreeswijk et al.. (1999a) Vreeswijk, P.M., Galama, T.J., Rol, E., et al., 1999a, GCN Circ. 310
- Vreeswijk et al.. (1999b) Vreeswijk, P.M., Galama, T.J., Rol, E., et al., 1999a, GCN Circ. 324
- Waxman & Draine (2000) Waxman, E.,& Draine, B.T., 2000, ApJ, 537, 796
- Williams et al (1999) Williams, G.G., Hartmann, D.H., Park, H.S., et al. 1999, astro-ph/9912402
- Yan, Sadeghpur, & Dalgarno (1998) Yan, M., Sadeghpour, H.R., & Dalgarno, A. 1998, ApJ, 496, 1044