Mapping Metal–Enriched High Velocity Clouds to Very Low H i Column Densities
Abstract
Our galaxy is the nearest known quasar absorption line system, and it uniquely provides us with an opportunity to probe multiple lines of sight through the same galaxy. This is essential for our interpretations of the complex kinematic profiles seen in the Mgii absorption due to lines of sight through intermediate redshift galaxies. The Milky Way halo has never been probed for high velocity clouds below the -cm detection threshold of cm-2. Through a survey of Mgii absorption looking toward the brightest AGNs and quasars, it will be possible to reach down a few orders of magnitude in Hi column density. The analogs to the high velocity components of the Mgii absorption profiles due to intermediate redshift galaxies should be seen. We describe a program we are undertaking, and present some preliminary findings.
The Pennsylvania State University
1. Introduction
Absorption lines in quasars provide a sensitive probe of the ionization, chemical, and kinematic conditions in galaxies. To date, the Mgii doublet is most noted as being associated with galaxies (e.g. Bergeron & Boissé 1991; Steidel, Dickinson, & Persson 1994) and is the most well studied at resolutions where the kinematics can be resolved within the galaxy “halos” themselves (e.g. Churchill, Steidel, & Vogt 1996; Churchill et al. 2000a; Churchill et al. 2000b).
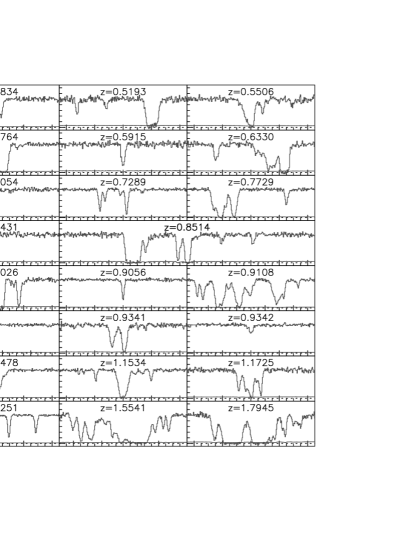
In a study of the kinematics, Churchill & Vogt (2001) have shown that most all Mgii systems exhibit low column density, high velocity “subsystems”. An example of these systems in shown in Figure 1. As can be seen, there are a significant number of subsystems with velocities in excess of 100 km s-1 from the strongest, or dominant, subsystem. A detailed study of the complex system at in the spectrum of PG 1206+459 has revealed that these subsystems have neutral hydrogen column densities of cm-2 (Churchill & Charlton 1999).
In this contribution, we argue that Mgii absorption line data through the extended regions of the Galaxy, in as many directions as feasible, are requisite for “calibrating” the signatures of the various physical processes that give rise to complex Mgii gas kinematics observed at large galactocentric distances around intermediate redshift galaxies. E230M/STIS, high–resolution spectra of Mgii along extragalactic lines of sight through the Galactic halo would provide a sizable, uniform, database with which we could search for Mgii absorption selected high–velocity clouds (HVC) in the Galaxy and Local Group. This would allow us to map the sky distribution of HVCs to Hi column densities three decades below present limits.
2. HVCs: What are They?
The intermediate redshift data, because they allow a larger scale perspective of the spatial and kinematic distribution of gas around galaxies provide statistical constraints on Galaxy data. For example, the nature, origin, and evolutionary role of the high–velocity clouds (HVCs, gas clouds that depart from galactic rotation by more than 100 km s-1) surrounding the Galaxy remain elusive and are a matter of current debate (Blitz et al. 1999; Braun & Burton 1999; Charlton, Churchill, & Rigby 2000). It is believed that their role is central to the cosmic evolution of galaxies and possibly to galaxy groups in general, but locally it still remains uncertain whether they are strictly a Galactic phenomenon or if a substantial number are deployed throughout the Local Group. Using the statistics from intermediate redshift Mgii absorption systems, Charlton et al. showed that HVC–like material is probably not distributed uniformly throughout galaxy groups.
From the study of quasar absorption lines, we know more globally about the extended spatial and kinematic distributions of metal–enriched, low ionization, low Hi column density ( cm-2) gas in intermediate redshift () galaxies than we do about the Galaxy or Local Group. For historical reasons, apart from a very few works (e.g. Bowen, Blades, & Pettini 1995; Savage, Sembach, & Lu 1997; Savage et al. 2000), quasar absorption line studies of the outer regions of the Galaxy have been limited mostly to low resolution spectra, which do not reveal cloud–cloud velocity splittings and column densities. This is because the key transitions for study, such as the Mgii doublet, are in the Near UV (NUV).
At intermediate redshift the transitions are observed in the optical, where large aperture ground based telescopes with high resolution spectrographs are a powerful resource and where high–flux quasar are available for study. Thus, a sizable, uniform database has been acquired from which case–by–case studies and overall statistics can be compiled (Churchill & Vogt 2001).
Most absorbers are characterized by a dominant kinematic subsystem with Å and velocity spreads ranging from to km s-1 in proportion to the system equivalent width. Weak, narrow, “high velocity clouds” are observed in almost every intermediate redshift Mgii absorber, and these are inferred to have cm-2 (Churchill & Charlton 1999). Weak subsystems are asymmetrically distributed in velocity such that they are either all blueshifted or all redshifted with respect to the dominant subsystem. This implies, that although the “kinematic morphologies” vary greatly on a case–by–case basis, a given line of sight is apparently probing a well defined spatial and kinematic structure.

In Figure 2, we show the rest–frame equivalent widths (panel a) and the velocity widths (panel b) of the kinematic subsystems. The velocity zero points are given by the optical depth mean of the profiles, which lie within the dominant subsystem (open triangles). Almost all of the smaller subsystems have equivalent widths less than 0.3 Å. Note that the velocities extend out to 400 km s-1 and have very narrow velocity widths. These weak, narrow clouds have remarkable properties. They are often rich in Feii absorption, have very–near solar metallicities, densities of cm-3, sizes of 10s of parsecs, and total gas masses of 10s of solar masses (see Rigby , Charlton, & Churchill 2001).
Based upon line–of–sight number densities, these small subsystems are inferred to outnumber galaxies by a factor of a million to one (Churchill et al. 1999; Rigby et al. 2001; Charlton, these proceedings). Furthermore, the equivalent width distribution has a cut off below Å (Churchill & Vogt 2000), implying a paucity of clouds with smaller than cm-2. It would be interesting to see if this cut off is present in the Galaxy. An examination of cloud destruction mechanisms reveals that that each mechanism (Rayleigh–Taylor instability, cloud–cloud collisions, Kelvin–Helmholtz instability, and cloud evaporation or condensation) favors longer lifetimes for small clouds in smaller mass halos and at large galactocentric distances. This by no means explains the differences in the equivalent width distribution of moderate and high velocity subsystems and weak systems for small . However, it is suggestive that small clouds are less favored in larger mass halos. Of course, this assumes the ionization conditions and/or metallicities do not systematically vary between weak systems and weak subsystems. As stated above, current evidence is that they do not.
These results implies a huge population around galaxies of low–mass, low–ionization, small, high–velocity clouds that have been enriched by late stages of star formation.
3. The Untapped Galactic Rosetta Stone and HVCs
The sky locations and kinematics of Galactic HVCs remain limited to higher Hi column density, cm-2, based upon 21–cm emission sensitivity limitations. This limits knowledge of the mass function to greater than M⊙. Wakker & van Woerden (1997) extrapolated the 21–cm maps and concluded that the sky covering factor of HVCs with cm-2 is 30–60%. It has required Herculean feats to probe further down the mass function, with only limited success; it still remains unknown whether the mass function rises with decreasing mass or is flat (however, see other contributions to these proceedings). This has profound implications for understanding if known HVCs represent the tip of the high–mass “ice–berg” of a heretofore invisible reservoir of metal–enriched gas clouds and for understanding their origin and role in Galactic and/or Local Group evolution.

For the Galaxy, HST is required for the NUV. The problem has been that the photon collecting power of HST has limited the number of quasars for which high–resolution spectroscopy can be acquired to the few very brightest in order to avoid large amounts of telescope time. This means we currently have no uniform, statistical database nor knowledge of whether counterparts to the intermediate, low , narrow high–velocity clouds are present in the outer regions of the Galaxy. The irony of all this is that detailed knowledge of low column density gas around the Galaxy is the key to interpreting the intermediate redshift data. The Galaxy is literally the “Rosetta Stone” of metal–line systems because proximity allows the absorption line data to be directly compared with the structures associated with the gas and the orientation of the line of sight through the Galaxy disk/halo.
4. HVC Studies… Yes. But, How to Compare to Mg II?
A great deal of effort has been directed toward understanding the kinematics, ionization and chemical conditions of HVCs using absorption lines in the spectra of halo stars and of the very brightest quasar/AGN observed from both the ground and from space (e.g. Savage & Sembach 1996, and references therein), and the results have included the dust properties, abundances, ionization conditions, kinematics (the literature is far to vast to review here). A recent interesting result, for example, is that some HVCs are composed of “cloudlets” with densities and temperatures not too dissimilar to those seen in Mgii at intermediate redshifts (Lehner et al. 1999).
The problem is that virtually none of the Galactic HVC studies can be directly compared and contrasted to the sizable intermediate redshift sample of absorption line data. From the ground, the Caii, Nai, and Tiii transitions have been observed at high resolution. Though these studies have the sensitivity to probe low column Hi, they sample the most neutral, higher density components of the gas, which are not as ionized as Mgii–selected gas clouds. Almost exclusively, absorption line studies of HVCs using HST have focused on the high ionization transitions of Civ, Nv, and Ovi.
Savage et al. (2000) published an HST Key Project (KP) search for Mgii HVC absorption along 71 extragalactic sight lines using low resolution ( km s-1) FOS/HST spectra. Though the resolution is too poor to directly resolve HVC absorption, they found 41 sight lines with Mgii HVC absorption based upon the equivalent widths and profile shapes. In Figure 3, we show the KP spectra and the Savage class, “strong”, “strong resolved”, “weak” and “weak resolved”. We include the archived FOS profiles and have determined the Savage classes for quasars that should be observed with STIS. The “resolved” profiles are expected to have strong Mgii HVC absorption. The bottom panels of Figure 3 show a direct comparison between three intermediate redshift Mgii systems (noiseless models) and how they would look as noiseless FOS spectra.
Bowen et al. (1995) have investigated high–resolution Galactic Mgii absorption along seven (7) lines of sight using GHRS. They found a Mgii HVC in only one sight line, but their detection threshold ranged from Å (). By comparison, the intermediate redshift Mgii data are sensitive to Å (). Given the power–law slope of for the equivalent width distribution of narrow, Mgii “high–velocity clouds” at intermediate redshifts (Churchill & Vogt 2001), it would not be expected for there to be a substantial number of relatively strong Mgii HVCs in the small Bowen et al. sample.
5. The Galactic Sky at High Resolution
In Figure 4, we show an Aitoff projection of the location of viable halo sight lines. They are viable in that the fluxes of the quasars or AGN are high enough that reasonable signal to noise can be obtained in a reasonable integration time with HST. The locations of the major HVCs are shown schematically. Note that the viable sight lines represent a fairly isotropic coverage of the halo, sampling both large HVC complexes and regions far from HVCs.
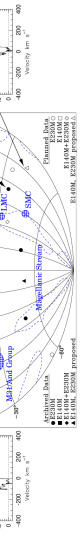
Three spectra probing Complex C are shown to the left of the Aitoff diagram. All three lines of sight are consistent with the bulk velocity of complex C (about km s-1). Note, however, the very different fine structure in the velocity and how this is different along each line of sight.
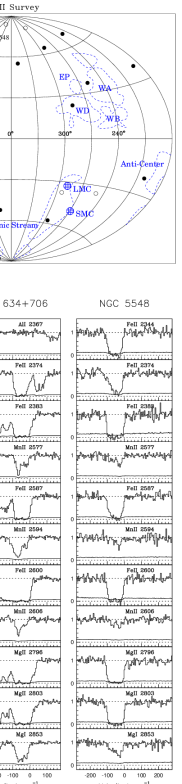
As a further example of the absorption line spectra, three systems are shown in Figure 5. Note the weak narrow cloud at km s-1 toward NGC 4151, which probes the Galactic Pole away from the large HVC complexes! In this case it is difficult to know if this Galactic in origin or intrinsic to NGC 4151, which has a very low redshift. This raises the further concern that the selected sight lines should have significant redshifts. In Figure 5, we also show the Feii, Mnii, and Mgi transitions. Feii allows confirmation of weak Mgii clouds and Mnii allows structure to be discerned in the saturated regions of Mgii and Feii so that we can Voigt profile the spectra precisely as we analyzed the intermediate redshift data (Churchill & Vogt 2001).
References
Bergeron, J., & Boissé, P. 1991, A&A, 243, 344
Bowen, D.V., Blades, J.C., & Pettini, M. 1996, ApJ, 464, 141
Blitz, L., Spergel, D.N., Teuben, P.J., Hartmann, D., & Burton, W.B. 1999, ApJ, 514, 818
Braun, R. & Burton, W.B. 1999, A&A, 341, 437
Charlton, J.C., Churchill, C.W., & Rigby, J.R. 2000, ApJ, 544, 702
Churchill, C.W., et al. 2000a, ApJS, 130, 31
Churchill, C.W., et al. 2000b, ApJ, 543, 577
Churchill, C.W., Steidel, C.C., & Vogt, S.S. 1996, ApJ, 471, 64
Churchill, C.W., & Vogt, S.S. 2001, AJ, in press
Churchill, C.W., & Charlton, J.C. 1999, AJ, 118, 59
Churchill, C.W., Rigby, J.R., Charlton, J.C., & Vogt, S.S. 1999, ApJS, 120, 51
Lehner, N., et al. 1999, A&A, 352, 257
Rigby, J.R., Charlton, J.C., Churchill, C.W. 2001, ApJ, submitted
Savage, B.D., & Sembach, K.R. 1996, ARA&A, 34, 279
Savage, B.D., Sembach, K.R., & Lu, L. 1997, AJ, 113 2158
Savage, B.D., et al. 2000, ApJS, 129, 563
Steidel, C.C., Dickinson, M., & Persson, S. E. 1994, ApJ, 437, L75
Wakker, B.P., & van Woerden, H. 1997, ARA&A, 35 414