Precise Chandra Localization of the Soft Gamma-ray Repeater SGR 180620
Abstract
We present observations of the Soft -ray Repeater SGR 180620 taken with the Chandra X-ray Observatory. We identify the X-ray counterpart of SGR 180620 based on detection of 7.5-s pulsations. Using three unrelated X-ray sources (and USNO stars) as position references, we are able to determine that the SGR is at and , with rms uncertainty of in each coordinate. We find that SGR 180620 is located within the 1- error region determined by Interplanetary Network data and is 140.5 arcsec distant from the non-thermal core of SNR G10.00.3, excluding SGR 180620 as the origin of the core. We see evidence for a significant deviation of the spin-down of SGR 180620 from its long-term trend, demonstrating erratic spin-down behavior in this source similar to that seen in other SGRs. Finally, we show that there is a broad X-ray halo surrounding SGR 180620 out to radii due to scattering in the interstellar medium.
1 Introduction
The soft -ray repeaters (SGRs; see Hurley 2000 for a recent observational review) are enigmatic sources that were discovered through their repeated bursts of hard X-rays/soft -rays. With the improvement in imaging afforded by the current generation of X-ray satellites SGRs were found to emit softer quiescent X-ray emission as well. They are generally thought to be young ( yr) neutron stars with extremely strong magnetic fields, or magnetars (e.g. Duncan & Thompson, 1992; Thompson & Duncan, 1993). This belief has been motivated by their associations with young supernova remnants (SNRs; Evans et al. 1980; Kulkarni & Frail 1993; Vasisht et al. 1994) and sites of massive star formation (Fuchs et al., 1999; Vrba et al., 2000), the energetics of their bursts (Paczyński, 1992; Thompson & Duncan, 1995), and the detection of X-ray pulsations with long (5–10 s) periods and large () spin-down rates (e.g. Kouveliotou et al., 1999).
The proposed identification of a SNR, the plerion G10.00.3, with SGR 180620 by Kulkarni & Frail (1993) played a key role in establishing the connection of SGRs with SNRs and thence young stars. This identification renewed confidence in the association of N49 with the 5 March 1979 event (SGR 052666) and motivated SNR associations for two of the remaining SGRs, SGR 1900+14 (Vasisht et al., 1994) and SGR 162741 (Hurley et al., 1999b). The association of SGR 180620 with G10.00.3 was strengthened by the discoveries of a non-thermal core in G10.00.3 (Kulkarni et al. 1994; Vasisht, Frail, & Kulkarni 1995) that changed on month to year time-scales and of a nearby luminous blue variable star (LBV; Kulkarni et al., 1995; van Kerkwijk et al., 1995). It was proposed that all of these sources were related, with the LBV as either a current or past binary companion to SGR 180620 (van Kerkwijk et al., 1995) and the variable radio source the result of episodic mass loss from SGR 180620 (Frail, Vasisht, & Kulkarni, 1997).
However, a recent moderate-precision IPN position (Hurley et al., 1999a) placed SGR 180620 outside the non-thermal core suggested by Kulkarni et al. (1994) to be the seat of the SGR. Furthermore, the association of SGR 1900+14 with SNR G42.8+0.6 was questioned (Lorimer & Xilouris, 2000). In summary, the entire issue of whether SGRs are associated with SNRs is now open to debate (see review by Gaensler et al. 2001).
The purpose of this paper is to provide an independent localization of the quiescent X-ray counterpart of SGR 180620. SNR/SGR associations are useful for establishing independent ages for SGRs; the non-thermal core to G10.00.3 provides key energetics constraints; and the LBV star hints at a binary origin and evolutionary scenario for SGR 180620. Determining whether or not these associations are true is therefore key to assessing the nature of SGR 180620.
2 Observations & Analysis
We observed SGR 180620 with the Chandra X-ray Observatory on two occasions, beginning on 2000 July 24.7 UT and 2000 August 15.7 UT, with durations of 4.9 ks and 31 ks respectively (see Table 1). Both observations were taken with the aim point on the backside-illuminated ACIS S-3 detector. The first observation was taken in the standard full-frame CCD mode with 3.24-s time resolution, while the second observation was acquired in a 1/4-subarray mode that provides increased time resolution of 0.81 s, but with a reduced field-of-view (1/4 of the full-frame area). All the data suffer from the effects of photon pile-up: % of the data from the first observation and % of the data from the second are corrupted. Pile-up occurs when “two or more photons are detected as a single event”111http://asc.harvard.edu/udocs/docs/POG/MPOG/node11.html#SECTION046160000000000000000. This results in 3 main effects: (1) the detected event has an energy that is the sum of all of the incident photon energies; (2) the count rate is diminished; and (3) the grades of the incoming photons will be altered, so that some may be cataloged as “cosmic rays” or other undesireable events and will therefore be rejected. The consequences of these effects on an observation of a bright source, in addition to modification of the spectrum, are that the spatial profile is altered, as the diminishment of the count-rate is worst for the pixels at the center of the psf, and that some regions with especially high rates of incoming photons may appear devoid of all events, as the total amplitude of the detected events exceeds the onboard energy threshold and is rejected (similar to grade migration).
Because of pile-up, especially effects (1) and (2) above, we cannot perform spectroscopy with great accuracy and we defer such analysis until tools for correcting pile-up become publicly available. As noted, pile-up will also affect the spatial profile of the source (it depresses the center of the psf relative to the wings) and the timing (two photons arriving together will be counted as one) but the analysis presented here should not be affected significantly, as we are not interested in the detailed shape of the psf within or in the exact lightcurve — overall, the position and period will be preserved.
We examined the two images and find a single bright source near the expected location of the SGR. This source is consistent with an unresolved point source (Gaussian ; Marshall et al. 2001). In order to determine if this source is indeed the SGR, we searched for the expected 7-s pulsations (Kouveliotou et al., 1998). We first barycentered the data using the axBary software. The 5-ks observation had too few photons to detect anything, and it was taken with 3.24 s time resolution. The 31-ks data had sufficient photons and was taken in the 1/4 subarray mode, which gives 0.81 s sampling. We therefore added a random number to the time-of-arrival values to eliminate any effects of sampling. We then performed a test (de Jager, Raubenheimer, & Swanepoel, 1989) on the 31-ks data, and find a very significant periodicity at s. To refine this measurement, we performed a phase connection of the Chandra data in the manner of Fox et al. (2001). We connected four segments of -s, each of which had been binned to 1-s resolution (appropriate for the 0.8-s sampling). We find, referenced to MJD 51772.0 (TDB), a phase of cycles, a period s, and a period derivative at 90% confidence. The pulsations have a sinusoidal profile and a rms pulsed fraction of % — a folded pulse profile is shown in Figure 1.
Although the count-rate and spectrum from our observations are uncertain due to pile-up, we can roughly estimate the source flux through use of previously published spectra for SGR 180620 (Mereghetti et al., 2000). With the count-rate from the 31-ks observation (the least corrupted), we see 0.5–10 keV fluxes of (absorbed) and (unabsorbed). These values are entirely compatible with the 2–10 keV fluxes found by Mereghetti et al. (2000). The observed count-rates are constant throughout the observations.
Given the 0.81-s sampling and the presence of pile-up, it is not surprising that we do not see any significant bursts of the type typically seen during observations of SGRs (e.g. Fox et al., 2001). We note that it is likely any bursts during this observation were probably not recorded due to pile-up and to on-board/post-processing rejection of anomalous events.
2.1 Localization
To accurately localize SGR 180620, we measured its position in both Chandra datasets. The measured positions from the two observations are consistent to , suggesting that the stochastic position errors are minimal. There may however be systematic errors on the order of due to overall uncertainties in the CXO aspect solutions.
To correct for such errors we searched the Chandra images for background sources to use as position references. We found seven weak sources in the 5-ks image. None had a match in the SIMBAD database, but two sources (detected at 2.5- confidence) were coincident with stars. In the 31-ks image we found 11 sources, two of which had matches in the USNO-A2.0 catalog: one detected at 4- confidence that was also in the 5-ks image, the other detected at 2.5- confidence. We summarize the X-ray detected USNO stars in Table 2. There are in this region, giving chance coincidence rates of % between an individual X-ray source and a USNO star, supporting our identifications. We are pursuing photometric and spectroscopic observations of these stars that should allow us to classify them and verify these identifications (e.g. van den Berg & Verbunt, 2001).
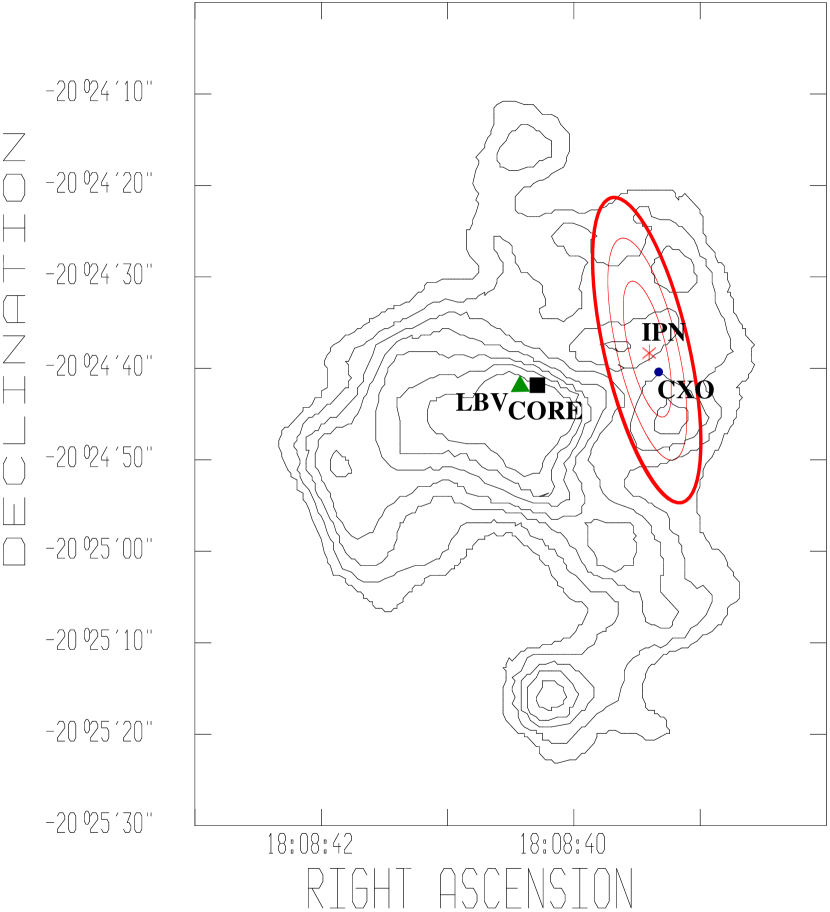
Using the USNO stars to derive offsets for the astrometry, we find corrections of and , consistent between both Chandra images and comparable in magnitude to the expected aspect uncertainties222http://asc.harvard.edu/mta/ASPECT/celmon/. We find a corrected position for SGR 180620 of and . This position has rms uncertainties of in each coordinate (from centroiding the X-ray sources and intrinsic USNO uncertainties of ; Deutsch 1999), but should be free from systematic uncertainties.
2.2 Extended Emission
X-rays are scattered by dust grains in the interstellar medium and one expects to see halos of size 0.1–100 arcmin towards objects with hydrogen column density of or greater (i.e., Overbeck, 1965; Predehl & Schmitt, 1995). This issue was first discussed by Overbeck (1965) and the Einstein Observatory found the first such halos (Rolf, 1983; Catura, 1983). The most comprehensive work to date has been carried out by Predehl and associates using the ROSAT Observatory (Predehl & Schmitt, 1995).
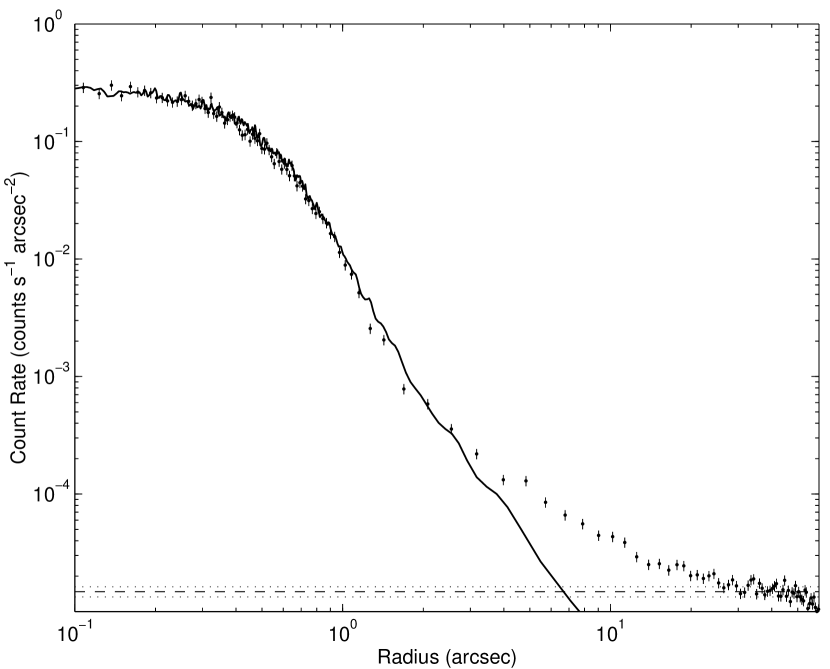
The recent interest of scattering halos around SGRs has been motivated by the discovery of such a halo around SGR 1900+14 (Kouveliotou et al., 2001). As with SGR 1900+14, one expects an X-ray halo around SGR 180620 from scattering off dust. We therefore examined the radial profile of SGR 180620 from the 31-ks observation for better signal-to-noise. In Figure 3, we show the radial profile of SGR 180620 from this observation along with the profile from a MARX333http://space.mit.edu/ASC/MARX/ simulation (using the spectrum for SGR 180620 from Mereghetti et al. 2000) scaled to the same normalization for the inner portion (cf. Kouveliotou et al., 2001); such simulations should be accurate out to radii of a few arcminutes444http://asc.harvard.edu/cal/Hrma/hrma/psf/psfwings/psfwings.html. The background was measured from the ACIS S-3 chip far () from the SGR 180620, and includes both instrumental and unresolved-source contributions. We corrected the background estimate to with a MARX simulation of the ACIS S-3 response to account for vignetting etc. We find the variation in radial response to be small for , and therefore show a constant background in Figure 3. One sees very good agreement between the data and the model at small radii, showing that pile-up has not substantially corrupted the radial profile of this observation (the model did not incorporate pile-up, as MARX does not correctly simulate the back-illuminated CCDs). But there is a clear deviation from the model psf at large radii () that we believe to be indicative of a dust halo contributing % to the total X-ray flux. To verify this interpretation we examined the radial profile as a function of the phase of the SGR 180620. The profile for the portion of the period when SGR 180620 is “ON” has of course more counts at small radii than the profile when SGR 180620 is “OFF.” However, the outer portion () that we identify as the halo is identical between “ON” and “OFF”, indicating that the pulsations of SGR 180620 are smeared out in the halo. This suggests that the extended emission is not an instrumental property, as scattering wings or something similar would scale with the immediate flux of the source instead of averaging over time as observed here. We note, though, that while the data do show a slight softening towards higher radii (as expected from the dependence of the scattering cross-section; e.g. Predehl et al. 2000), we cannot determine in detail how the halo profile changes with energy. This could be due to the relatively hard spectrum of SGR 180620, so that the cross section does not vary much over the energy range for which there are significant counts (2–6 keV). It could also be an effect of poor statistics, where a longer observation would show an energy dependent halo. Regardless, we must caution the reader as to this interpretation of the extended emission.
3 Discussion
The X-ray position of SGR 180620 is now without doubt incompatible with the positions of both the non-thermal core of G10.00.3 and the LBV star, although those two positions still agree to . We therefore follow Hurley et al. (1999a) and Gaensler et al. (2001) in suggesting that the LBV, not SGR 180620, powers the core of G10.00.3. As outlined in Hurley et al. (1999a) the LBV can easily explain the energetics and changing morphology of the non-thermal core. SGR 180620 could still be associated with G10.00.3 as a whole, although this is unlikely given the proximities of the core and the LBV to the center of G10.00.3.
However, we still have a remarkable coincidence: within a circle in radius ( pc at 14.5 kpc distance; Corbel et al. 1997), we have an SGR (SGR 180620), an LBV, and a massive star cluster (Fuchs et al., 1999). All three of these objects are exceedingly rare. In addition, there is a SNR555Although Gaensler et al. (2001) have argued that G10.00.3 is not a SNR. at the same position. While it is hard to draw quantitative conclusions from this coincidence since none of the objects involved have well-defined populations and this region of the sky has been studied in great depth, it is still noteworthy. Individual distances to these sources are not known, but it is plausible that they are all 14.5 kpc away (Corbel et al., 1997; Fuchs et al., 1999). We believe that even if SGR 180620 is not directly associated with the LBV or G10.00.3, it was likely born in the same cluster, which requires that the progenitor of SGR 180620 was quite massive to have had a supernova before the LBV or the stars in the cluster (as noted by Hurley et al. 1999a). Perhaps this is a case of an extremely high-mass star () forming a neutron star due to large mass loss over its lifetime (Fryer & Kalogera, 2001)? Alternatively, the sources could all have originated in the same molecular cloud, but the supernova from SGR 180620 could have triggered the star formation that lead to the LBV and the cluster.
The angular scale where the scattering halo departs from the psf is smaller than that seen for ROSAT data, and we do not measure the halo out to such large radii, so the relations presented for ROSAT data by Predehl & Schmitt (1995) are not directly applicable. However, we can correct the relation between fractional halo intensity and hydrogen column density from Predehl & Schmitt (1995) to the appropriate energy and angular scale range for our data, and we find an expected halo intensity of % based on the , as determined by Mereghetti et al. (2000). This is very similar to the measured intensity, supporting the conclusion that we see a halo and not an instrumental artifact, and implying that the size distribution of the scattering grains at small angular scales is similar to that seen for the larger ROSAT halos.
The halo we see is very similar (in angular scale and fractional intensity) to that seen for SGR 1900+14 (Kouveliotou et al., 2001), suggesting that they lie behind similar dust columns (or possibly that both “halos” are in fact instrumental effects). As with SGR 1900+14, the pulsations of SGR 180620 are too smeared out in the halo to use them to determine a geometric distance (cf. Trümper & Schönfelder, 1973; Predehl et al., 2000). However, if observations were made of SGR 180620 soon ( hours to days) after a significant change in the level of its emission (e.g. following a giant flare) such that the change was visible in the halo, a distance determination could be made. BeppoSAX is probably the only current satellite that has the necessary slew capabilities coupled with spatial resolution and soft-energy response to perform these observations.
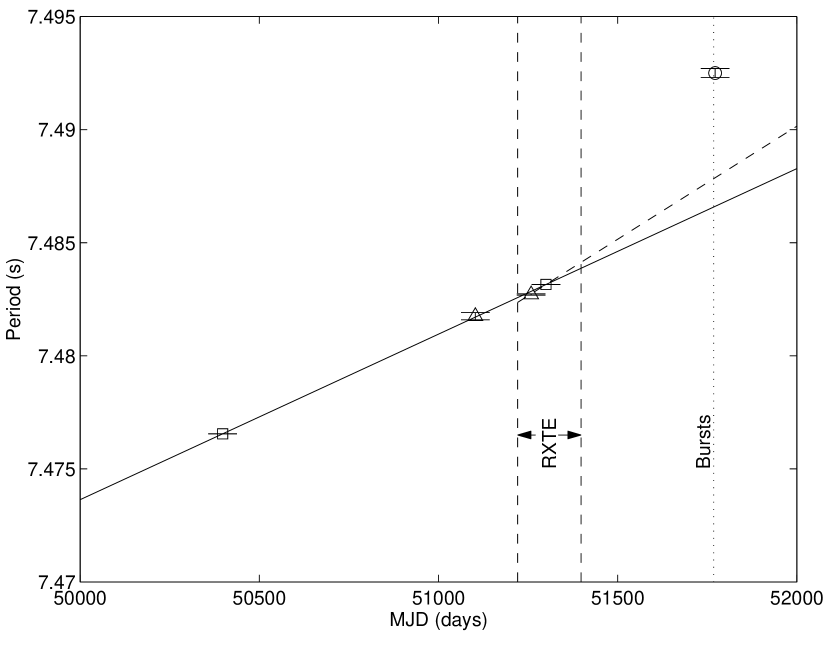
The measured period of SGR 180620 is not consistent with either its long-term spin-down (Woods et al., 2000; Mereghetti et al., 2000) or the newer spin-down measured from phase-connected RXTE observations (Woods et al., 2000), as seen in Figure 4. While SGR 180620 exhibits substantial timing noise (Woods et al., 2000), the long-term trend was generally stable for a number of years. However, Woods et al. (2000) found that at a single epoch the instantaneous spin-down rate for SGR 180620 was higher by a factor of 1.5 that the global trend, and to account for the new Chandra data, the spin-down rate must have increased even more. Between the last RXTE measurement from Woods et al. (2000) and our measurement, the average spin-down rate is , which is a factor of 2 higher than the largest previously measured for this source. This change is similar to the large change in both spin period and spin-down rate seen for SGR 1900+14 following its activation during 1998 August (Marsden, Rothschild, & Lingenfelter 1999; Woods et al. 1999) and for the anomalous X-ray pulsar 1E 1048.15937 (Kaspi et al., 2000). SGR 180620 must have either increased its long-term spin-down substantially or suffered from a momentary large change in spin-down. Such sudden changes in spin-down are capable of being produced within the magnetar framework (Thompson et al., 2000), either due to particle outflows or due to re-alignment of the neutron star crust, but they are typically assumed to be episodic and triggered by bursting or flaring activity (Woods et al., 1999; Thompson et al., 2000). We note that Göğüş et al. (2000) did observe a period of moderate burst activity for SGR 180620 several days before the 31-ks Chandra observation, but this was too close to the Chandra observation to have affected the spin-period significantly. Whether sudden or gradual, the change in rotation for SGR 180620 had to start before the bursts observed by Göğüş et al. (2000) (unless the spin-down is orders of magnitude larger than previously seen), so these changes were not caused by burst activity. This suggests that the more gradual change is the correct mechanism in this case, perhaps due to continuing plastic deformation of the crust (e.g. Thompson et al., 2000). In addition, spin-down cannot be used to determine the ages or magnetic fields of any SGR in the manner typical for radio pulsars (e.g. Manchester & Taylor, 1977), as noted by Thompson et al. (2000). We must instead rely upon arguments relating to the super-Eddington bursts (Thompson & Duncan, 1995), global energetics, and similar phenomena as indicators of the magnetar-like fields of these objects.
4 Conclusions
We have confirmed the position of Hurley et al. (1999a) for SGR 180620, and determined that it is near neither the non-thermal core of G10.00.3 (Frail et al., 1997) nor the luminous blue variable star (LBV; van Kerkwijk et al., 1995), although those two sources may be associated. Through comparison of the radial profile of SGR 180620 to a model psf, we see evidence for a broad X-ray scattering halo. Given its violent nature, SGR 180620 may produce changes in its X-ray emission such that observations of this halo could lead to a geometric distance determination, thereby fixing the luminosity scale of SGRs and locating SGR 180620 in three dimensions relative to the massive star cluster (Fuchs et al., 1999), the LBV, and other nearby objects.
Timing analysis of the Chandra data show that SGR 180620 is not continuing its long-term trend of spin-down that it has followed for the past 4 years. This is similar to changes in spin-down observed for SGR 1900+14 following the 1998 August outbursts, although only minor bursts were observed for SGR 180620 around the time of these observations and these bursts are unlikely to have been responsible for the deviation from normal spin-down.
References
- Catura (1983) Catura, R. C. 1983, ApJ, 275, 645
- Corbel et al. (1997) Corbel, S., Wallyn, P., Dame, T. M., Durouchoux, P., Mahoney, W. A., Vilhu, O., & Grindlay, J. E. 1997, ApJ, 478, 624
- de Jager et al. (1989) de Jager, O. C., Raubenheimer, B. C., & Swanepoel, J. W. H. 1989, A&A, 221, 180
- Deutsch (1999) Deutsch, E. W. 1999, AJ, 118, 1882
- Duncan & Thompson (1992) Duncan, R. C. & Thompson, C. 1992, ApJ, 392, L9
- Evans et al. (1980) Evans, W. D., Klebesadel, R. W., Laros, J. G., Cline, T. L., Desai, U. D., Teegarden, B. J., Pizzichini, G., Hurley, K., et al. 1980, ApJ, 237, L7
- Fox et al. (2001) Fox, D. W., Kaplan, D. L., Kulkarni, S. R., & Frail, D. A. 2001, ApJ, submitted (astro-ph/0107520)
- Frail et al. (1997) Frail, D. A., Vasisht, G., & Kulkarni, S. R. 1997, ApJ, 480, L129
- Fryer & Kalogera (2001) Fryer, C. L. & Kalogera, V. 2001, ApJ, 554, 548
- Fuchs et al. (1999) Fuchs, Y., Mirabel, F., Chaty, S., Claret, A., Cesarsky, C. J., & Cesarsky, D. A. 1999, A&A, 350, 891
- Gaensler et al. (2001) Gaensler, B. M., Slane, P. O., Gotthelf, E. V., & Vasisht, G. 2001, ApJ, accepted (astro-ph/0104228)
- Göğüş et al. (2000) Göğüş, E. et al. 2000, GCN 775
- Hurley (2000) Hurley, K. 2000, in Gamma-Ray Bursts: 5th Huntsville Symposium, ed. R. M. Kippen, R. S. Mallozi, & G. J. Fishman, 763 (astro-ph/9912061)
- Hurley et al. (1999a) Hurley, K., Kouveliotou, C., Cline, T., Mazets, E., Golenetskii, S., Frederiks, D. D., & van Paradijs, J. 1999a, ApJ, 523, L37
- Hurley et al. (1999b) Hurley, K., Kouveliotou, C., Woods, P., Mazets, E., Golenetskii, S., Frederiks, D. D., Cline, T., & van Paradijs, J. 1999b, ApJ, 519, L143
- Kaspi et al. (2000) Kaspi, V. M., Gavriil, F. P., Chakrabarty, D., Lackey, J. R., & Muno, M. P. 2000, ApJ, submitted (astro-ph/0011368)
- Kouveliotou et al. (1998) Kouveliotou, C., Dieters, S., Strohmayer, T., van Paradijs, J., Fishman, G. J., Meegan, C. A., Hurley, K., Kommers, J., et al. 1998, Nature, 393, 235
- Kouveliotou et al. (1999) Kouveliotou, C., Strohmayer, T., Hurley, K., van Paradijs, J., Finger, M. H., Dieters, S., Woods, P., Thompson, C., et al. 1999, ApJ, 510, L115
- Kouveliotou et al. (2001) Kouveliotou, C., Tennant, A., Woods, P. M., Weisskopf, M. C., Hurley, K., Fender, R. P., Garrington, S., Patel, S. K., et al. 2001, ApJ, 558, L47
- Kulkarni & Frail (1993) Kulkarni, S. R. & Frail, D. A. 1993, Nature, 365, 33
- Kulkarni et al. (1994) Kulkarni, S. R., Frail, D. A., Kassim, N. E., Murakami, T., & Vasisht, G. 1994, Nature, 368, 129
- Kulkarni et al. (1995) Kulkarni, S. R., Matthews, K., Neugebauer, G., Reid, I. N., van Kerkwijk, M. H., & Vasisht, G. 1995, ApJ, 440, L61
- Lorimer & Xilouris (2000) Lorimer, D. R. & Xilouris, K. M. 2000, ApJ, 545, 385
- Manchester & Taylor (1977) Manchester, R. N. & Taylor, J. H. 1977, Pulsars (San Francisco : W. H. Freeman, c1977.)
- Marsden et al. (1999) Marsden, D., Rothschild, R. E., & Lingenfelter, R. E. 1999, ApJ, 520, L107
- Marshall et al. (2001) Marshall, H. L., Rutledge, R., Fox, D. W., Miller, J. M., Guerriero, R., Morgan, E., van der Klis, M., Bildsten, L., et al. 2001, AJ, 122, 21
- Mereghetti et al. (2000) Mereghetti, S., Cremonesi, D., Feroci, M., & Tavani, M. 2000, A&A, 361, 240
- Overbeck (1965) Overbeck, J. W. 1965, ApJ, 141, 864
- Paczyński (1992) Paczyński, B. 1992, Acta Astronomica, 42, 145
- Predehl et al. (2000) Predehl, P., Burwitz, V., Paerels, F., & Trümper, J. 2000, A&A, 357, L25
- Predehl & Schmitt (1995) Predehl, P. & Schmitt, J. H. M. M. 1995, A&A, 293, 889
- Rolf (1983) Rolf, D. P. 1983, Nature, 302, 46
- Thompson & Duncan (1993) Thompson, C. & Duncan, R. C. 1993, ApJ, 408, 194
- Thompson & Duncan (1995) —. 1995, MNRAS, 275, 255
- Thompson et al. (2000) Thompson, C., Duncan, R. C., Woods, P. M., Kouveliotou, C., Finger, M. H., & van Paradijs, J. 2000, ApJ, 543, 340
- Trümper & Schönfelder (1973) Trümper, J. & Schönfelder, V. 1973, A&A, 25, 445
- van den Berg & Verbunt (2001) van den Berg, M. & Verbunt, F. 2001, A&A, 368, 569
- van Kerkwijk et al. (1995) van Kerkwijk, M. H., Kulkarni, S. R., Matthews, K., & Neugebauer, G. 1995, ApJ, 444, L33
- Vasisht et al. (1995) Vasisht, G., Frail, D. A., & Kulkarni, S. R. 1995, ApJ, 440, L65
- Vasisht et al. (1994) Vasisht, G., Kulkarni, S. R., Frail, D. A., & Greiner, J. 1994, ApJ, 431, L35
- Vrba et al. (2000) Vrba, F. J., Henden, A. A., Luginbuhl, C. B., Guetter, H. H., Hartmann, D. H., & Klose, S. 2000, ApJ, 533, L17
- Woods et al. (2000) Woods, P. M., Kouveliotou, C., Finger, M. H., Göğüş, E., Scott, D. M., Dieters, S., Thompson, C., Duncan, R. C., et al. 2000, ApJ, 535, L55
- Woods et al. (1999) Woods, P. M., Kouveliotou, C., van Paradijs, J., Briggs, M. S., Hurley, K., Göğüş , E., Preece, R. D., Giblin, T. W., et al. 1999, ApJ, 527, L47
| Date | MJD | Exposure | ACIS S-3 | TE Mode |
|---|---|---|---|---|
| of Start | (ks) | CountsaaAccepted counts (standard processing) within - radius. | ||
| 2000 Jul 24 | 51749.7 | 4.9 | 833 | normal |
| 2000 Aug 15 | 51771.8 | 31.1 | 7738 | -subarray |
| Star | X-ray Position | USNO PositionaaUncertainties on USNO positions are assumed to be rms in each coordinate. | ||||
|---|---|---|---|---|---|---|
| bbRMS uncertainty in each coordinate. | ||||||
| (arcsec) | (arcsec) | |||||
| Sources in 5-ks Image | ||||||
| A | 0.2 | 0.7 | ||||
| B | 0.3 | 1.0 | ||||
| Sources in 31-ks Image | ||||||
| B | 0.1 | 0.6 | ||||
| C | 0.3 | 0.6 | ||||