Hubble Space Telescope WFPC-2 Imaging of Cassiopeia A11affiliation: Based on observations with the NASA/ESA Hubble Space Telescope, obtained at the Space Telescope Science Institute, which is operated by the Association of Universities for Research in Astronomy, Inc. under NASA contract No. NAS5-26555.
Abstract
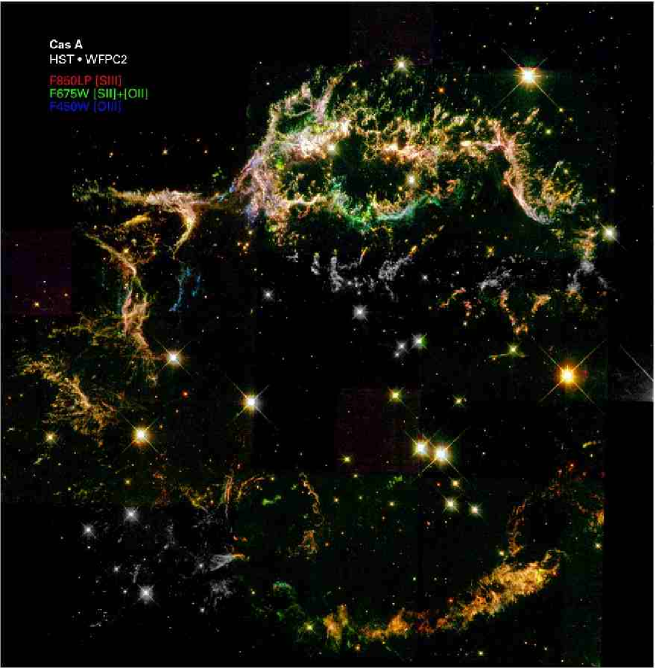
The young galactic supernova remnant Cassiopeia A was imaged with WFPC-2 aboard the Hubble Space Telescope through filters selected to capture the complete velocity range of the remnant’s main shell in several emission lines. The primary lines detected along with the specific WFPC-2 filters used were: [O III] 4959,5007 (F450W), [N II] 6583 (F658N), [S II] 6716,6731 + [O II] 7319,7330 + [O I] 6300,6364 (F675W), and [S III] 9069,9532 (F850LP). About three-quarters of the remnant’s diameter main shell was imaged with all four filters in three WFPC-2 pointings, with most remaining shell regions imaged in just the F675W filter via three additional pointings. Considerable detail is observed in the reverse-shocked ejecta with typical knot scale lengths of ( cm). Both bright and faint emission features appear highly clumped with little in the way of a smooth, diffuse emission component detected. Strong differences in [S III] and [O III] line intensities indicating chemical abundance differences are also seen, particularly in knots located along the bright northern limb and near the base of the northeast jet. A line of curved overlapping filaments in the remnant’s northwestern rim appears to mark the location of the remnant’s reverse shock front in this region. The morphology of some finger-like ejecta structures elsewhere suggest cases where the reverse shock front is encountering the remnant’s clumped ejecta. Large velocity shears (1000 km s-1) possibly associated with the formation of these Rayleigh-Taylor-like features are found in the line profiles of several emission lines (e.g., [S III] 9069,9532 and [Cl II] 8679) in ground-based, optical spectra of knots near the remnant’s center. [N II] images of the remnant’s circumstellar knots (“QSFs”) reveal them to be thick knots and filaments often with diffuse edges facing away from the center of expansion. Three color composite images of the whole remnant and certain sections along with individual filter enlargements of selected regions of the bright optical shell are presented and discussed.
1 Introduction
Cassiopeia A (Cas A; SN 1680) is currently the youngest known Galactic supernova remnant (SNR). It is also the prototype for the class of young, oxygen-rich remnants containing SN ejecta moving at several thousand km s-1 and exhibiting extreme O and Si-group (Si, S, Ar, and Ca) abundances due to explosive nuclear processing in a massive star (van den Bergh, 1988). Mass estimates for the Cas A progenitor range between 10 and 30 M☉ (Fabian et al., 1980; Jansen et al., 1988; Vink et al., 1998).
Elevated abundances of O-burning products in the remnant’s high-velocity ejecta (“fast-moving knots”;“FMKs”), the presence of much slower moving He- and N-rich clumps (“quasi-stationary flocculi”; “QSFs”) of circumstellar material (Chevalier & Kirshner 1978, 1979), together with the presence of N-rich, high-velocity outer ejecta (Fesen, Becker, & Blair, 1987; Fesen, 2001) have prompted several researchers to suggest the Cas A progenitor may have been a WN-type Wolf-Rayet star that experienced substantial mass-loss before exploding as a Type Ib/c or Type II supernova (Langer & El Eid, 1986; Schaeffer, Casse, & Cahen, 1987; Fesen & Becker, 1991; García-Segura, Langer, & Mac Low, 1996; Vink, Kaastra, & Bleeker, 1996).
Cas A’s optical nebulosity is largely confined to a spherical shell in radius and expanding at to km s-1. High-velocity, radiative ejecta filaments and FMKs — which exhibit strong O, S, and Ar lines but no H, He, or N emission — dominate the SNR’s optical structure and are mainly organized in large ring-like structures (diameters pc) situated on the surface of the expanding shell (Reed et al. 1991; Lawrence et al. 1995). Fainter optical ejecta have been found outside of the shell, mainly located in a northeast (NE) flare or “jet” of S-rich ejecta, with some 70+ other fainter knots elsewhere around the remnant’s outer periphery (see Fesen 2001 and references therein).
The remnant’s main shell of optical emission is generally believed to be reverse-shock heated knots of relatively dense ejecta lying some distance behind the outer blast wave (McKee, 1974). Strong and complex X-ray, infrared, and radio emissions are also associated with the reverse shock (e.g. Anderson et al. 1991; Lagage et al. 1996; Hughes et al. 2000). The reverse shock moving back into the ejecta arises due to the remnant’s interaction with a dense circumstellar medium (CSM) shell, and recent models can account for the observed 2000 km s-1 expansion rate seen in the radio (Chevalier & Liang, 1989; Borkowski et al., 1996). Evidence for deceleration of the main shell’s optical knots can be inferred from differences between derived explosion dates for them (A.D. 1658 3; Kamper & van den Bergh 1976a) and outer knots ahead of the primary blast wave (A.D. 1671 1; Thorstensen, Fesen, & van den Bergh 2001). However, high-resolution observational data tracing individual ejecta knot deceleration dynamics, excitation, and evolution in Cas A are still lacking.
Recent observations have begun to shed light on related dynamical processes in other young remnants. For example, Hester et al. (1996) have used Hubble Space Telescope (HST) imaging observations and numerical models to investigate the development and ionization of magnetic Rayleigh-Taylor instabilities at the interface between the pulsar-driven synchrotron nebula and a shell of swept-up ejecta in the Crab Nebula. Blair et al. (2000) have successfully modeled HST spectroscopic observations of UV/optical reverse shock emission from O-rich ejecta in the young remnants N132D and 1E0102.2–7219 in the Magellanic Clouds.
To date, the fine-scale structure of Cas A’s SN ejecta has been only moderately constrained by ground-based observations. The best published optical images show little easily discernible sub-arcsecond structure (van den Bergh & Pritchet, 1986) along the remnant’s northeast rim while radio observations at 2 cm have resolved small features in one region (Arendt & Dickel, 1987). A portion of the northeast rim of Cas A’s bright, main shell was imaged with the HST Wide Field/Planetary Camera-1 (WFPC-1) prior to this study. Two 2100 s exposures were taken using narrow [O III] 5007 and [S II] 6716,6731 filters. In spite of the aberrated point spread function of WFPC-1 and the narrow passbands of the filters, some filament details were detected in the low-velocity portions of several NE knots (Vr 2000 km s-1) not visible in the ground-based images (van den Bergh & Kamper, 1985).
Here we present the first high spatial resolution optical survey of the Cas A remnant with HST using filters that cover the remnant’s full to km s-1 expansion velocity in both intermediate- and low-ionization lines of sulfur and oxygen. These images reveal a wealth of fine-scale spatial features in the metal-rich ejecta of this 320 yr old SNR. During our discussion, we assume a distance to Cas A of 3.4 kpc (Reed et al., 1995), where cm.
2 Observations
2.1 HST Imaging
We obtained multi-band images of Cas A using the Wide Field Planetary Camera-2 (WFPC-2) aboard HST during nine orbits in January 2000. The optically bright NE, NW, and SW rims of the main shell were targeted, with each imaged in four filters. Table 1 lists the four filters used along with their full-width-at-zero-intensity (FWZI) bandpasses, exposure times used, and principal line emissions within the bandpass. Exposure times ranged from 400 s to 700 s and images were taken in pairs of two slightly offset exposures in order to facilitate removal of cosmic ray hits and dead pixels in the individual CCD images.
Because of the large expansion velocity of the remnant’s bright shell of ejecta, we employed broad rather than narrow passband WFPC-2 filters, including F450W, F675W (the HST R band), and F850LP. In addition to these, images were taken using the narrow passband F658N filter which is sensitive to the remnant’s slow-moving, [N II] 6548,6583 emitting circumstellar material. The resulting images provide a high-resolution, four-passband survey of the remnant’s major optical features for these three remnant sections. Adjacent remnant shell regions to each of the three main target positions were also obtained in just the F675W filter in order to give a more complete survey of Cas A at high resolution within the granted spacecraft time.
We selected the F450W and F850LP filters to provide a comparative [O III] versus [S III] emission survey of Cas A’s main shell. The F450W and F850LP filters effectively isolated ejecta line emissions of [O III] and [S III], respectively, while covering the full km s-1 velocity range. The WFPC-2 Instrument Handbook shows that the throughput of the F450W filter + telescope + detector system peaks near the [O III] lines and covers an [O III] radial velocity range of more than km s-1. The filter is only weakly sensitive to [O II] 3726,3729 line emission at about 10% the transmission at 5007 Å. Significant contamination from the [S II] 4068,4062 lines is unlikely since these lines are weak in most FMKs (Kirshner & Chevalier, 1977; Chevalier & Kirshner, 1979; Hurford & Fesen, 1996).
The long-pass filter F850LP (8300 – 10600 Å) was similarly chosen to isolate the remnant’s [S III] emissions. Its bandpass, together with WFPC-2 CCD sensitivity steep decline at wavelengths 9500 Å, makes it is primarily sensitive to ejecta [S III] 9069,9531 line emission, and only about 10% as sensitive to the [S II] 10290-10370 line blend. Ground-based spectra show that contributions from [Fe II] and [C I] are also likely to be small.
We chose to use the broad “R band” F675W filter (6000 – 7500 Å) for imaging lower ionization line emission features which exhibit strong lines of [O II] 7319,7330 and [S II] 6716,6731. Although this filter’s bandpass also covers the [O I] 6300,6364 and [Ar III] 7135 lines, both are much weaker than either the [O II] and [S II] lines for most filaments (Chevalier & Kirshner, 1979; Hurford & Fesen, 1996). To help discriminate O,S,Ar-rich ejecta from the [N II] 6548,6583 strong, circumstellar material (QSFs) detected in the F675W images, we also obtained separate exposures through the F658N filter.
Details of the WFPC-2 data reduction procedures we followed are described in Morse et al. (1996) and Blair et al. (2000). Using IRAF/STSDAS111IRAF is distributed by the National Optical Astronomy Observatories, which is operated by the Association of Universities for Research in Astronomy, Inc. (AURA) under cooperative agreement with the National Science Foundation. The Space Telescope Science Data Analysis System (STSDAS) is distributed by the Space Telescope Science Institute. software tasks, the pipeline-calibrated exposure pairs through each filter were carefully aligned and combined to reject cosmic rays. Stray hot and dead pixels were then flagged and corrected. We applied geometric distortion corrections to each CCD chip using the Trauger wavelength-dependent coefficients contained in the STSDAS.DITHER package and then flux calibrated using the methods described in the WFPC-2 Instrument Handbook.
Finally, we applied an extinction correction to each image, appropriate for the rest wavelength of each emission line observed, that was based on an average color excess of E(BV) (Hurford & Fesen, 1996) and the extinction curve of Cardelli, Clayton, & Mathis (1989) with RV = 3.1. The extinction across the face of Cas A is known to vary, as seen both in optical/NIR spectra (e.g. Hurford & Fesen 1996) and a neutral H column density measurement (Keohane et al., 1996). The highest neutral H column density observed is on the western limb. This region contains bright X-ray and radio emission, but very little optical emission. As a result, and because we are not making detailed abundance estimates based on the emission-line image ratios, we applied a representative extinction correction for the optically emitting filaments. However, large-scale gradients in the extinction may account for the somewhat redder appearance of the emission along the SW rim in the color composite of Figure 1.
With the cleaned, fully calibrated images in hand, a large contiguous mosaic was built from the six individual pointings through the F675W filter. These six pointings generally overlapped sufficiently to provide several stars that could be used as tie points in co-aligning adjacent exposures. Because we found that using the STSDAS task WMOSAIC yielded measurable errors in the inter-chip rotations and offsets when piecing the large mosaic together, we instead rotated each Wide Field (WF) camera chip so that North was toward the top using the astrometry information in the individual chip science headers and independently determined the inter-chip rotations and offsets. In regions of the SNR where adjacent images overlapped, the data were averaged.
After assembling the large F675W mosaic of WF chips, we then added in the Planetary Camera (PC) chip images in regions where they provided additional coverage of the SNR emissions. We de-magnified the PC pixel scale by a factor of 0.4555 to match the WF pixel scale and inserted the re-scaled PC images into their appropriate positions. Finally, we used the F675W mosaic as the common reference frame for aligning the individual chips of each F450W, F658N, and F850LP image at the three primary pointings. The resulting mosaic images, as well as some full-resolution PC frames, are discussed in Section 3.
2.2 Spectroscopy
As part of exploratory ground-based observations prior to these HST observations, low-dispersion optical spectra of several ejecta knots north of the remnant’s center were obtained in October 1998 using the Hiltner 2.4 m telescope at the MDM Observatory. A Modular Spectrograph was used together with a 600 lines mm-1 grating blazed at 5000 Å and an east-west wide slit. Several 1200 s exposures were obtained with a wavelength coverage of 6300 to 9800 Å and a spectral resolution of 7 Å. These data were reduced using standard IRAF software routines and calibrated with Hg, Ne, and Xe lamps and Massey & Gronwald (1990) standard stars.
3 Results and Discussion
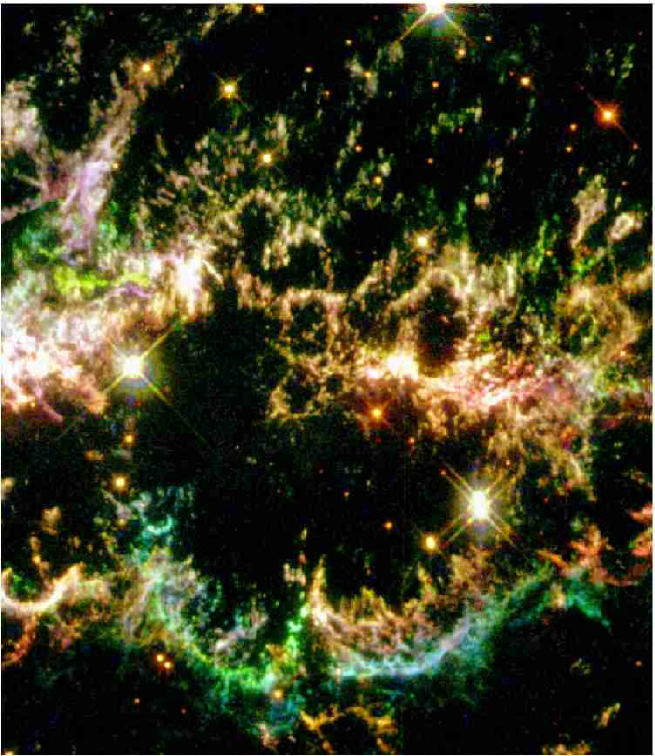
A three color composite WFPC-2 image covering most of the Cas A SNR is shown in Figure 1. The remnant’s appearance in the F850LP, F675W, and F450W images is shown in red, green, and blue, respectively. Areas which were imaged only in the F675W filter are shown in grayscale. With the exception of the westernmost portion where little optical emission is present, the WFPC-2 imaging covered Cas A’s entire bright optical shell.
The presence of line emission variability across the remnant is visible as color differences in Figure 1. Both ionization structure and chemical fractionation manifest themselves as color variations. Examples include a few blue [O III] knots along the northeast limb, a blue-green emission arc along the southern portion of the remnant’s bright northern rim, and reddish filaments and knots in the southwest. Even at the relatively low resolution of this reproduction, considerable small-scale detail can be discerned that is not visible in previous ground-based images (see false-color image in Kamper & van den Bergh 1976b).
In the following subsections, we briefly describe the remnant’s basic emission properties and structures as seen in these HST images. A more thorough investigation of the remnant’s optical properties and varying knot chemical abundances making use of spectroscopy and detailed shock modeling will be addressed in a subsequent paper.
3.1 Main Shell Structure
In the best published ground-based optical images, Cas A’s optical shell appeared composed largely of diffuse clumps and filaments (van den Bergh & Kamper 1985; van den Bergh & Pritchet 1986). However, the WFPC-2 images reveal a far more complex ejecta structure, one rich in fine-scale features. We begin our discussion by examining two of the remnant’s brightest limb regions.
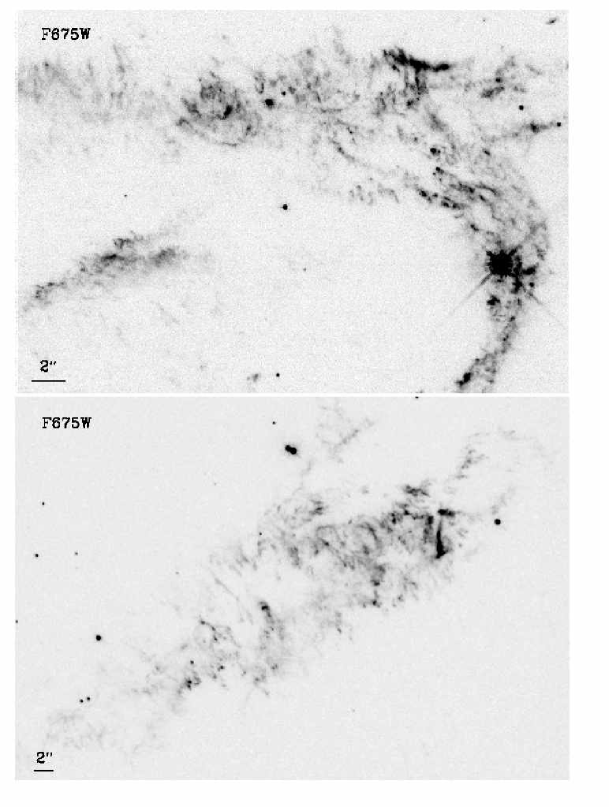
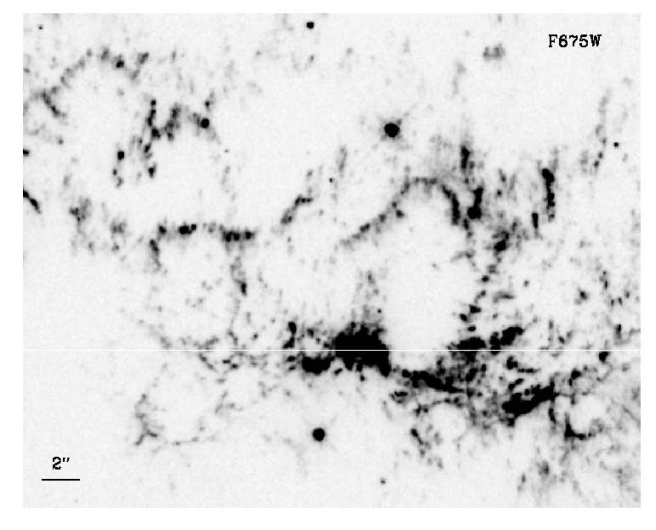
The complexity of the remnant’s optically emitting ejecta can be seen in two of the remnant’s brightest regions: the large Baade-Minkowski Filament No. 1 (Baade & Minkowski 1954) situated along the NE limb, and a large arc of nebulosity bordering the southwestern rim. Figure 2 shows enlargements of F675W filter images of both these regions. This filter is principally sensitive to relatively low ionization line emissions including [S II] 6176,6731 and [O II] 7319,7330, and the generally weaker [O I] 6300,6364. It is also sensitive to [Ar III] 7135 emission but this is typically a faint line (Kirshner & Chevalier, 1977; Chevalier & Kirshner, 1979; Winkler, Roberts, & Kirshner, 1991; Reed et al., 1995; Hurford & Fesen, 1996).
The Baade-Minkowski Filament No. 1 image (upper panel) was taken using the PC and therefore has about twice the resolution of the WF image taken of the SW rim (lower panel). Nonetheless, a wealth of detail is seen in both regions. Filament No. 1 is resolved into an array of bright knots and short filaments in size. Much of the fainter emission detected appears also to be highly clumped, with little in the way of smooth, diffuse emission present.
The same general morphology is seen in the remnant’s southwestern rim nebulosity, but with more radially oriented emission features. Again numerous small knots () are present with a clumpy, faint inter-knot background. The brightest feature is a vertical cloud structure near the western edge of the region shown. This is not SN ejecta but a clump of circumstellar mass-loss material (QSF R9; see Section 3.6 below).
It is instructive to compare these images with ground-based images presented in van den Bergh & Kamper 1985 (their Figs. 9 & 11) which also show their size and brightness evolution over the period 1958 to 1983. What appear to be diffuse clumps and short filaments several arcseconds in size on these photographs are resolved now into clusters of numerous sub-arcsecond features.
Figure 3 shows false-color images of these regions with the same color-coding used in Figure 1. In making these figures, we enhanced the colors over those of the observed line intensity ratios to increase the visibility of emission differences. Features that are roughly equally bright in all three bands appear white to slightly yellow in color and correspond to a “typical” Cas A ejecta spectrum; i.e., having strong [S III] 9069,9531, [S II] 6716,6731, [O III] 5007,4959, and [O II] 7319,7330. One such example is the bright white-ish feature along the top western portion of the Baade-Minkowski Filament No. 1 for which spectra were obtained by Hurford & Fesen (1996).
Although some sections of both regions appear dominated by one of the three filter images (blue for [O III] or red for [S III]), there does not appear to be a systematic pattern or arrangement to these regions. Small clumps of blue [O III] bright knots, greenish QSFs (i.e., detected only in the F675W filter) and red [S III] clumps appear scattered throughout each region with no obvious ionization structure either on large or small scales.
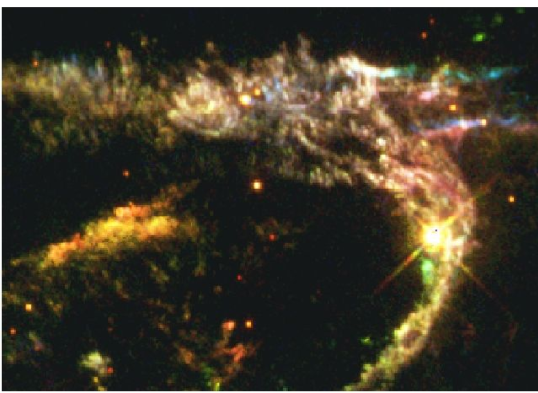
Organized emission variations are, however, present in some other regions of the remnant. This is shown in Figure 4 which presents a section of the remnant’s north-central shell. Color differences between features have been again enhanced. The two blue-green arcs along the southern portion are in sharp contrast to several reddish appearing regions lying to the north and the blue-green knots near the image top. The bluest and reddest features in this region reflect significant [O III] to [S III] line intensity differences, suggestive of O/S abundance variations like those found by Chevalier & Kirshner (1979).
For example, a spectrum for the yellowish, peak-shaped feature at the northern junction point of the two southern arcs shows unusually strong [O II] 7319,7330 emission (“FMK4”; [O III]:[O II]:[S III]:[S II] = 4:14:11:1; Hurford & Fesen 1996). It important to bear in mind that these are observed relative line strengths, and [O III] emission (not [S III]) is most often the strongest optical line emission once extinction corrections are applied (Hurford & Fesen, 1996).
In a similar fashion, the pinkish colored regions lying just above the bright star near the left-central portion of the image exhibit spectra in which [S III] 9069,9531 dominate the optical/NIR line emissions (“FMK2” & “FMK3”; [O III]:[O II]:[S III]:[S II] = 4:4:18:3; Hurford & Fesen 1996). Even stronger [S III] emission regions are found above the double star in the lower right (“FMK5”; [O III]:[O II]:[S III]:[S II] = 4:6:32:6; Hurford & Fesen 1996) and consequently appear here significantly redder.
Interestingly, the large oval shaped emission structure only partially seen here (but see Fig. 1), bounded on the south by the blue-green [O III] bright arcs, and on the north, east, and southeast by red [S III] bright emission appears kinematically to be a single, coherent ring-like structure. When sampled via its [S II] 6716,6731 emission, this ring spans a radial velocity range from km s-1 in the southwest to km s-1 in the north with a characteristic mean around -1800 km s-1 (Lawrence et al., 1995). The ring’s most blueshifted material ( km s-1) is the orangish-colored features near the “peak-like” filament at the bottom of the ring and extends westward to just south of the bright double stars. The radial velocity distribution of the [S II] emitting gas increases smoothly as one moves around the circumference of the ring-like structure, ending at around km s-1 in the fainter knots in the northern half, directly above (north) of the “peak” feature.
3.2 Ejecta Knot Dimensions
Most of Cas A’s optical ejecta shell consists of clumpy nebulosities with angular knot dimensions of The presence of clumpy ejecta has already been briefly discussed above in regard to the large emission regions shown in Figure 2. There, as elsewhere throughout the remnant’s optical emission features, a majority of ejecta knots have a scale-length for the smallest features of some ( cm) in diameter. Interestingly, this size is nearly the same as that determined from high-resolution 2 cm radio observations of the remnant which found knots for one small region (Arendt & Dickel, 1987).
A clear illustration of the clumpy nature of the remnant’s ejecta can be seen in Figure 5 which shows a small portion of the remnant’s northern limb of bright and extensive optical emission. Here we show the WFC F675W image of the region magnified by a factor of 2 in order to lessen the appearance of individual pixels. Dozens of bright size knots arranged in (0.15 pc; cm) long chains can be seen in this region. Much of the remnant’s northern “wreath” of optical emission, in fact, breaks up into clouds of tiny knots with angular dimensions mostly . Although no stars were removed from any of the images (since no pure continuum, off-band images were taken), there are very few faint stars visible in the field-of-view shown. So nearly all of the small unresolved sources seen in this figure are SN ejecta knots.
Here, as was the case for the bright emission regions examined in Figure 2, fainter emission features in between and around the brighter knots appear about as clumpy and non-uniformly distributed as the brighter features. In addition, much of the fainter emission in this area is associated with the brighter knots, often located along the inner edges of the knotty loops and strings. Emission features, both bright and faint, have structure right down to the image resolution (; cm). Examination of higher resolution PC images suggest that while there is considerable fine structure in the knots and short filaments undersampled by the WFC images, the basic knot scale length throughout the optical shell is consistently on the size scale.
Supernova models for intermediate- and high-mass progenitors suggest that ejecta will form clumps at the interfaces of layers of different chemical composition chiefly due to Rayleigh-Talyor (R-T) instabilities (Chevalier, 1976; Arnett et al., 1989; Fryxell et al., 1991; Yamada et al., 1990; Herant & Benz, 1991, 1992; Hachisu et al., 1994). Such R-T ejecta knots may then undergo strong compression after their passage through the reverse shock and into the reverse shock - front shock region (Cid-Fernandes et al., 1996). However, R-T instabilities depend upon internal presupernova structure and little is currently known empirically concerning specific ejecta knot size and evolution following the reverse shock.
Hachisu et al. (1991) and Herant & Woosley (1994) have shown that their models of the post-explosion hydrodynamics in intermediate mass progenitors (12–30 M⊙) exhibit a highly clumpy ejecta structure in the post-reverse shock region where R-T instabilities become chaotic. The model simulations of Herant & Woosley (1994) give results that resemble the Cas A jet knots (Fesen & Gunderson, 1996). However, due in part to grid-mesh limitations, it is not clear if the knot scaling in such models is close to that actually observed either in the jet or in the main shell. Nearly all models show R-T fingers and associated features at least an order of magnitude larger than the typical knots scale-lengths seen in Cas A. The degree of any ejecta clumping in post-reverse shock region is also likely to be increased by thermal instabilities from enhanced collisional cooling (Herant & Woosley, 1994; Sutherland & Dopita, 1995). The O-rich shock models of Blair et al. (2000) show post-shock compression factors in the fully radiative knots.
3.3 Chemically Peculiar Knots
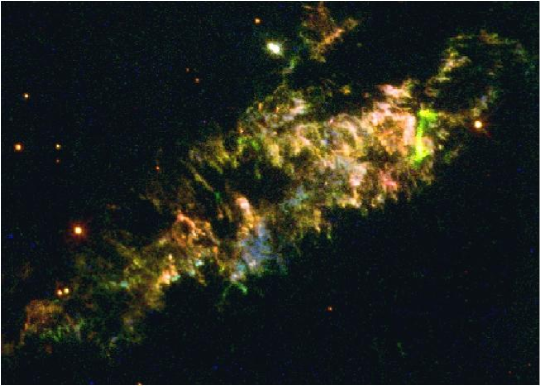
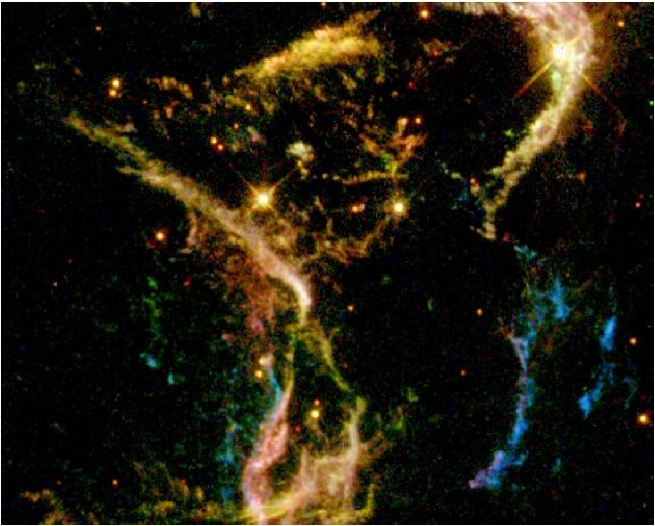
Previous spectra and imaging found several O-rich filaments situated along the eastern limb near the base of the remnant’s NE “jet” (Kamper & van den Bergh, 1976b; Chevalier & Kirshner, 1979). These characteristically exhibit strong [O III] emissions and thus show up as strongly blue features in our three color images of this region (Fig. 6). The brightest, bluest features visible in Figure 6 turn out not to have been present three decades ago, while others visible in the early 1970’s (e.g. the most eastern blue filaments seen in Fig. 6) have significantly faded.
Several seemingly S-rich but O-poor ejecta knots have also been identified. One such knot was the NW knot KB 33 (Kamper & van den Bergh, 1976a) studied by Chevalier & Kirshner (1979). This knot has unfortunately faded and today is not readily identifiable. A somewhat more extreme S-rich knot was discovered by Hurford & Fesen (1996) but was imaged with the WFPC-2 only using the F675W filter. However, several [S II] strong knots have been found in and near the base of the NE jet (Fesen & Gunderson, 1996), and some of these are seen as deep red knots in Figure 6.
Since color images do not always accurately illustrate the strength or weakness of some features on the individual images, we show in Figure 7 the F450W and F850LP for this same eastern limb region. Here the blue features visible in Figure 6 appear to have virtually no [S III] emission, whereas the [S III] (F850LP) strong red knots show little or no [O III] (F450W) emission. Both O-rich and S-rich types of features do show up, of course, in the F675W image presumably due to either the presence of other oxygen or sulfur lines respectively.
Because [O III] and [S III] have relatively high ionization energies (54.9 eV and 34.8 eV, respectively) and similar electronic structures, it seems unlikely that such gross line ratio differences can be accounted for by means other than abundance differences. Therefore, the presence of morphological differences between the types of knots, where O-bright knots appear more nebulous than the more knotty S-rich ones (see Fig. 6), may reflect the physical processes which create ejecta knots in various progenitor layers.
3.4 Large-Scale Reverse Shock Features
The remnant’s bright radio and X-ray shell structure has been generally taken as marking the location of the reverse shock front (Gotthelf et al., 2001). Until now there has been little evidence in the remnant’s optical shell structure to indicate the presence of an organized reverse shock front. However, the HST images reveal some optical emission structures that appear to be associated with this shock.
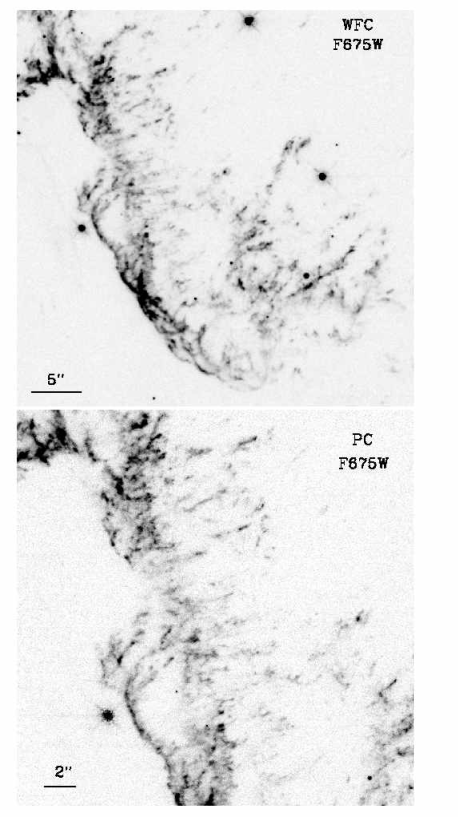
A portion of the northwestern corner of the remnant shell is shown in Figure 8. Despite the center of expansion lying some distance off the lower left hand side of the top panel image, a line of overlapping, concave curved emission filaments can be seen (they appear reddish in color in Fig. 1). The structure is similar to that commonly seen in older SNRs except here the expansion orientation is reversed in the sense of the implied motion of the filament curvature is towards rather than away from the remnant center.
On ground-based images, this line of emission appeared as nothing more than a series of medium size ejecta knots and filaments with little evidence for any morphologically coherent structure (Fig. 10; van den Bergh & Kamper 1985). However, velocity maps in the [S II] doublet show that this line of emission is dynamically quite coherent, with velocities systematically decreasing +900 to +600 km s-1 from north to south (Lawrence et al., 1995). The cluster of yellowish knots located farther west along the southern fringe of this line of filaments (see Fig. 1) show considerably larger redshifts (+1200 to +1700 km s-1) and thus are separate, unrelated features.
The morphology of the overlapping filamentary structure shown in Figure 8 suggests it marks the location of the reverse shock front in this region of the remnant. Here, as elsewhere, the fine-scale emission structure again is highly clumped especially radially away from the leading (inner) edge of emission. Ejecta knot dimensions range from with a strong radial asymmetry away from the shock front. A higher resolution PC close-up image of a portion of this region is shown in the lower panel of Figure 8. Ejecta features down to the PC’s resolution ( cm) can be seen both at and away from the shock front.
Orientation of these features is generally nonradial with respect to the explosion center, and varies systematically along the shock. This strongly suggests the presence of nonradial shear flows behind the shock, which are expected to occur behind the oblique reverse shock seen in this region of Cas A. A test of the reverse shock nature of these filaments may come with a second epoch of HST images of the region. If the filament edge does indeed mark the location of the reverse shock front, its proper motion outward from the remnant center should be somewhat less than that of individual ejecta knots.
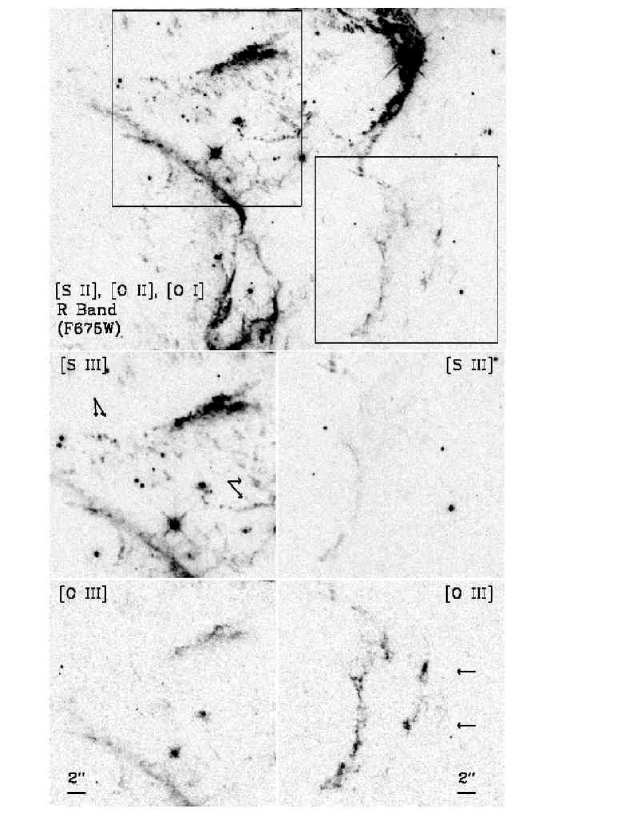
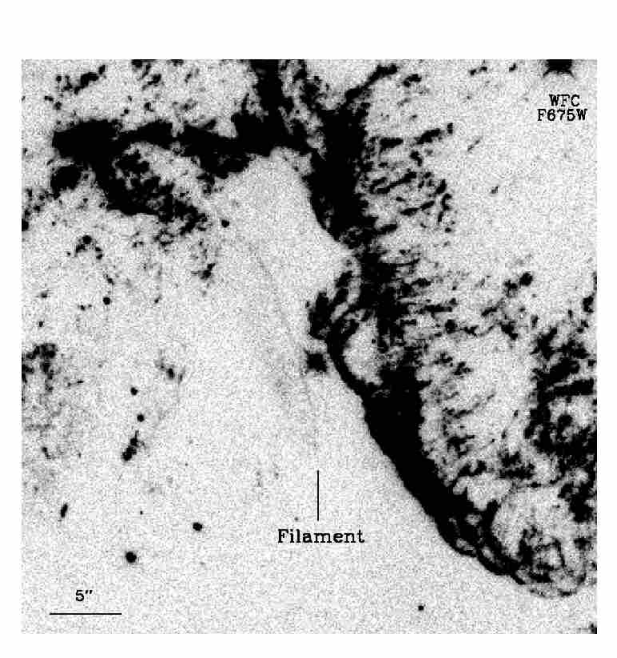
In a wider view of this region as seen in the F675W filter, a faint, long (; 0.25 pc) thin filament lies just off to the east of these bright curved filaments (Fig. 9). This filament has a thickness comparable to that of the WFC resolution () with some exceedingly faint diffuse emission extending some ( cm) to the east. The filament shows up weakly in the [S III] F850LP filter image but not in the F450W image. Though faint (e.g. it is not visible in Fig. 8), it is however definitely real and is seen in deep, ground-based R-band images of the SNR.
The filament’s smooth, continuous appearance is singular within the remnant, with nothing else like it morphologically in the F675W or the other three filters. Due to its projected location adjacent to and closer in to the Cas A expansion center relative to the line of the suspected reverse shock emission discussed above, it is tempting to associate it somehow with the brighter structure, possibly as shock photoionization precursor emission or a faint reflection of neighboring FMK emission by ejecta dust (Douvion, Lagage, & Pantin, 2001). Due to its extreme faintness, however, high quality spectroscopic observations needed to determine its true nature may prove difficult to obtain.
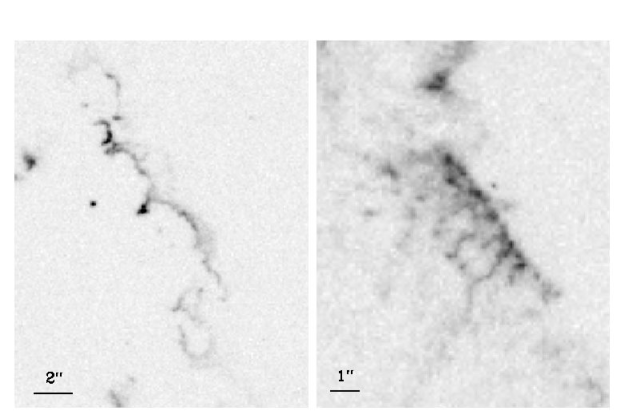
Other remnant features suggestive of reverse shock front and associated instabilities are shown in Figure 10. In the upper left hand panel, we show an emission feature located in the south-central portion of the remnant. A R-T-like “head-tail” feature with a bright knot at the tip of a thin stem appears strikingly like that of a model calculations of a shock running over a dense cloudlet (Klein, McKee, & Colella 1994, Klein et al. 2000). Its projected location in front of (to the southeast; lower left) of a faint scalloped line of emission is quite suggestive of shock front emission (possibly that of the reverse shock) moving back towards the remnant center (northwest; upper right).
Finer and more closely packed R-T-like features are present along the remnant’s eastern limb, near the jet breakout region (Fig. 10, right panel). Here one sees a series of small knots at the ends of finger-like filaments which in turn appear connected to a line of much brighter emission knots. These filaments are markedly nonradial with respect to the explosion center, again hinting at the presence of shear flows behind the reverse shock. Lines of closely spaced, bright knots that have trailing emission are a common feature of the shell (Fig. 8).
3.5 Ejecta Knot Mass Stripping
The fine-scale structures of the remnant’s ejecta suggest partially fragmented knots with some mass stripping possibly due to Kelvin-Helmholtz instabilities along knots edges like that modeled by Klein, McKee, & Colella (1994). Relatively large velocity dispersions seen in individual knots (van den Bergh, 1971; Chevalier & Kirshner, 1979) have been attributed to the reverse shock deceleration but there has been no clear evidence for this optically. However, we have detected spectroscopic evidence for a large velocity shear that may help in our understanding of some of the knot features seen in the HST images.
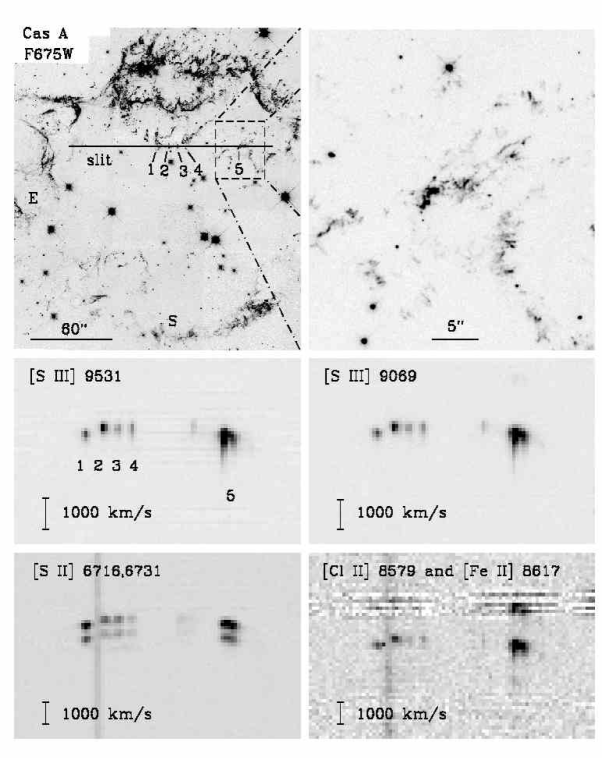
In exploratory long slit spectra taken of emission regions located just north of the remnant’s expansion center, a few knots were found to exhibit asymmetrical emission “streaks” 1000 km s-1 from line centers. One especially bright knot showing this effect is located in the northwest portion of the remnant. The slit position across the remnant that detected this knot is shown in Figure 11. Several emission knots (Nos. ) were detected with the brightest one being Knot 5 located near the slit’s western end. The bright knot’s line emission is actually a blend of two neighboring, large emission clumps (Fig. 11, upper right hand panel) with the more eastern one being considerably brighter than the more western one. All five emission knots exhibit large redshifted emission ( 4000 km s-1) placing them on the remnant’s receding hemisphere.
Several emission lines are shown in the lower four panels of Figure 11 including [S III] 9069,9531 , [S II]6716,6731, [Cl II] 8579 and [Fe II] 8617. The [S III] lines show a conspicuous blue-shifted emission “streak” extending roughly 1000 km s-1. The peak intensity level of the streaked emission is about 10% of the peak [S III] line emission. No similar blue (or red) shifted emission feature is seen in the [S II] line down to a level 1% of the line’s peak emission. However, a blue shifted emission feature similar to that seen in the [S III] lines is present for other high ionization lines including [Cl II] and [Ar III] 7135. If interpreted as true knot deceleration, this 1000 km s-1 velocity spread represents a 20% velocity decrease; that is, from an observed radial velocity of +5150 to around +3800 km s-1. Such velocity shearing may be related to some R-T-like features seen in the remnant.
3.6 Circumstellar Knots (QSFs)
In their discovery of optical emission associated with Cas A, Baade & Minkowski (1954) noted the presence of several “red bits” of nebulosity which showed imperceptible proper motions and small, mostly negative radial velocities. Subsequent work showed these features, for which Minkowski (1957) coined the term “quasi-stationary flocculi” or “QSFs”, to have optical spectra dominated by [N II] 6548,6583 and H line emission. Due to their low expansion velocities ( 500 km s-1) and [N II] 6583/H ratios 3 indicative of N/H enrichment, QSFs are believed to be clumps of circumstellar mass loss material shocked by the remnant’s blast wave (van den Bergh, 1971; Peimbert & van den Bergh, 1971; Kamper & van den Bergh, 1976a; van den Bergh & Kamper, 1985).
About 40 bright QSFs have been identified to date. They are non-uniformly distributed around the remnant, with concentrations along the north and southwest limbs, plus a handful found outside of the main shell in the SW (see van den Bergh 1971, van den Bergh & Kamper 1985, Lawrence et al. 1995, Reynoso et al. 1997, and Fesen 2001 for images and ID charts; Note: Reed et al. (1995) reported the detection of 454 QSFs but quote a [N II] 6583 detection flux limit nearly an order of magnitude above that of the deepest H + [N II] images).
QSFs are irregular or elongated in shape with typical diameters of (Minkowski, 1968; van den Bergh, 1971). Two morphological QSF classes have been proposed by van den Bergh & Kamper (1985) consisting of: 1) elongated, head-tail or “tadpole-like” objects mainly found in southern regions, and 2) smaller, more compact clumps typically found in the northern FMK-rich areas (van den Bergh, 1971). They also suggest that tadpole shaped QSFs might be older clumps of shocked CSM than the more compact QSFs.
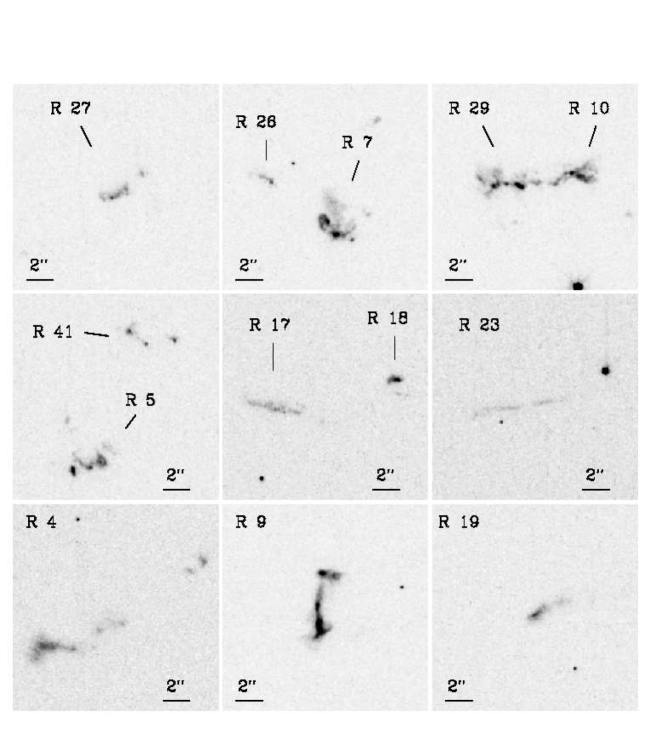
WFPC-2 [N II] F685N images of nine representative QSFs from different sections around the remnant are shown in Figure 12. QSF knot identification numbers are those of van den Bergh & Kamper (1985) with the exception of “R41” which we use to denote the cluster of three semi-stellar QSFs northwest of R5 not identified by van den Bergh & Kamper (1985). QSFs from the northern half of Cas A’s bright optical shell are shown in the top two rows of Figure 12, with the bottom row showing the southern knots R4, R9, and R19.
From these HST images, QSF emission cores seem generally to be in size, with considerable associated diffuse nebulosity in many cases. Tadpole-like objects break up into a series of individual knots rather than being continuous features (e.g. R4 & R23). Other QSFs that appear largely filamentary on ground-based images are now resolved into a series of small knots and diffuse clumps (e.g. R17 & R23).
In contrast to the generally more diffuse morphology of southern QSFs (R4 & R9), some northern rim QSFs (R26, R27 & R41), have small internal structures with knot sizes down to the WFC resolution. While compact QSFs may be more common in the northern FMK-rich areas, it is unclear whether such morphological differences are physically meaningful.
However, we do find that the diffuse emission associated with northern limb QSFs lies mainly at greater radial distances from the remnant’s expansion center (e.g. R5, R7, R10-R29, & R27). This is to say, the brightest internal knot features typically lie along the inner QSFs edges, closer to the remnant’s explosion center. This could indicate partial knot disruption and mass stripping from cloud edges following main shock front passage like that suggested by some shock models (Mac Low et al., 1994; Klein, McKee, & Colella, 1994).
3.7 Cas A’s General Optical Structure
The overall appearance of Cas A is the result of several factors including the structure of the ejecta, the structure of the ambient medium, and the complex interaction between them on large and small scales. The remnant’s optical ejecta, the so-called FMKs, may represent only a small fraction of the total ejected material. Relatively smooth, cold ejecta will pass through a reverse shock front and get heated to X-ray emitting temperatures. Denser clumps that are initially co-moving with the cold ejecta will become compressed by the high thermal pressure and the ram pressure in the postshock region leading to the optical FMK emission seen.
Reed et al. (1991) and Lawrence et al. (1995) found that the FMKs tend to appear as circular features on the surface of a sphere. Our images tend to reinforce that appearance but show much finer ejecta detail (e.g. Fig. 5) along with whole regions that are strongly filamentary (e.g. Fig. 8). The origin of some of these curved structures and filaments may be due in part to a “Ni bubble effect” acting in the days after the initial explosion. Li, McCray, & Sunyaev (1993) showed how this effect can account for the high volume filling factor of Fe in SN 1987A despite its small mass, and also the clumpiness of the O emission. Non-radioactive material can end up being compressed by rising and expanding bubbles of ejecta rich in radioactive 56Ni.
Basko (1994) followed the initial expansion of a single Ni bubble, and Blondin, Borkowski, & Reynolds (2001) simulated the interaction of multiple bubbles with an ambient medium. The presence of non-radioactive O and S in the fast knots is consistent with this scenario, as is the presence of more diffuse Fe-rich ejecta in X-ray emitting gas (Hughes et al., 2000). The new HST observations show detailed structure in the fast ejecta, some of which might be the result of the initial Ni bubble formation.
The images give the impression of planar or generally slightly concave features which may be bubble “walls” with sizes up to half of the radius of the reverse shock. In hydrodynamical simulations of Blondin, Borkowski, & Reynolds (2001), the slowest shocks, which are most likely to be seen at optical wavelengths, are generated by an impact of relatively fast shocks propagating through the Fe bubbles with the dense bubbles’ bottoms and side walls. This results in a generally concave morphology of such slow shocks, while the interface regions between adjacent bubbles may produce dense, outward-facing protrusions where conditions are even more favorable for radiative cooling and production of optical emission. The dense and cool shocked ejecta seen in these simulations are less decelerated than the much hotter X-ray emitting gas comprising the bulk of the shocked ejecta, in qualitative agreement with the much higher space velocities of optically emitting material in reverse shocks when compared with the velocity of the bright Cas A shell inferred from X-ray data.
The nature of the ambient medium into which Cas A is expanding is also uncertain. Expansion into a uniform medium is often assumed, with the X-ray bright region representing the reverse shocked gas and the outer plateau representing the forward shocked gas (e.g. Fabian et al. 1980; Gotthelf et al. 2001). However, the inference that the progenitor of Cas A was a Wolf-Rayet star strongly suggests that the region around the supernova was modified by mass loss from the progenitor. Chevalier & Liang (1989) noted that the N-rich QSFs, which are likely to be mass lost from the progenitor, could be the denser parts of a presupernova circumstellar shell at the radius of the strong emission. The positions of the 40 brightest QSFs are consistent with the strong interaction region occupied by most of the FMKs.
Borkowski et al. (1996) carried out 1D simulations of a circumstellar interaction model and modeled the observed X-ray spectrum. In this scenario, the FMKs were brightest where they moved through the circumstellar shell because of the high ram pressure. But some portions of the Cas A shell exhibit little or no FMK emission. It is possible that these optically faint regions are where the cooling time for the shocked knots is longer than the remnant age, so the knot material may emit in X-rays, but not at optical wavelengths. The Chandra X-ray image (e.g. Fig. 1 of Hughes et al. 2000) shows a cellular structure that is more widespread than that seen in the optical. However, with the exception of the western rim where there is bright X-ray but little optical emission, one does find a rough correspondance with areas having bright optical knots and strong X-ray emission (Fesen, 2001).
4 Conclusions
The high resolution WFPC-2 HST images provide the first look at the fine-scale structure of metal-rich ejecta in this young SNR from a core-collapse SN. Our main conclusions include:
1) Considerable fine-scale detail is observed in the reverse-shocked ejecta with typical knot scale lengths of ( cm). Both bright and faint emission features appear highly clumped with little in the way of a smooth, diffuse emission component detected. The origin of some curved structures and filaments may be due in part to bubbles of radioactive Ni-rich ejecta compressing non-radioactive material into planar-like features.
2) Strong differences in [S III] and [O III] line intensities indicating large chemical abundance differences are seen, particularly in knots located along the bright northern limb and near the base of the northeast jet.
3) A line of curved, overlapping filaments in the remnant’s northwestern rim appears to mark the location of the remnant’s reverse shock front in this region. The morphology of some finger-like ejecta structures elsewhere suggest cases where the reverse shock front is encountering the remnant’s clumped ejecta. A faint filamentary emission structure is found to lie some 5′′ east of the line of suspected reverse shock front filaments, and might be shock precursor emission in more inward-lying ejecta or a reflection of neighboring FMK emissions off ejecta dust.
4) Large velocity shears (1000 km s-1) possibly associated with the formation of Rayleigh-Taylor-like features are found in the line profiles of several emission lines (e.g. [S III] 9069,9532 and [Cl II] 8679) from ground-based optical spectra of knots near the remnant’s center. Similar velocity shearing in knots may be related to R-T-like features seen in other portions of the remnant. The nonradial orientation of several well-defined systems of linear filaments hints at the presence of large-scale shear flows behind the reverse shock.
5) [N II] images of the remnant’s circumstellar knots (“QSFs”) reveal them to be thick knots and filaments with diffuse edges facing away from the center of expansion.
The evolution and proper motion of the remnant’s fine-scale ejecta features along with possible ionization changes will be investigated through follow-up WFPC-2 imaging.
| Filter | Bandpass | Primary Lines | Secondary Lines | Exposure Times |
|---|---|---|---|---|
| F450W | 3700–5200 Å | [O III] 4959,5007 | [O II] 3726,3729 | s |
| F658N | 6560–6620 Å | [N II] 6583 | H 6563 | s |
| F675W | 6000–7600 Å | [S II] 6716,6731; [O II] 7319,7330; | [N II] 6583; H 6563; | s |
| [O I] 6300,6364 | [Ar III] 7135 | |||
| F850LP | 8300–10600 Å | [S III] 9069,9531 | [S II] 10287-10370 | s |
References
- Anderson et al. (1991) Anderson, M., Rudnick, L., Leppik, P., Perley, R., & Braun, R. 1991, ApJ, 373, 146
- Arendt & Dickel (1987) Arendt, R. G., & Dickel, J. R. 1987, ApJ, 315, 567
- Arnett et al. (1989) Arnett, W. D., Fryxell, B. A., & Muller, E. 1989, ApJ, 341, L63
- Baade & Minkowski (1954) Baade, W., & Minkowski, R. 1954, ApJ, 119, 206
- Basko (1994) Basko, M. 1994, ApJ, 425, 264
- Blair et al. (2000) Blair, W. P., Morse, J. A., Raymond, J. C., Kirshner, R. P., Hughes, J. P., Dopita, M. A., Sutherland, R. S., Long, K. S., & Winkler, P. F. 2000, ApJ, 537, 667
- Blondin, Borkowski, & Reynolds (2001) Blondin, J. M., Borkowski, K. J., & Reynolds, S. P. 2001, ApJ, in press
- Borkowski et al. (1996) Borkowski, K. J., Szymkowiak, A. E., Blondin, J. M., & Sarazin, C. L. 1996, ApJ, 466, 866
- Cardelli, Clayton, & Mathis (1989) Cardelli, J. A., Clayton, G. C., & Mathis, J. S. 1989, ApJ, 345, 245
- Chevalier (1976) Chevalier, R. A., 1976, ApJ, 207, 872
- Chevalier & Kirshner (1978) Chevalier, R. A., & Kirshner, R. P. 1978, ApJ, 219, 931
- Chevalier & Kirshner (1979) Chevalier, R. A., & Kirshner, R. P. 1979, ApJ, 233, 154
- Chevalier & Liang (1989) Chevalier, R. A., & Liang, E. P. 1989, ApJ, 344, 332
- Cid-Fernandes et al. (1996) Cid-Fernandes, R., Plewa, T., Rozyczka, M., Franco, J., Terlevich, R., Tenorio-Tagle, G. & Miller, W. 1996, MNRAS, 283, 419
- Douvion, Lagage, & Pantin (2001) Douvion, T., Lagage, P. O., & Pantin, E. 2001, A&A, 369, 589
- Fabian et al. (1980) Fabian, A. C., Willingale, R., Pye, J. P., Murray, S. S., & Fabbiano, G. 1980, MNRAS, 193, 175
- Fesen (2001) Fesen, R. A. 2001, ApJS, 133, 161
- Fesen & Becker (1991) Fesen, R. A., & Becker, R. H. 1991, ApJ, 371, 621
- Fesen, Becker, & Blair (1987) Fesen, R. A., Becker, R. H., & Blair, W. P. 1987, ApJ, 313, 378
- Fesen, Becker, & Goodrich (1988) Fesen, R. A., Becker, R. H., & Goodrich, R. 1988, ApJ, 329, L89
- Fesen & Gunderson (1996) Fesen, R. A., & Gunderson, K. S. 1996, ApJ, 470, 967
- Fryxell et al. (1991) Fryxell, B. A., Muller, E., Arnett, W. D., 1991, ApJ, 345, L43
- García-Segura, Langer, & Mac Low (1996) García-Segura, G., Langer, N., & Mac Low, M.-M. 1996, A&A, 316, 133
- Gotthelf et al. (2001) Gotthelf, E. V., Koralesky, B., Rudnick, L., Jones, T. W., Hwang, U., & Petre, R. 2001, ApJ, 552, L39
- Hachisu et al. (1991) Hachisu, I., Matsuda, T., Nomoto. K., & Shigeyama, T. 1991, ApJ, 368, L27
- Hachisu et al. (1994) Hachisu, I., Matsuda, T., Nomoto, K., & Shigeyama, T. 1994, A&AS, 104, 341
- Herant & Benz (1991) Herant, M., & Benz, W. 1991, ApJ, 370, L81
- Herant & Benz (1992) Herant, M., & Benz, W. 1992, ApJ, 387, 294
- Herant & Woosley (1994) Herant, M., & Woosley, S. E. 1994, ApJ, 425, 814
- Hester et al. (1996) Hester, J. J., et al. 1996, ApJ, 456, 225
- Hughes et al. (2000) Hughes, J. P., Rakowski, C. E., Burrows, D. N., & Slane, P. O. 2000, ApJ, 528, L109
- Hurford & Fesen (1996) Hurford, A. P., & Fesen, R. A. 1996, ApJ, 469, 246
- Jansen et al. (1988) Jansen, F., Smith, A., Bleeker, J. A. M., de Korte, P. A. J., Peacock, A., & White, N. E., 1988, ApJ, 331, 949
- Kamper & van den Bergh (1976a) Kamper, K. & van den Bergh, S. 1976, ApJS, 32, 351
- Kamper & van den Bergh (1976b) Kamper, K. & van den Bergh, S. 1976, S&T, 51, 236
- Keohane et al. (1996) Keohane, J. W., Rudnick, L., & Anderson, M. C. 1996, ApJ, 466, 309
- Kirshner & Chevalier (1977) Kirshner, R. ., & Chevalier, R. A. 1977, ApJ, 218, 142
- Klein, McKee, & Colella (1994) Klein, R. I., McKee, C. F., & Colella, P. 1994, ApJ, 420, 213
- Klein et al. (2000) Klein, R. I., Budil, K. S., Perry, T. S., & Bach, D. R. 2000, ApJS, 127, 379
- Lagage et al. (1996) Lagage, P. O., Claret, A., Ballet, J., Boulanger, F., Cèsarsky, C. J., Fransson, C., & Pollock, A. 1996, A&A, 315, L273
- Langer & El Eid (1986) Langer, N., & El Eid, M. F. 1986, A&A, 167, 265
- Lawrence et al. (1995) Lawrence, S. S., MacAlpine, G. M., Uomoto, A., Woodgate, B. E., Brown, L. W., Oliversen, R. J., Lowenthal, J. D., & Liu, C. 1995, AJ, 109, 2635
- Li, McCray, & Sunyaev (1993) Li, H., McCray, R., & Sunyaev, R. A. 1993, ApJ, 419, 824
- Massey & Gronwald (1990) Massey, P., & Gronwald, C. 1990, ApJ, 358, 344
- McKee (1974) McKee, C. F. 1974, ApJ, 188, 335
- Mac Low et al. (1994) Mac Low, M., McKee, C. F., Klein, R. I., Stone, J. M., & Norman, M. L. 1994, ApJ, 433, 757
- Minkowski (1957) Minkowski, R. 1957, “Radio Astronomy”, IAU Symposium No. 4 Cambridge, p.107
- Minkowski (1968) Minkowski, R. 1968, in “Stars and Stellar Systems”, 7, 623
- Morse et al. (1996) Morse, J. A., Blair, W. P., Dopita, M. A., Hughes, J. P., Kirshner, R. P., Long, K. S., Raymond, J. C., Sutherland, R.,S., & Winkler, P. F. 1996, AJ, 112, 509
- Peimbert & van den Bergh (1971) Peimbert, M., & van den Bergh, S. 1971, ApJ, 167, 223
- Reed et al. (1991) Reed, J. E., Hester, J. J., Fabian, A. C., & Winkler, P. F. 1991, BAAS, 23, 1, 826
- Reed et al. (1995) Reed, J. E., Hester, J. J., Fabian, A. C., & Winkler, P. F. 1995, ApJ, 440, 706
- Reynoso et al. (1997) Reynoso, E. M., Goss, W. M., & Dubner, G. M., Winkler, P. F., & Schwarz, U. J. 1997, A&A, 317, 203
- Schaeffer, Casse, & Cahen (1987) Schaeffer, R., Cassé, M., & Cahen, S. 1987, ApJ, 316, L31
- Stone (1977) Stone, R. P. S. 1977, ApJ, 218, 767
- Sutherland & Dopita (1995) Sutherland, R. P., & Dopita, M. A. 1995, ApJ, 439, 381
- Thorstensen, Fesen, & van den Bergh (2001) Thorstensen, J. R., Fesen, R. A., & van den Bergh, S. 2001, AJ, in press
- van den Bergh (1971) van den Bergh, S. 1971, ApJ, 165, 457
- van den Bergh (1976) van den Bergh, S. 1976, S&T, 51, 236
- van den Bergh (1988) van den Bergh, S. 1988, ApJ, 327, 156
- van den Bergh & Dodd (1970) van den Bergh, S., & Dodd, W. W. 1970, ApJ, 162, 485
- van den Bergh & Kamper (1985) van den Bergh, S., & Kamper, K. W. 1985, ApJ, 293, 537
- van den Bergh & Pritchet (1986) van den Bergh, S., & Pritchet, C. J. 1986, PASP, 98, 448
- Vink, Kaastra, & Bleeker (1996) Vink, J., Kaastra, J. S., & Bleeker, J. A. M. 1996, A&A, 307, L41
- Vink et al. (1998) Vink, J., Bloemen, H., Kaastra, J. S., Bleeker, J. A. M. 1998, A&A, 339, 201
- Winkler, Roberts, & Kirshner (1991) Winkler, P. F., Roberts, P. F., Kirshner, R. P. 1991, in “Supernovae: The Tenth Santa Cruz Summer Workshop in Astronomy and Astrophysics”, ed. S.E. Woosley (Springer-Verlag: New York), p 652
- Woosley & Weaver (1995) Woosley, S. E., & Weaver, T. A. 1995, ApJ, 448, 315
- Yamada et al. (1990) Yamada, Y., Nakamura, Oohara, K. 1990, Progr. Theor. Phys., 84, 436