VLBA observations of GHz-Peaked-Spectrum
radio sources at 15 GHz
We present VLBA observations at 15 GHz of ten GHz Peaked Spectrum (GPS) radio sources. The cores are often difficult or impossible to locate. When likely cores are found, they account for a small fraction of the flux density in GPS galaxies - around or below 2%, while in GPS quasars they can account for more than 20% of the total flux density. We detect low polarization in the GPS sources – i.e., typically less than a few percent and often less than one percent. This establishes that low polarization in the parsec scale structure is an important defining characteristic of the GPS sources. The dichotomy in the radio morphology versus optical identification, i.e., galaxies are symmetric and quasars are not, is basically confirmed from these new data, which also indicate that the radio emission from GPS quasars is dominated by a jet, with often a weak or hidden core, suggesting they are at moderate angles to the line of sight, and so are only moderately beamed.
Key Words.:
galaxies: active — quasars: general — radio continuum: galaxies1 Introduction
A small but still significant fraction of compact radio sources (i.e., radio sources strongly dominated by an unresolved component on arc-second scales) show a convex radio spectrum peaking around 1 GHz.
These sources have caught the interest of astronomers because they have remarkable properties. They are a mixed group of galaxies and quasars, with the quasars usually found at very high redshifts, and with the galaxies showing a parsec scale morphology resembling that of the large-scale “classical doubles” which span hundreds of kpc (e.g., Phillips & Mutel 1982, Mutel, Hodges, & Phillips 1985; Conway et al. 1994; Readhead et al. 1996a; Taylor, Readhead, & Pearson 1996; Stanghellini et al. 1997, 1999). These small classical doubles were named “Compact Symmetric Objects” (CSOs) by Wilkinson et al. (1994).
This led to study the GPS radio sources because they are likely to be the progenitors of powerful radio galaxies, and if so, can shed light on the onset of the radio source phenomenon. In addition, the study of the subclass of GPS quasars has the goal of searching for high redshift AGN with which to probe the environment of galaxies in the early Universe.
Owsianik and Conway (1998) and Owsianik et al. (1998) were the first to report on direct evidence of proper motion of the outer edges in CSOs, with an estimated dynamical age of the order of years, and a strong upper limit of years on their actual age, thus providing strong support to the hypothesis that these sources are the youngest phases of the lobe dominated radio sources. Nowadays, expansion velocities of the outer edges of radio source have been detected or suspected in about ten CSOs (Fanti 2000).
A comprehensive review on GPS radio sources and our current understanding of their nature has been published by O’Dea (1998).
Over the past decade, we have concentrated our efforts on studying in detail the brightest members of this class of radio sources, selecting a complete flux-limited sample, and extensively observing it in radio, optical, and X-ray bands.
The complete sample (Stanghellini et al. 1998) consists of 33 objects, with the following selection criteria:
- declination
- galactic latitude
- flux density at 5 GHz
- turnover frequency between 0.4 and 6 GHz
- spectral index () in the high frequency, likely optically thin, part of the spectrum.
Much can be learned from the radio morphology of these sources as revealed by VLBI observations.
Stanghellini et al. (1997, paper I) presented global VLBI 5 GHz images of 9 radio sources of the GPS 1 Jy sample. Stanghellini et al. (1999) presented 5 GHz images of additional 11 radio sources from the list of O’Dea et al. (1991), including two objects from the GPS 1 Jy sample.
The results from these observations complemented with information from the literature for the sources of the complete sample suggest that GPS quasars have preferentially core-jet or complex morphology while GPS galaxies are likely to be CSOs, (with a few showing a complex morphology).
Continuing our study of the milliarcsecond morphology of our complete sample, we now present new polarization sensitive VLBA 15 GHz images of several sources already observed at 5 GHz. The new data allow us to study the spectral properties of the radio components which is necessary to locate the core and unambiguously define the radio morphology.
Observations of the integrated polarization of GPS sources with the VLA have shown that the fractional polarization is very low – typically less than one percent (e.g., Rudnick & Jones 1982; Rusk 1988; O’Dea et al. 1990a; O’Dea, Baum & Stanghellini 1991). In this paper we address whether this is due to beam depolarization in the VLA observations or if this is a genuine property of the parsec scale structure.
H0=100 km sec-1 Mpc-1, and q0=0.5 have been used throughout this paper, and the spectral index is defined such that .
2 Observations and results
The observations were carried out on 22 April 1996, at 15.365 GHz, with the VLBA with the addition of a single VLA antenna, for a total of eleven 25 meter antennae, recording 16 frequency channels in 2 baseband converters, for a total of 16 MHz bandwidth in each hand of circular polarization. Each source has been observed for about 2 hours, with 3 or 4 scans at different hour angles to improve the UV coverage.
After correlation in Socorro, the data have been processed and analyzed with the Astronomical Image Processing System (AIPS) developed by the National Radio Astronomy Observatory (NRAO). The data were fringe fitted, calibrated, edited, self-calibrated, and imaged in a standard way. Phase self-calibration has been applied several times, and a final iteration of amplitude and phase self-cal has been performed. The gain correction was only a few percent for all the sources confirming the well known reliability of the a-priori calibration done with the antenna gains and system temperatures.
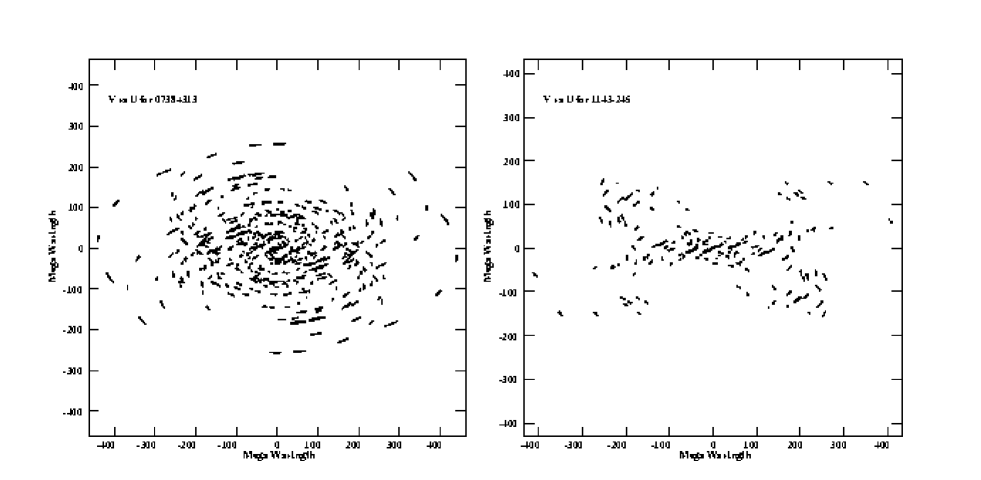
In Fig. 1 we show the best (0738+313) and poorest (1143-245) UV coverage in our data.
The list of the observed radio sources with basic information is shown in Table 1. The typical noise on the cleaned images is around a half mJy and the typical restoring beam is of the order of 1 mas.
Because the small size of several of the sources observed, we also show deconvolved images obtained using the Maximum Entropy Method (MEM), which increases the resolution for high signal to noise components. These MEM images should be considered with caution; we use the finer details they show to confirm what is seen in the cleaned images, or to make suggestions to be confirmed by future observations.
| pc/mas | GHz | ||||||||||
|---|---|---|---|---|---|---|---|---|---|---|---|
| (1) | (2) | (3) | (4) | (5) | (6) | (7) | (8) | (9) | (10) | (11) | (12) |
| 0500+019 | 05 00 45.18 | +01 58 53.8 | G | 21.0i | 0.583 | 3.8 | 57 | 0.83 | 1.6 | -0.9 | 2.0 |
| 0738+313 | 07 38 00.18 | +31 19 02.1 | Q | 16.1V | 0.630 | 3.9 | 40 | 2.11 | 0.7 | -0.8 | 5.1 |
| 0742+103 | 07 42 48.47 | +10 18 32.6 | Q? | 23R | (1) | 4.3 | (56) | 1.31 | 0.7 | -0.7 | 2.8 |
| 0743006 | 07 43 21.05 | 00 36 55.8 | Q | 17.5V | 0.994 | 4.3 | 26 | 1.28 | 0.88 | -0.61 | 5.8 |
| 1143245 | 11 43 36.37 | 24 30 52.9 | Q | 18.5V | 1.95 | 4.1 | 30 | 0.57 | 2.5 | -0.7 | 2.0 |
| 1345+125 | 13 45 06.17 | +12 32 20.3 | G | 15.5r | 0.122 | 1.5 | 130 | 1.05 | 0.9 | -0.7 | 0.6 |
| 1404+286 | 14 04 45.62 | +28 41 29.2 | Sy | 14.6r | 0.077 | 1.0 | 7 | 0.98 | 1.5 | -1.6 | 5.3 |
| 2126158 | 21 26 26.78 | 15 51 50.4 | Q | 17.3V | 3.270 | 3.5 | 20 | 0.81 | 1.3 | -0.5 | 3.9 |
| 2128+048 | 21 28 02.61 | +04 49 04.4 | G | 23.3r | 0.99 | 4.3 | 150 | 0.51 | 1.0 | -0.8 | 0.8 |
| 2134+004 | 21 34 05.21 | +00 28 25.1 | Q | 18.0V | 1.936 | 4.1 | 12 | 5.23 | 1.2 | -0.7 | 5.2 |
The parameters of the various components are shown in Table 2 as measured on the images. We report the Full Width Half Maximum (FWHM) size derived from Gaussian fits (task JMFIT in AIPS). In some cases the fit is rather poor and the reported numbers, preceded by the symbol , must be considered just a rough estimate, otherwise we assume a typical 10 uncertainty for the diameters and flux densities of the components.
| Source and | L | Comp. | PA | Tb | umin | Heq | ||||||
|---|---|---|---|---|---|---|---|---|---|---|---|---|
| class | pc | pc | pc | mJy | ||||||||
| 0500+019 | 13 | 50 | A1 | 0.9 | 0.6 | 3.4 | 2.3 | +215 | 215 | 1.4 | 400 | 66 |
| CSO | A2 | 1.6 | 0.6 | 6.1 | 2.3 | +0 | 25 | .09 | 84 | 30 | ||
| B1 | 0.8 | 0.3 | 3.0 | 1.1 | +164 | 446 | 6.7 | 1400 | 120 | |||
| B2 | 0.8 | 0.4 | 3.0 | 1.5 | +14 | 56 | 0.63 | 320 | 58 | |||
| C | 0.7 | 0.6 | 2.7 | 2.3 | +113 | 13 | 0.11 | 93 | 32 | |||
| D | 1.2 | 0.6 | 4.6 | 2.3 | +12 | 35 | 0.17 | 120 | 36 | |||
| 0738+313 | 5 | 20 | A | 0.6 | 0.1 | 2.3 | 0.4 | +5 | 925 | 57 | 9500 | 320 |
| CX | B | 0.6 | 0.3 | 2.3 | 1.2 | +155 | 1061 | 22 | 2900 | 180 | ||
| 0742+103 | 4 | 17 | A1 | 1.3 | 0.4 | 5.6 | 1.7 | +150 | 990 | 8.6 | 1900 | 140 |
| J | A2 | 1.2 | 1.2 | 5.2 | 5.2 | - | 320 | 1.1 | 330 | 60 | ||
| 0743-006 | 2 | 9 | A1 | 0.4 | 0.3 | 1.7 | 1.3 | +38 | 229 | 8.6 | 2200 | 160 |
| CJ | A2 | 0.4 | 0.2 | 1.7 | 0.9 | +46 | 753 | 42 | 7000 | 270 | ||
| A3 | 0.3 | 0.2 | 1.3 | 0.9 | +38 | 281 | 21 | 4700 | 220 | |||
| 1143-245 | 5 | 20 | A | 1.0 | 0.6 | 4.1 | 2.5 | +18 | 460 | 5.1 | 2100 | 150 |
| CJ | B | 2.2 | 0.6 | 9 | 2.5 | -6 | 87 | 0.4 | 520 | 75 | ||
| 1345+125 | 75 | 110 | A | 1.3 | 0.4 | 2.0 | 0.6 | +163 | 304 | 1.5 | 520 | 75 |
| CSO | B | 2.3 | 0.9 | 3.5 | 1.4 | +143 | 259 | 0.32 | 140 | 38 | ||
| C | 4.0 | 1.4 | 6.0 | 2.1 | +167 | 66 | 0.03 | 27 | 17 | |||
| 1404+286 | 8 | 8 | A | 0.5 | 0.3 | 0.5 | 0.3 | +162 | 865 | 14 | 2600 | 170 |
| CSO | C | - | 24 | .06 | 57 | 25 | ||||||
| D | - | 7 | .07 | 92 | 32 | |||||||
| 2126-158 | 3 | 10 | A | 0.3 | 0.3 | 1.1 | 1.1 | - | 690 | 74 | 28000 | 550 |
| CJ | B | 1.8 | 0.3 | 6.3 | 1.1 | +8 | 110 | 2.0 | 3500 | 200 | ||
| 2128+048 | 35 | 150 | A | 0.3 | 0.3 | 1.3 | 1.3 | - | 7.4 | 0.35 | 360 | 62 |
| CSO | B | 0.8 | 0.2 | 3.4 | 0.9 | +154 | 54 | 1.5 | 1000 | 110 | ||
| C+Dext | 4 | 4 | 17 | 17 | - | 420 | 0.12 | 44 | 22 | |||
| E | 1.0 | 0.5 | 4.3 | 2.2 | +38 | 10.3 | .09 | 120 | 36 | |||
| 2134+004 | 2 | 8 | A | 0.5 | 0.3 | 2.1 | 1.2 | +135 | 2485 | 110 | 18000 | 440 |
| CJ | B | 1.0 | 0.8 | 4.1 | 3.3 | +41 | 2503 | 21 | 3900 | 210 |
2.1 The spectral indices
The direct comparison between the components found at 5 GHz (paper I) and at 15 GHz is correct only for the components appearing well isolated and compact at both frequencies. Otherwise, the very different UV coverage and spatial resolution introduce a serious bias in the determination of the spectral index distribution. Components which are well resolved at 15 GHz might result in spectral indices artificially steeper than their intrinsic value, due to lower sensitivity to component sizes of the order of a couple of tens of mas, or larger.
In addition, we are interested in locating the core in our objects which is presumed to be compact at both frequencies and have a flat or inverted spectrum. In order to find the cores in our objects we determined the spectral index for isolated and compact components using their fitted flux densities. When this could not be done, we degraded the resolution of the 15 GHz image to allow a direct comparison between the 5 and 15 GHz data, we identified common features which permitted us to align the VLBI images (which do not have absolute astrometry), and we made a spectral index image to locate the region with the flattest spectral index.
We display images showing the spectral index between 5 and 15 GHz as a gray scale superimposed on the contours of the 15 GHz resolution-degraded images, where darker means flatter. This will emphasize the presence of flat components and make it easier to locate the core (should it be present).
In the 15 GHz data, we generally find fewer extended features than in our previous 5 GHz images. This is due to the combined effects of (1) the steep spectral index of the extended components which would require a much better sensitivity at 15 GHz than at 5 GHz (while it is only slightly better) and (2) the lower sensitivity to extended emission caused by a larger gap in the central region of the UV coverage at 15 GHz with respect to the 5 GHz data.
In core-jet quasars, the jet is often very short and it is not possible to clearly resolve them into individual knots and/or to determine their positions. In these cases, the image registration is not very accurate.
2.2 The polarization images
In addition to total intensity images, we present radio polarization data in the form of vectors whose length is proportional to the fractional polarization, and whose direction indicates the position angle of the E-field. At 15 GHz, these orientations are within a few degrees of the intrinsic ones for Rotation Measures below 100 rad/m2. Furthermore, when we comment on the E or B field structure, we assume that differential Faraday Rotation is negligible across the sources, although this might not be the case. We assume that bandwidth depolarization is negligible in our observations because even an RM of 104 rad/m2 would produce only a one degree position angle rotation across the 16 MHz bandpass at 15 GHz.
Linearly polarized emission is detected in all the sources observed, at various percentage levels, depending on the total intensity of components. We cannot detect polarized emission in weak components because of the lack of adequate sensitivity. However, even in the brightest components, the VLBI 15 GHz data still reveal a rather low fractional polarization - a few percent at most.
The highest frequency at which reliable polarization data are available from the VLA (Stanghellini et al. 1998) is 8.4 GHz. We find more polarized emission in our 15 GHz VLBI data as expected if the (lower frequency and lower resolution) VLA data are affected to the combined effects of beam and Faraday depolarization. In fact, beam depolarization should be present in the VLA data due to the gradients in the polarization position angle seen in the VLBI data.
2.3 Comments on individual sources
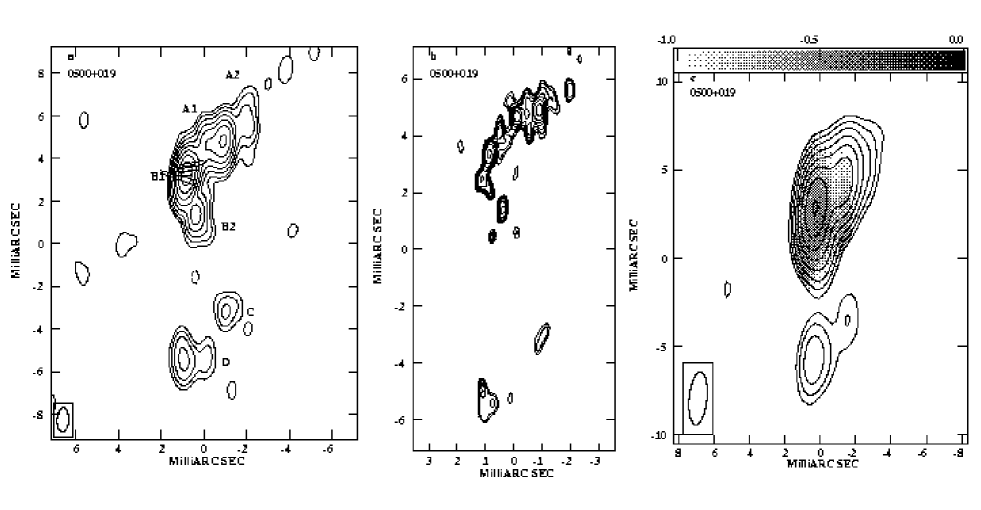
0500+019: we consider the radio source to be associated with a galaxy at rather than a background quasar (cf. Stickel et al. 1996a, and see also paper I for references on individual objects). The radio source is S-shaped as is sometimes found among GPS radio galaxies, with the northern part brighter than the southern part. Polarized emission is detected at a low fractional level ( at the total intensity peak position in p.a. ) only in the brightest component. The VLA total fractional polarization at 5 GHz is below 0.1 (the reference for total fractional polarization here and for the other objects is Stanghellini et al. 1998). The spectral index image shows that a clear flat-spectrum region is not present, the flattest spectral index being close to the brightest component B. The low resolution image does not permit us to separate the contribution of the subcomponents B1 and B2, but we see slightly darker shades just south of the peak intensity on the low resolution image, and we suspect the flattest component is component B2. Therefore, if the core is located in component B2 or close to it, this radio source would be a genuine CSO. This classification is in agreement with the MEM image showing compact subcomponents corresponding to B1 and B2, and extended regions at the edges of the radio source.
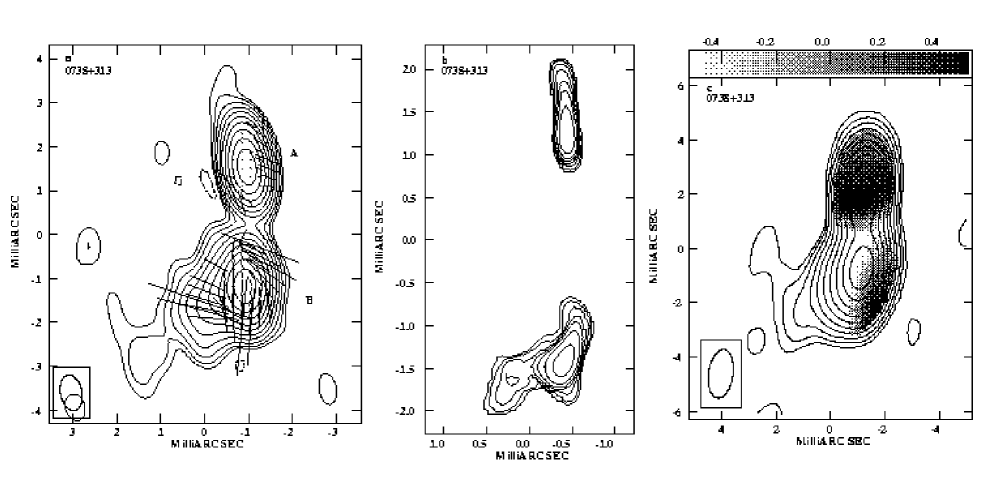
0738+313: our 15 GHz VLBA image is dominated by two strong components. The diffuse emission originating from the southern one and leading towards the SE seen in the 5 GHz image is still present in the 15 GHz image, but is less significant. Component A is weakly polarized (0.5 at the peak position) and has an inverted spectrum, thus it is (or it harbors) the core of the radio source. Component B is 1.5 polarized at the peak position and shows a higher percentage of polarized emission in its boundaries. The magnetic field structure follows the jet orientation, running parallel to the local jet axis from component A to B, then it becomes perpendicular to the source structure in component B where the radio source bends to the SE. The total fractional polarization from VLA observations at 8.4 GHz is 3. The identification of the core makes this object a core-jet radio source. This is also confirmed by the MEM image, with a jet leading to the South and then suddenly bending to the East.
This radio source is known to have an arc-second scale double (or rather triple) morphology, with two weak and diffuse lobes on each side of the compact much stronger component (Stanghellini et al 1998). Extended emission around GPS radio sources is explained as the effect of a reborn or disrupted radio source i.e., a source where a new radio activity is in progress while the relic of the past activity is still present, or a radio source where a sudden increase of the medium density along the path of preexisting jets has interrupted the energy supply to the external lobes (Baum et al. 1990). This explanation can be invoked also for 0738+313 but the fact that we see a core-jet morphology at mas resolution favors the hypothesis that this object is indeed a classical double with a strong boosting of the inner part of the jet.
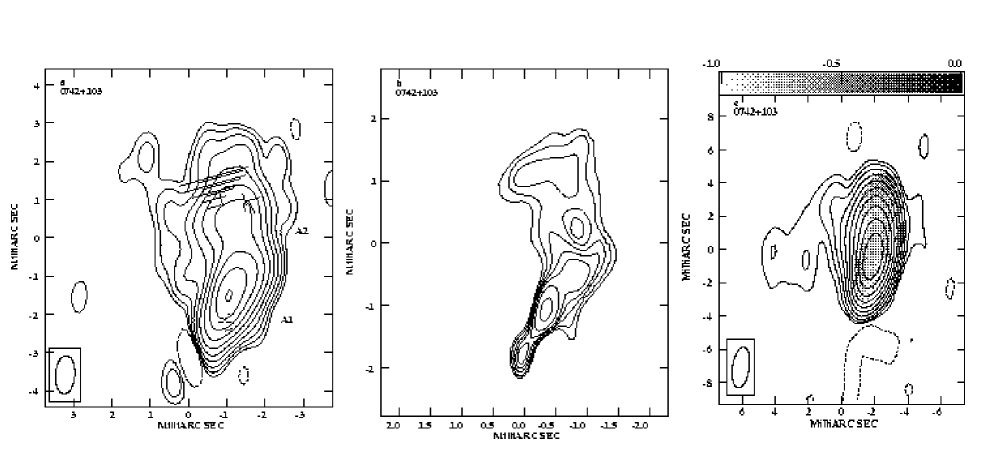
0742+103: the identification of this radio source is uncertain – Stickel et al. (1996b) suggest it is a quasar of magnitude . The 15 GHz image suggests a structure reminiscent of 3C48 although the scale is about 100 times smaller. The MEM image shows a jet leading to NW, then bending to NE and finally widening and bending to the East as confirmed by the 5 GHz image. The spectral index image fails to reveal any flat region which would allow us to locate the core.
Faint polarized emission is detected only on the northern tip, where the jet broadens. The total fractional polarization at 8.4 GHz from VLA data is below 0.1.
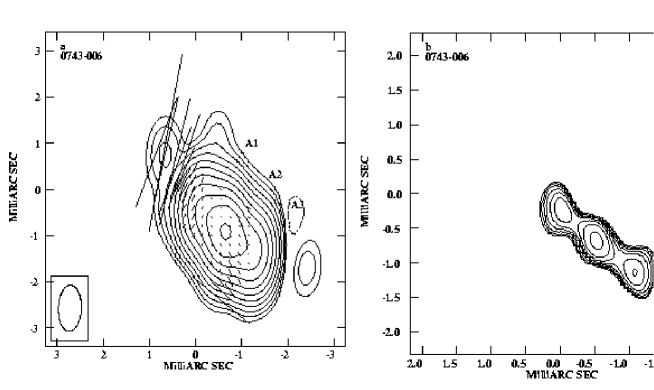
0743-006: the candidate core component visible in the 5 GHz image is seen as an elongated structure in the 15 GHz VLBA image, with just a hint of the 5 GHz NE jet. The MEM image reveals the elongated component as a triple structure (a knotty jet?) and a least-squares fit to the ”cleaned and restored” image provides a good fit with 3 components, with slightly increasing sizes from the southwestern to the northeastern one, suggesting (taking into consideration the morphology seen in the 5 GHz image) the presence of an expanding jet.
The low resolution of the 5 GHz image does not allow us to disentangle the contribution to the flux density of the distinct components, therefore it is not possible to determine if any of the 3 components in the 15 GHz image has a flat spectral index. In this case image registration did not provide a useful result and a spectral index distribution image is not presented. The integrated spectral index between component A in the 5 GHz image and components A1+A2+A3 in the 15 GHz image is .
The radio source is polarized with a polarization percentage of at the peak position in the total intensity image with a transverse magnetic field. The fractional polarization increases towards the NE, also changing its position angle, with an inferred projected magnetic field which becomes parallel to the local source axis. It may be an intrinsic change in position angle, or it might suggest that the core is located at the SW edge of the source: the jet, then, is likely to cross a region of high RM which rotates the apparent field orientation; the RM would rapidly decrease with distance from the core and the NE edge would show the intrinsic field orientation. The total fractional polarization at 8.4 GHz from the VLA is around 1.
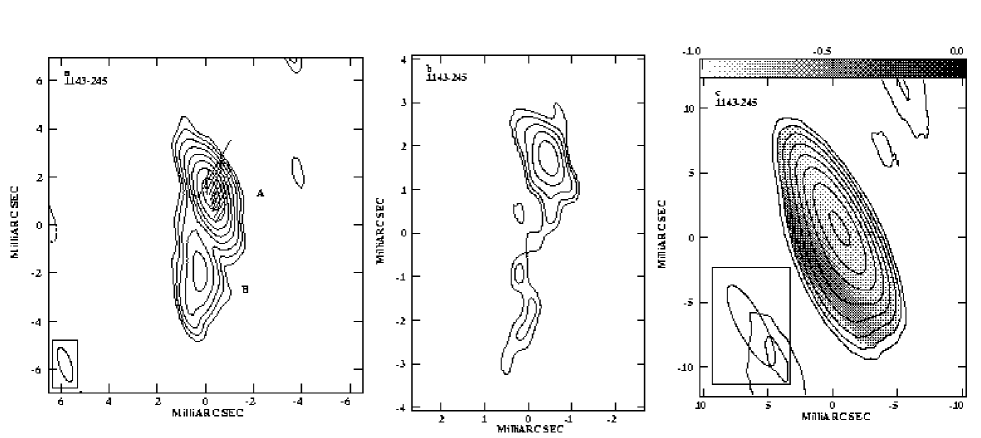
1143-245: the VLBI image at 15 GHz shows a structure roughly in the NS direction extending about 5 mas; both components are resolved by the present observations.
The MEM image reveals a number of further details, with a strong quite compact component and a weak wiggling jet-like structure leading to the South.
The spectral index is not flat in any region of the source, despite its core-jet morphology. As in other similar cases, a possible explanation is that the source experienced significant flux density variability between the 2 epochs, or that the true core is embedded in the brightest component, or that there are errors in the image registration.
The brightest region has significant polarized emission. At the peak position in the total intensity image the fractional polarization is in p.a. . The VLA data show a total fractional polarization of 1.4 at 8.4 GHz.
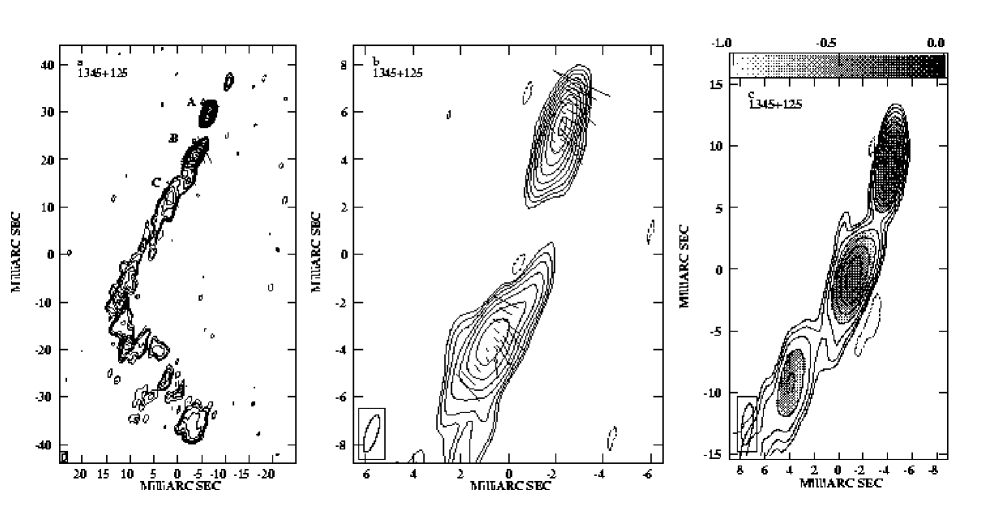
1345+125: the VLBA image at 15 GHz shows the same morphology seen at 5 GHz. A strong compact component and a jet leading SE with some knots, then bending to the SW, and widening into a diffuse lobe which, in the 15 GHz image, is mostly resolved out.
At 15 GHz, we do not detect the weak emission north of component A, which is present in the 5 GHz image. Here, the image registration is relatively easy thanks to the presence of a number of rather isolated, optically thin, knots in the jet.
Component A is the flattest one with , while component B has . Component A is therefore likely to contain the core. The northern side is barely visible at 5 GHz, and while we can assume the jet is relatively beamed towards us making the counter-jet undetectable, it is puzzling that we do not see the counter-lobe.
Polarized emission is detected in the brightest knots with percentage values of in component A, 1 in component B, at the total intensity image peak positions. Total fractional polarization at 8.4 GHz is not detected above 0.1, therefore it is likely that the VLA 8.4 GHz measurement is affected by intrinsic and/or beam depolarization.
Stanghellini et al. (in preparation) find very weak extended emission on the arc-second scale at 1.4 GHz, around the compact radio source, with a morphology similar to the parsec scale structure.
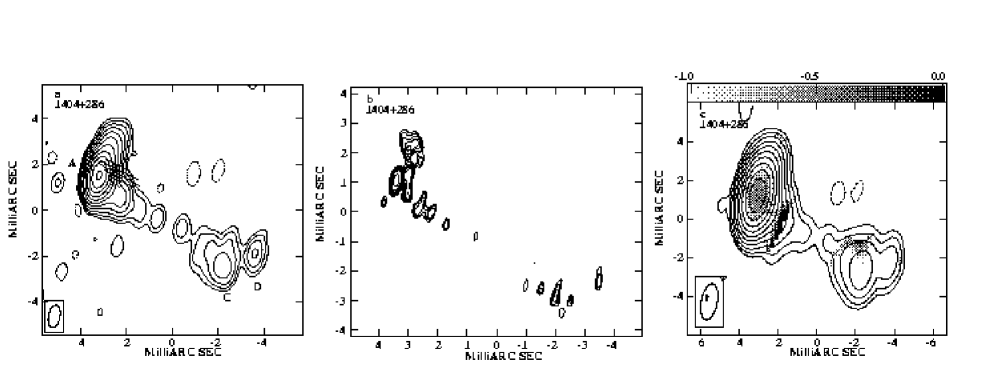
1404+286: in agreement with the 5 GHz image (Stanghellini et al. 1997), the 15 GHz VLBA image shows a rather symmetric morphology with respect to the location of the components, but with a large ratio in flux density between the 2 “sides” of the radio source.
We detect significant radio emission at the center of the whole structure at 15 GHz, as already seen in Kellermann et al. (1998). Due to the limitation in the SNR of the 5 GHz image, the spectral index distribution in the central region could not be determined, but it stands out that this region must have an inverted spectrum, as also confirmed by multi-frequency VLBA observations (Stanghellini et al, in preparation). On the basis of the symmetry in the radio structure, the central weak region (Fig. 8a) is likely to harbor the core and possibly two short jets. The MEM image shows an extended feature at the NE edge and several compact knots very well aligned along the source axis.
Polarized emission is detected at the boundaries of the stronger component, at a local level of several percent, while VLA observations at 8.4 GHz do not detect any polarized emission above 0.2. Gallimore et al. (1999) do not detect the 21 cm HI line in absorption against the radio source. However, Kameno et al. (2000) suggest that the source is free-free absorbed by an ionized medium with electron density cm-3. This medium would be capable of depolarizing the radio source.
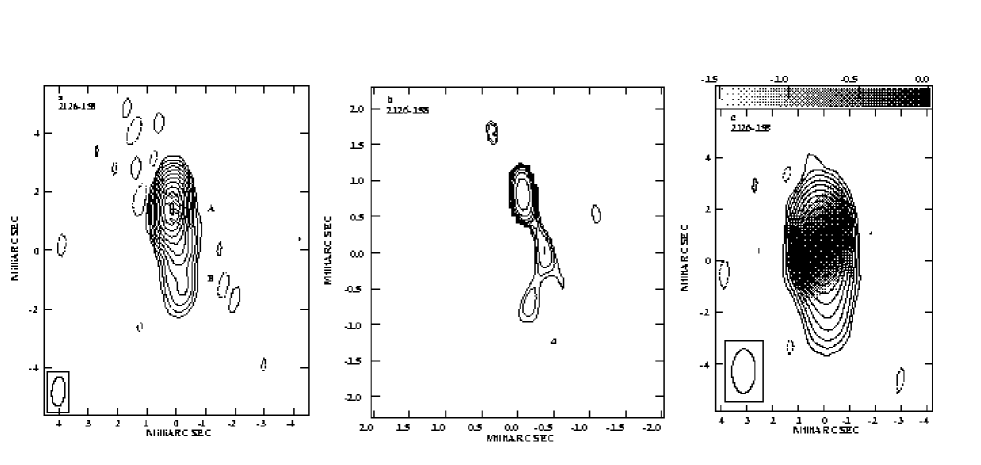
2126-158: our VLBI image shows an elongated NS core-jet structure with a total extension of about 3 mas. The comparison with the 5 GHz image reveals that the peak of the emission has a flat spectrum, and we identify it as the core.
The MEM image shows a weak jet emerging from the core and leading with a curved trajectory to the South. The spot on the opposite side of the core may be an artifact but the 5 GHz image also shows a hint of emission in that direction, so it is also possible in this source we detect traces of a counter-jet.
The core region is polarized at p.a. , while the total fractional polarization at 8.4 GHz is below 0.2.
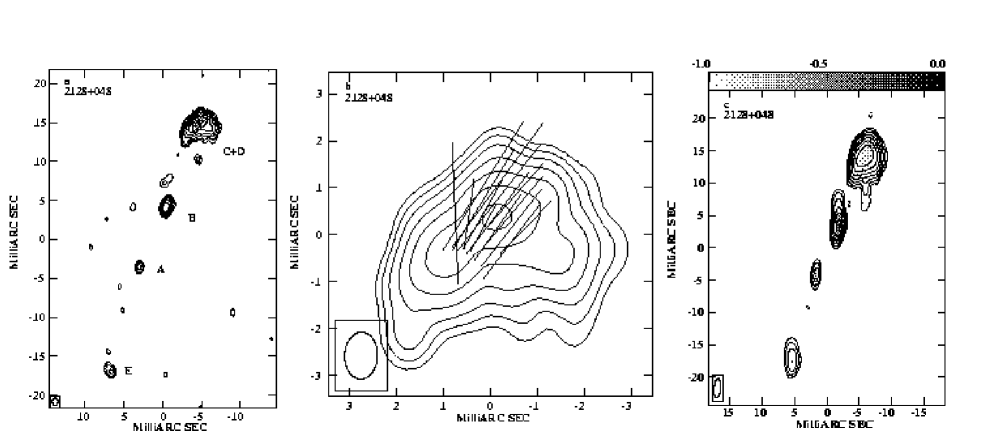
2128+048: the 15 GHz VLBA image shows an aligned structure with four main components at approximately P.A. . The outer components are more resolved than the inner ones though the southernmost is rather weak.
The comparison with the 5 GHz image indicates that there are no really flat spectrum components. Component B seems to have the flattest spectral index region reaching , but this may be caused by poor alignment (which has been done using component A) between 5 and 15 GHz. The spectral index using the integrated flux densities does not provide any further indication of the location of the core, with for component A, and for component B, suggesting they are likely knots in a jet. However, based on morphology we can reasonably identify the outer components as the hot spots, and the radio source as a CSO.
Polarized emission is detected above the 5 r.m.s. noise only in the northern component (CD) at a level and with an inferred magnetic field perpendicular (E-vector P.A. ) to the source axis as expected in a typical hot-spot, where the magnetic field lines are compressed against the shock front. VLA observations at 8.4 GHz do not detect any polarized emission above 0.2.
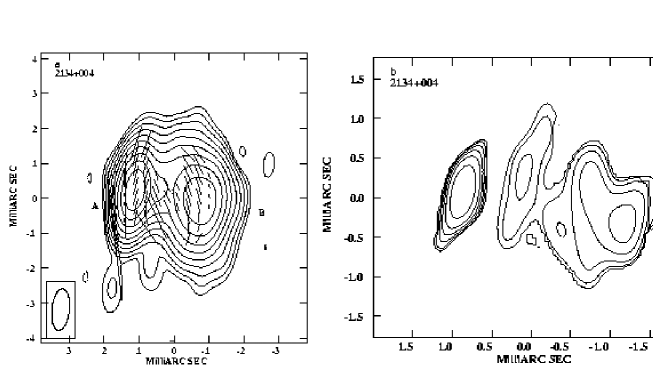
2134+004: the VLBI image at 15 GHz has a double structure just a few resolution elements across the source. The least-squared fit on the components suggests that the eastern component is more compact, in agreement with the MEM image, which also suggests another weak middle component. Due to the strong variability of radio flux density for this object (see references in Stanghellini et al 1998) we tentatively classify this source as a core-jet source with the core being the more compact eastern component. The VLBA image at 8.4 GHz shown by Fey et al. (1996) is consistent with our view.
Polarization emission is detected in both components at a level of , while the total fractional polarization at 8.4 GHz is 0.5. The B field has a rather complicated structure and indicates that beam depolarization may still play a role even at this frequency/resolution.
3 Discussion
3.1 Polarization
Our 15 GHz VLBI observations detect local low polarization in the GPS sources - at most a few percent and typically less than one percent. Thus, it seems that GPS radio sources on the parsec scale are characterized by intrinsically low fractional polarization.
The low polarization could be due to high Faraday rotation measures if the sources are interacting with, ionizing, and entraining a dense ambient medium (e.g., O’Dea, Baum & Stanghellini 1991; Bicknell, Dopita & O’Dea 1997; Begelman 1999). Another possibility is that there is a foreground screen not directly associated with the radio source, e.g., a disk (as suggested for 0108+388 - Marr, Taylor & Crawford 2000).
Alternatively, the low polarization might imply the presence of a very tangled magnetic field structure which is not resolved by these data. We note that the GPS radio sources are less polarized than the extended (tens of kpc) radio sources, even for a similar number of resolution elements across the source. This suggests that the scale size of the magnetic field inhomogeneities is a smaller fraction of the source size in the GPS sources and does not scale linearly as the sources expand.
3.2 Cores
We have combined our 5 and 15 GHz observations to determine the spectral index structure of the sources and one of the outstanding issues has been the properties of the “cores” of the GPS sources. These are faint even in several quasars, and thus are hard to characterize. The cores in the GPS galaxies are very difficult to locate either because they are too faint to be clearly detected, or because they do not have a very flat spectrum.
In general, it seems difficult to detect the cores in GPS radio galaxies and other CSOs: Peck and Taylor (2000) in a sample of 21 CSO or CSO candidate were able to identify a core in only 6 objects, and 2 of the 6 components identified as cores have a spectral index steeper than -0.5. We also note that Snellen et al. (2000) in their sample of faint GPS radio sources detect cores in only 3 CSOs, while in 11 objects they detect only two steep spectrum components and classify these objects Compact Doubles (CD).
We conclude that the cores contribute in general only a moderate amount to the source luminosity. This is implied also by the high frequency total spectra which allow only a limited amount of flux density from a flat or inverted spectrum component.
The core flux density can be predicted to be a few or a fraction of percent for quasars and galaxies respectively, if they follow the well known Pcore-Ptot relation found for extended, steep spectrum powerful radio sources (e.g., Giovannini et al. 1988; Zirbel & Baum 1995; see also Fanti et al. 1990 for the core fractional luminosity in CSS). Thus, although we do not find cores in some of the symmetric sources, we nevertheless classify them as CSOs based on their overall morphology, e.g., the presence of features which appear to be two lobes on either side of the source’s (invisible) core.
Also perhaps surprisingly, the cores in some quasars tend to be fairly weak. In the images of several GPS quasars shown here the core does not dominate the radio emission.
In only two sources (0738+313 and 2126-158) do we find a clear case of flat or inverted spectrum components, which we identify with the source core. In both cases the source has a one-sided core-jet structure. In the other sources we find at most a flattish spectrum component( -0.5-0.3) which might contain the core embedded in unresolved transparent spectrum emission. In a couple of cases, the evidence for the core is based on compactness of the candidate component (1143-245, 2134+004). In the case of 0742+103 and 0743-006 the radio emission seems dominated by a one-sided jet, with the core emission absent or just a small fraction of the total flux density.
The low flux density variability of GPS radio sources, quasars included (with some exceptions, see Stanghellini et al. 1998) is consistent with the absence or weakness of the cores, where the flux density variability is expected to occur.
3.3 Morphology
In paper I and II we have shown that GPS radio galaxies preferentially tend to have symmetric pc-scale radio morphologies (i.e., they are CSOs) while the GPS quasars seem to typically have core-jet structures. GPS quasar and galaxies still show different morphologies, but the higher resolution of the 15 GHz images, together with the spectral information makes the classification of the GPS quasars as core-jet radio sources somewhat too simplistic, since the cores are often hidden or missing, and we only detect the presence of a more or less complex jet-like structure.
The GPS quasars could be those objects where the radio emission is not dominated by the core alone, but exhibit a significant amount of emission from one or a few knots in a moderately beamed jet. These knots may correspond to the place of a shock front where the electron are re-accelerated (possibly 0742+103, 0743-006) or a place in an helical jet where the bulk flow is directed toward the observer (possibly 0738+313) enhancing its brightness by moderate relativistic beaming (the highest brightness temperature found is of the order of in 2134+004, below the limit of for un-beamed objects - cf. Readhead 1994).
We found inner components which have somewhat flatter spectra than the rest of the radio structure. These might indicate the locations of the cores. The modest flattening of the spectra could be due to blending of the cores with nearby steeper spectrum ”jet” material because of our resolution, which is rather modest in relation to the total source size for most objects.
Other explanations are also possible. a) The characteristics of GPS quasars may depend just on a particular geometric configuration which partially or completely obscures the flat spectrum core, leaving the emission from a particular region of the jet as the dominant contribution. b) It is possible that the cores are obscured in the radio by free-free or synchrotron self-absorption. c) It could be that the cores in the GPS sources are just not as flat as seen in the more strongly beamed radio source. d) It is possible we do not see the ”true” core because it is beamed away from us; indeed this could partly be a selection effect due to the optically thin spectral index, which favors QSOs oriented at relatively large angles.
Here we suggest a possible scenario based on the observed phenomenology within the context of the current Unified Scheme (Browne 1983; Antonucci & Ulvestad 1985; Urry & Padovani 1995). It seems likely that the objects in which the cores are not beamed towards us will appear as GPS galaxies, while those which are moderately beamed will appear to be GPS quasars, while those which are very strongly beamed should be flat spectrum radio sources and will not be identified as GPS at all. This has two implications. (1) We will not identify some compact and possibly young quasars as GPS if they are strongly beamed. However the number of those which are strongly beamed is a very small fraction of the population. (2) The presence of beaming in the quasars will influence the redshift distribution and cause it to be different than that of the GPS galaxies (e.g., O’Dea 1998; Snellen et al. 1998, 1999).
3.4 Wiggles in the Jets and Binary Black Holes
Roughly 5-10% of the GPS galaxies in the complete sample show evidence for wiggles or S-shaped symmetry in their radio jets (e.g., 0108+388, 0500+019, 1345+125, 2210+016, and 2352+495). This might be due to precession of the radio axis due to the influence of a second Black Hole (BH). We now believe that massive BHs are present in essentially all normal galaxies (e.g., Ferrarese & Merritt 2000). We also believe that nuclear activity is triggered through galaxy interaction and merging (e.g., Heckman et al. 1986). When galaxies merge, their BHs will form a relatively long lived binary with separation in the range pc (e.g., Begelman, Blandford & Rees 1980; Milosavlejic & Merritt 2001). The second BH can influence the orientation of the radio jet and induce wiggles through (1) orbital motion of the active BH (e.g., Roos, Kaastra & Hummel 1993), (2) geodetic precession of the active BH spin axis (Roos et al. 1993), or (3) tidally induced precession of the accretion disk of the active BH (Romero et al. 2000).
For example, 0500+019 shows a wiggle with a wavelength mas ( pc). Assuming the jet outflow is relativistic, the period is yr which is roughly consistent with geodetic precession of the active BH spin axis.
4 Conclusions
We present VLBA observations at 15 GHz of 10 GPS radio sources.
We detect very low polarization in the GPS sources – i.e., typically less than a few percent and often less than one percent. This establishes that low polarization of the parsec scale structure is an important defining characteristic of the GPS sources.
We find that in several quasars the cores do not dominate the radio emission even at this relatively high frequency and/or do not have a particularly flat spectrum. The cores are difficult to detect in the radio galaxies and may also have an unusually rather steep radio spectrum. Alternately the lack of dominant cores could be due to the fact the the GPS quasars are at intermediate angles to the line of sight and so are only moderately beamed. We suggest that if the quasars were in fact strongly beamed, they would not be identified as GPS sources.
These observations confirm a dichotomy in the morphological classification, as galaxies tend to be symmetric while quasars are not – with the presence of cores confirmed in only some sources previously considered to be simple core-jet radio sources.
Acknowledgements.
C.S. wishes to thank the STScI Collaborative Visitor Program for providing support for his visits. We have made use of the NASA/IPAC Extragalactic Database, operated by the Jet Propulsion Laboratory, California Institute of Technology, under contract with NASA. The National Radio Astronomy Observatory is a facility of the National Science Foundation operated under cooperative agreement by Associated Universities, Inc.References
- (1) Akujor, C.E., Porcas, R.W., & Smoker, J.V. 1996, A&A, 306, 391
- (2) Antonucci, R. R. J., & Ulvestad, J. S. 1985, ApJ, 294, 158
- (3) Baum, S.A., O’Dea, C.P., Murphy, D.W., & de Bruyn, A.G. 1990, A&A, 232, 19
- (4) Begelman, M.C., Blandford, R.D., & Rees, M.J. 1980, Nature, 287, 307
- (5) Begelman, M.C. 1999, In Proceedings of “The Most Distant Radio Galaxies”, eds, H. J. A. Röttgering, P. N. Best, & M. D. Lehnert (Royal Netherlands Academy of Arts and Sciences, Amsterdam), p. 173
- (6) Bicknell, G., Dopita, M.A., & O’Dea, C.P. 1997, ApJ, 485, 112
- (7) Browne, I.W.A. 1983, MNRAS, 204, 23P
- (8) Clark, B.G. 1973, Proc. IEEE 61, 1242
- (9) Conway, J.E., Myers, S.T., Pearson, T.J., Readhead, A.C. S., Unwin, S.C., & Xu, W. 1994, ApJ 425, 568
- (10) Dallacasa, D., Fanti, C., Fanti, R., Schilizzi, R.T., & Spencer, R.E. 1995, A&A, 295, 27
- (11) de Vries, W.H., Barthel, P.D., & Hes R. 1995, A&AS 114, 259
- (12) Fanti, R., Fanti, C., Schilizzi, R.T., Spencer, R.E., Nan Rendong, Parma, P., van Breugel, W.J.M., & Venturi, T. 1990, A&A 231, 333
- (13) Fanti, C. 2000, Proceedings of the 5th European VLBI Network Symposium (2000), held at Chalmers Technical University, June 29th - July 1st, 2000. Edited by: J.E. Conway, A.G. Polatidis, R.S. Booth and Y. Pihlström. Published Onsala Space Observatory. ISBN 91-631-0548-9
- (14) Ferrarese, L., & Merritt, D. 2000, ApJ, 539, L9
- (15) Fey, A.L., Clegg, A.W., Fomalont, E.B. 1996, ApJS, 105, 299
- (16) Gallimore, J.F., Baum, S.A., O’Dea, C.P., Pedlar, A., & Brinks, E. 1999, ApJ, 524, 684
- (17) Giovannini, G., Feretti, L., Gregorini, L., & Parma P. 1988, A&A, 199, 73
- (18) Heckman, T.M., Smith, E.P., Baum, S.A., van Breugel, W.J.M., Miley, G.K., Illingworth, G.D., Bothun, G.D., & Balick, G. 1986, ApJ, 311, 526
- (19) Hewitt, A., Burbidge, G. 1993, ApJS, 87, 451
- (20) Kameno, S., Horiuchi, S., Shen, Z., Inoue, M., Kobayashi, H., Hirabayashi, H., & Murata, Y. 2000, PASJ, 52, 209
- (21) Kellermann, K.I., Vermeulen, R.C., Zensus J.A., & Cohen M.H. 1998, AJ, 115, 1295
- (22) Marr, J.M., Taylor, G.B., & Crawford, F. III., in “Astrophysical Phenomena Revealed by Space VLBI”, Proceedings of the VSOP Symposium, held at the Institute of Space and astronautical Science, Sagamihara, Kanagawa, Japan, January 19 - 21, 2000, Eds.: H. Hirabayashi, P.G. Edwards, and D.W. Murphy, Published by the Institute of Space and Astronautical Science, p. 91-94.
- (23) Meisenheimer, K., & Röser, H.-J. 1983, A&AS, 51, 41
- (24) Milosavljevic, M., & Merritt, D., 2001, preprint
- (25) Mutel, R.L., Hodges, M.W., & Phillips, R.B. 1985, ApJ, 290, 86
- (26) O’Dea, C. 1998, PASP, 110, 493
- (27) O’Dea, C.P., Baum, S.A. 1997, AJ, 113, 148
- (28) O’Dea, C.P., Baum, S.A., Stanghellini, C., Morris, G.B., Patnaik, A., & Gopal–Krishna 1990a, A&AS, 84, 549
- (29) O’Dea, C.P., Baum, S.A, & Morris, G.B. 1990b, A&AS, 82, 261
- (30) O’Dea, C.P., Baum, S.A., & Stanghellini, C. 1991, ApJ, 380, 66
- (31) O’Dea, C.P., Stanghellini, C., Baum, S.A.,& Charlot S. 1996, ApJ 470, 806
- (32) Owsianik, I., Conway, J.E., & Polatidis, A.G. 1998, A&A, 336, L37
- (33) Owsianik, I. & Conway, J.E. 1998, A&A, 337, 69
- (34) Peck, A.B., & Taylor, G.B. 2000, ApJ, 534, 90
- (35) Phillips, R.B., & Mutel, R.L. 1982, A&A, 106, 21
- (36) Readhead, A.C.S. 1994, ApJ, 426, 51
- (37) Readhead, A.C.S., Taylor, G.B., Xu, W., Pearson, T.J., Wilkinson, P.N., & Polatidis, A.G. 1996a, ApJ, 460, 612
- (38) Readhead, A.C.S., Taylor, G.B., Pearson, T.J., & Wilkinson, P.N. 1996b, ApJ, 460, 634
- (39) Romero, G.E., Chajet, L., Abraham, Z., & Fan, J. H., 2000, A&A, 360, 57
- (40) Roos, N., Kaastra, J.S., & Hummell, C.A. 1993, ApJ, 409, 130
- (41) Rudnick, L. & Jones, T.W. 1982, ApJ, 255, 39
- (42) Rusk, R.E. 1988, PhD Dissertation, Univ. of Toronto
- (43) Shaffer, D.B., Kellermann, K.I., & Cornwell, T.J. 1999, ApJ, 515, 558
- (44) Snellen, I. 1997, PhD Thesis, Univ. of Leiden
- (45) Snellen, I.A.G., Schilizzi, R.T., De Bruyn, A.G., & Miley, G.K. 1998, A&A, 333, 70
- (46) Snellen, I.A.G., Schilizzi, R.T., Bremer, M.N., Miley, G.K., de Bruyn, A.G., & Röttgering, H.J.A. 1999, MNRAS 307, 149
- (47) Snellen, I.A.G., Schilizzi, R.T., & Langevelde, H.J. 2000, MNRAS, 319, 429
- (48) Spoelstra, T.A.T., Patnaik, A.R., & Gopal-Krishna 1985, A&A, 152, 38
- (49) Stanghellini, C., Baum, S.A., O’Dea, C.P., & Morris, G.B. 1990, A&A, 233, 379
- (50) Stanghellini, C., O’Dea, C.P., Baum, S.A., & Laurikainen, E. 1993, ApJS, 88, 1
- (51) Stanghellini, C., Dallacasa, D., O’Dea, C.P., Baum, S.A., Fanti, R., & Fanti, C. 1996, in Proceedings of the Second Workshop on Gigahertz Peaked Spectrum and Compact Steep Spectrum Radio Sources, eds. Snellen, I. A. G., Schilizzi, R. T., Röttgering, H. J. A., & Bremer, M. N., (Leiden, Leiden Observatory), p. 4
- (52) Stanghellini, C., O’Dea, C.P., Baum, S.A., Dallacasa, D., Fanti, R., & Fanti, C. 1997a, A&A, 325, 943
- (53) Stanghellini, C., Bondi, M., Dallacasa, D., O’Dea, C.P., Baum, S.A., Fanti, R., & Fanti, C. 1997b, A&A, 318, 376
- (54) Stanghellini, C., O’Dea, C.P., Dallacasa, D., Baum, S.A., Fanti, R., & Fanti, C. 1998, A&AS, 131, 303
- (55) Stanghellini, C., O’Dea, C.P., & Murphy, D.W. 1999, A&AS, 134, 309
- (56) Stickel, M., & Kühr, H. 1992, A&AS, 100, 395
- (57) Stickel, M., & Kühr H. 1993, A&AS, 101, 521
- (58) Stickel, M., Rieke, M.J., Rieke, G.H., & Kühr H. 1996a A&A, 306, 49
- (59) Stickel, M., Rieke, G.H., Kühr, H., & Rieke, M.J 1996b ApJ, 468, 556
- (60) Taylor, G.B., Readhead, A.C.S., & Pearson, T.J. 1996, ApJ, 463, 95
- (61) Taylor, G.B., Vermeulen, R.C., Pearson, T.J., Readhead, A.C.S., Henstock, D.R., Browne, I.W.A., & Wilkinson, P.N. 1994, ApJS, 95, 345
- (62) Taylor, G.B., Marr, J.M., Pearson, T.J., & Readhead, A.C.S. 2000, ApJ, 541, 112
- (63) Tschager, W., Schilizzi, R.T., Röttgering, H.J.A., Snellen, I.A.G., & Miley, G.K. 2000, A&A, 360, 887
- (64) Urry, C.M., & Padovani, P. 1995, PASP, 107, 803
- (65) Xu, X., Readhead, A.C.S., Pearson, T.J., Polatidis, A.G., & Wilkinson, P.N. 1995, ApJS 99, 297
- (66) Wilkinson, P.N., Polatidis, A.G., Readhead, A.C.S., Xu, W., & Pearson, T.J. 1994, ApJ, 432, L87
- (67) Zirbel, E.L., & Baum, S.A. 1995, ApJ, 448, 521