Molecular and Ionic shocks in the Supernova Remnant 3C 391
Abstract
New observations of the supernova remnant 3C 391 are presented in the near-infrared, using the H2 2.12 m and [Fe II] 1.64 m narrow-band filters in the Prime Focus Infrared Camera on the Palomar Observatory Hale telescope, and in the mid-infrared, using the circular-variable filters in the ISOCAM on the Infrared Space Observatory. Shocked H2 emission was detected from the region 3C 391:BML ( size), where broad millimeter CO and CS lines had previously been detected. A small H2 clump, 45′′ from the main body of 3C 391:BML, was confirmed to have broad CO emission, demonstrating that the near-infrared H2 images can trace previously undetected molecular shocks. The [Fe II] emission has a significantly different distribution, being brightest in the bright radio bar, at the interface between the supernova remnant and the giant molecular cloud, and following filaments in the radio shell. The near-infrared [Fe II] and the mid-infrared 12–18 m filter (dominated by [Ne II] and [Ne III] images are the first images to reveal the radiative shell of 3C 391. The mid-infrared spectrum is dominated by bright ionic lines of [Fe II] 5.5 m, [Ar II] 6.9 m, [Ne II] 12.8 m, and [Ne III] 15.5 m, as well as the series of pure rotational lines of H2 S(2) through S(7). There are no aromatic hydrocarbons associated with the shocks, nor is their any mid-infrared continuum, suggesting that macromolecules and very small grains are destroyed in the shocks. Comparing 3C 391 to the better-studied IC 443, both remnants have molecular- and ionic-dominated regions; for 3C 391, the ionic-dominated region is the interface into the giant molecular cloud, showing that the main bodies of giant molecular clouds contain significant regions with densities to cm-3 and a small filling factor of higher-density regions. The broad-molecular line region 3C 391:BML was imaged in the 1-0 S(1) line at resolution. The molecular shocked region resolves into 16 clumps of H2 emission, with some fainter diffuse emission but with no associated near-infrared continuum sources. One of the clumps is coincident with a previously-detected OH 1720 MHz maser to within our 0.3′′ astrometry. These clumps are interpreted as a cluster of pre-stellar, dense molecular cores that are presently being shocked by the supernova blast wave.
1 Introduction
The number of supernova remnants known to be interacting with molecular clouds has increased over the last few years from one single example, IC 443 (Denoyer, 1979; White, Rainey, Hayashi, & Kaifu, 1987), to six: IC 443, W 51C (Koo & Moon, 1997), 3C 391 (Reach & Rho, 1999), W 44 (Seta et al., 1998) and W 28 (Arikawa et al., 1999), HB 21 (G89.0+4.7) (Koo et al., 2001). The strong observational evidence for interactions includes broad CO lines, bright far-infrared lines, or OH masers. Other evidence can be infrared cooling lines from H2, OH, and CO tracing regions that are both hot and dense (Reach & Rho, 2000; Rho et al., 2001). The growing number of molecular interacting supernova remnants provides critical laboratories to study shock physics and comparison of the strong supernova shocks with other shocks in astrophysical objects such as wind shocks and outflows. How the shocks develop around clouds and how shocks affect molecular cloud evolution are not well understood. Chevalier (1999) considered two density regimes (cloud and intercloud) for the pre-shock gas. The observed infrared lines require, in addition to the intercloud medium, shocks into gas with both moderate (102 cm-3) and high ( 104 cm-3) pre-shock densities. The results suggest that an ensemble of different shocks develops on small scales, due to the high contrasts in density.
In the case of IC 443, studies have shown that there are two types of shocks, but at any given place within the remnant, only a single type of shock is evident (Rho et al., 2001). The 2MASS image of IC 443 shows a striking contrast in near-infrared color between the south (where the shock is impacting dense molecular gas) and the northeast (where the shock is impacting lower-density material). The northeast rim is mostly [Fe II] line emission in the near-infrared, with strong [O I] and other ionic lines in the mid- and far-infrared, consistent with a J-shock with a shock velocity of 100 km s-1 and a pre-shock density of order cm-3. In contrast, the southern ridge is dominated by H2 line emission exhibiting a clumped and knotty structure. A surprising result is that no atomic lines were not detected from the southern ridge in recent ISOCAM observations (Cesarsky, D. et al., 1999). The ISOCAM observations are consistent with a pure C-shock with a low shock velocity of 30 km s-1 and a dense medium (104 cm-3). Because IC 443 is a uniquely well-studied molecular-interacting remnant, it is not clear whether the interstellar medium conditions were special around the IC 443 progenitor (recently located by Olbert et al. (2001)), or whether the strong variations in pre-shock conditions are characteristic of the environments of Type 2 supernovae.
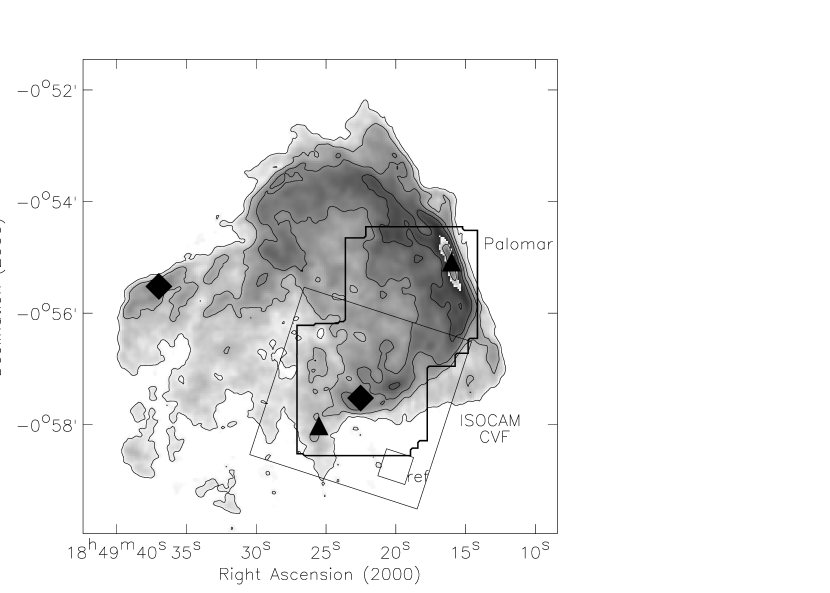
In this paper, we look in some detail at the morphology of molecular and ionic shocks in the supernova remnant 3C 391 (G31.9+0.0). Figure 1 shows the radio image of 3C 391. The remnant has a distinctive ‘breakout’ radio morphology, suggesting that it has struck a region of significantly higher density northwest of the explosion site (Reynolds & Moffett, 1993). The X-ray emission is contained within the radio shell, making 3C 391 one of the new class of ‘mixed-morphology’ remnants with bright radio shells surrounding diffuse, central, thermal X-rays (Rho & Petre, 1996, 1998). Millimeter-wave CO observations revealed that there is indeed a giant molecular cloud to the northwest of the remnant and at a rotation-curve distance consistent with the estimated distance of the remnant (Wilner, Reynolds, & Moffett, 1998). Two OH 1720 MHz masers were detected from 3C 391, suggesting that in at least two places the shock may be interacting with molecular gas (Frail et al., 1996). The remnant is so bright in the [O I] line that it appears that relatively dense shocks are present both toward the OH masers and the bright radio bar (Reach & Rho, 1996). One of the OH masers was found to be included in a region of broad CS and CO lines, clearly revealing the shocked gas, but somewhat mysteriously only revealing it from a small region in the southern part of the remnant; this ‘broad molecular line’ region is called 3C 391:BML (Reach & Rho, 1999).
The nature of 3C 391:BML is unknown because it has not been imaged with sufficient resolution. Based on the millimeter-wave observations ( beam), a high cloud pressure was inferred, suggesting gravitational compression is needed to keep the cloud from rapidly dissipating; the self-gravity also suggests imminent collapse (Reach & Rho, 1999). The detection of far-infrared emission from H2O, CO, and OH, in an beam, further suggested the presence of high-density gas. But neither the structure of the cloud (highly fragmented or monolithic) nor the chemistry (diffuse gas with low H2O abundance, or smaller clumps with the predicted high H2O post-shock abundance) could be resolved. The new observations presented in this paper explore the distribution of shocked molecular and ionized gas, using spatially-resolved spectroscopy and narrow-band imaging, revealing dramatic color differences between the different parts of the remnant, and uncovering a cluster of pre-stellar molecular cores in 3C 391:BML.
2 Observations
The primary observations for this paper are two sets of images, one made with the Infrared Space Observatory and the other with Palomar 200′′ telescope. Figure 1 illustrates the regions we observed, in the context of the entire supernova remnant, as traced by the radio image (Reynolds & Moffett, 1993). There are also two ‘geographical’ landmarks in the region covered, to which we will often refer. First is the location of the radio-bright bar, at the northwestern edge of the remnant where the shock is impinging on the front of a molecular cloud (Wilner, Reynolds, & Moffett, 1998); the location of the radio peak is clear in Fig. 1. Second is the location of the southern OH maser (Frail et al., 1996), indicated by a in Fig. 1, where the shock is impinging on a dense clump (Reach & Rho, 1999).
2.1 Infrared Space Observatory
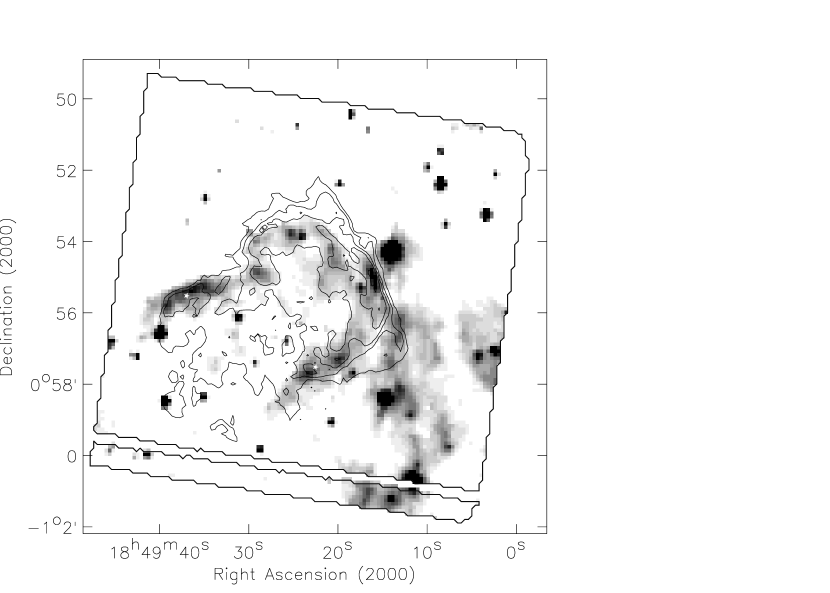
Observations of 3C 391 were made using the Infrared Space Observatory (Kessler et al., 1996) mid-infrared camera ISOCAM (Cesarsky, C. et al., 1996a) through a variety of filters, in order to determine the morphology and physical origin of infrared emission from 3C 391. ISOCAM is a pixel array, and we selected the 6′′ pixel field of view to get a large, un-vignetted field of view. First, on April 11, 1997, an image of the entire remnant was made in the wide LW3 (12–18 m) filter. The mosaic was made with a raster of pointings separated by 80′′, which is much smaller than the 192′′ instantaneous field of view to provide redundancy. At each pointing, a set of 7 frames of 2.1 sec duration were taken, providing another level of redundancy. The observation lasted 36 minutes. Cosmic rays were identified (and masked) using a temporal high-pass filter, and the pixel-to-pixel gain was determined from the un-registered median of all of the images; both steps make use of the high level of redundancy in the data. Figure 2 shows the 12–18 m image, which covers the entire remnant and is dominated by remnant emission and about 100 stars. The IRAS data for 3C 391 are hopelessly contaminated by stars, such as the very bright star just outside the radio bar, which swamp the remnant at low angular and spectral resolution. The ISOCAM image shows that mid-infrared emission from 3C 391 generally follows the radio shell. The nature of the 12–18 m emission from the remnant is discussed below in §5.
There is an extension of diffuse 12–18 m emission, extending southward from the radio bar, toward lower right of Figure 2. It is not clear whether this extension is related to the remnant, although it appears, from the 12–18 m image alone, to be connected to it. The extension does not have associated radio emission, so it is well outside what we thought of as the boundary of the remnant. Instead, the extension may be a photodissociation region on the surface of the same molecular cloud with which the remnant is interacting; in this case the emission would be due to aromatic hydrocarbons and fine structure lines of [Ne II] and [Ne III].
Having demonstrated that 3C 391 is a bright mid-infrared source, we returned to 3C 391 on November 3, 1997, to obtain a complete set of images with the circular-variable filter (CVF). The goal was to discern what is the emission mechanism: lines or continuum. For these CVF observations, only a single field of view (192′′) was observed, centered on the location of the bright OH maser and wide CO lines. The observation proceeded by setting the filter wheel near the highest wavelength of the long-wavelength CVF [16.14 m], taking 12 frames of 2.1 sec duration, moving down to the next step of the long-wavelength CVF [16.05 m], etc., until near the end of the long-wavelength CVF [10.09 m; 69 steps] then setting the filter wheel near the highest wavelength of the next CVF [9.986 m] and until near the end of this CVF [5.14 m; 81 steps]. The entire CVF observation took 68 minutes to complete. The data were reduced using the same methods described in another recent paper (Reach et al., 2000). A correction was applied to remove the transient gain variations, based on the IAS method (Abergel et al., 1996), which led to typically % changes in the surface brightness, with % changes at wavelengths where there are sharp changes in the surface brightness. Before we applied the transient gain correction, there were some differences between the spectra taking in the increasing and decreasing wavelength directions, due to subtle differences in the time constants of the detectors; these remain problematic only around the 6.2 and 11.3 m PAH features. The final reduction yielded a cube of spatial pixels (with one column dead) unique wavelengths. The spectral passband of each CVF step is 0.33 m wide at 16 m, 0.27 m wide at 10 m; 0.21 m wide at 9 m, and 0.14 m wide at 5.2 m.
| species | transition | ||||
|---|---|---|---|---|---|
| (m) | (erg s-1 cm-2sr-1) | ||||
| ISOCAMb | |||||
| Ne++ | 15.56 | 2.11 | 2.56 | ||
| Ne+ | 12.81 | 2.89 | 3.95 | ||
| H2 | 0-0 S(2) | 12.28 | 1.07 | 1.46 | |
| H2 | 0-0 S(3) | 9.66 | 1.89 | 6.39 | |
| H2 | 0-0 S(4) | 8.03 | 2.45 | 3.66 | |
| Ar+ | 6.99 | 4.87 | 6.00 | ||
| H2 | 0-0 S(5) | 6.91 | 9.84 | 12.13 | |
| H2 | 0-0 S(6) | 6.11 | 3.82 | 4.79 | |
| H2 | 0-0 S(7) | 5.51 | 6.21 | 8.06 | |
| Fe+ | 5.34 | 3.91 | 5.08 | ||
| Palomarc | |||||
| H2 | 1-0 S(1) | 2.12 | 2.1 | 14.5 | |
| Fe+ | 1.64 | 3.0 | 40d | ||
a Surface brightness observed is , and corrected for extinction () is
b Brightness in the peak pixel of the CVF image of 3C 391:BML
c For H2, brightness of typical clumps in 3C 391:BML; for Fe+, brightness averaged over the radio bar.
d This value is uncertain because the extinction correction for the near-infrared [Fe II] line is large.
The spectrum of the shocked gas was separated from that of the foreground emission as follows. Figure 3 shows the spectra of the molecular peak and a reference position. Figure 4 shows the difference between the spectrum toward the peak of the line emission and the reference spectrum. The reference spectrum removes unrelated, foreground and background, emission from the remnant spectra. Most of the observed surface brightness is effectively removed by taking the difference, because most of the surface brightness is due to smooth, foreground emission from the zodiacal light (which is extremely smooth) and the diffuse galactic emission. The difference spectrum is completely dominated by narrow spectral features, including 5 bright lines of H2 and 4 bright atomic fine-structure lines. All of the features in this spectrum, brighter than 10 MJy sr-1 can be identified with known atomic and molecular spectral lines, except for the ‘wiggle’ near 11.3 m which is a residual subtraction error from the bright galactic feature at that wavelength.
Table 1 lists the line brightnesses from the ISOCAM data. The line brightnesses were measured from the same spectrum shown in Figure 4, using the spectral response profiles of the circular variable filter. The extinction toward 3C 391 is very high, owing to its location in the galactic plane and its great distance. Spectral analysis of the X-ray data yielded a foreground column density of 2– cm-2, with the higher numbers applying in the northwestern region (Rho & Petre, 1996). The X-ray-derived column densities are probably on the low size, as they are averages over relatively large regions. Thus, we will use a nominal foreground column density of cm-2, corresponding to a visual extinction of mag. Each line brightness was then corrected for extinction (Rieke & Lebofsky, 1985), and the corrected values are listed in the last column of Table 1.


The mid-infrared spectrum of an ionic shock in 3C 391 can be separated form that of the molecular shock, because the molecular shock is spatially confined only to the 3C 391:BML region. Figure 5 shows the ISOCAM CVF spectrum, after subtracting the reference spectrum outside the remnant, of a single pixel, at 18h49m25.5s, -00∘ 58′ 01′′ (see Fig. 1) that is on the radio shell but away from the molecular region. Comparing this spectrum to Fig. 4, we see that the ionic shock is completely different from the molecular shock, which is only away. The very different spectral shapes confirm our identification of the blended [Fe II] and H2 lines near 5.5 m as well as the blended [Ar II] and H2 lines near 6.9 m. In both cases, the line shifts (and dims) from the blended lines (in Fig. 4) to the ionic contribution only (in Fig. 5).
2.2 Palomar Observatory
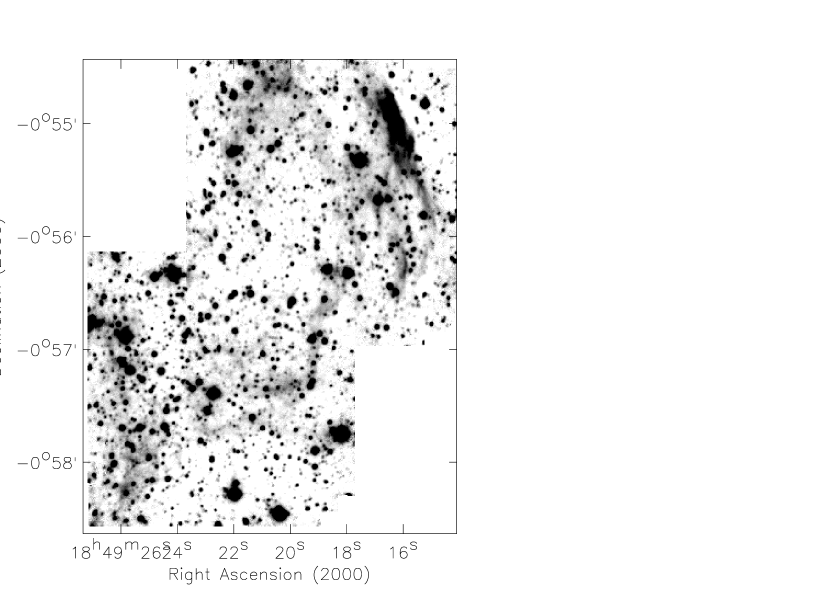
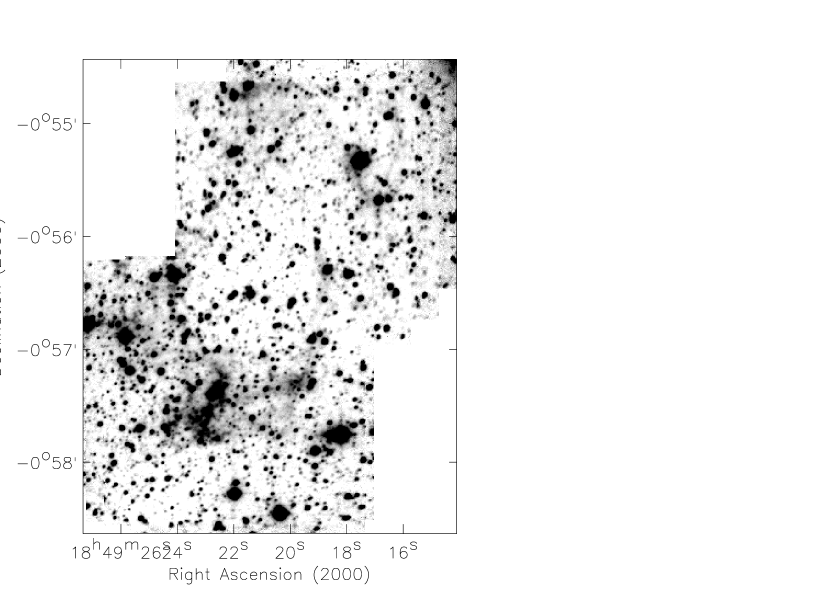
On July 16-17, 2000, we observed 3C 391 using the Prime Focus Infrared Camera (PFIRCAM) on the Hale 200-inch telescope on Mount Palomar. The PFIRCAM has a pixel array, with a pixel scale of 0.494′′ at the f/3.3 prime focus of the 200-inch telescope. The seeing was fair during these observations, ranging from 1.3′′ to 2′′. In order to remove temporally varying sky emission, we beam-switched between the remnant and a nearby reference position, shifting by small dithers for each on-off pair. The ‘reference’ position was chosen by inspecting the 2MASS images and finding a local minimum in the density of bright stars; it was then adjusted at the telescope to further avoid bright stars. The dithered ‘reference’ observations were combined to generate a median sky image, which was subtracted from the ‘on’ observations. The sky-subtracted ‘on’ observations were then combined into the final mosaic images. Figures 6 and 7 show the PFIRCAM images of 3C 391 in two filters: [Fe II] 1.644 m and H2 S(1) 2.12 m.
The astrometry and absolute calibration of the PFIRCAM 200-inch images were determined by comparison with the Point Source Catalog of the 2 Micron All-Sky Survey, 2MASS (Skrutskie, 1999). The 2MASS astrometry is accurate to 0.2′′, and the photometry is accurate to 5%. The rms deviations between the astrometric solutions and the 2MASS catalog for 12 stars are 0.08′′ for the H2 image and 0.12′′ for the [Fe II] image. The absolute calibration of the images was determined as follows. First, the flux density per data number (DN) was determined for stars fainter than 0.2 Jy using the average flux density (from the 2MASS catalog) per integrated DN in the PFIRCAM image. The surface brightness of a single pixel is then determined from the raw image DN using , where is the pixel solid angle. Table 2 gives the filter bandwidths, . The calibration factor, , was determined using a least-squares fit between the Palomar and 2MASS photometry; for the H2 image, we used 61 stars with Ks magnitudes 9.5–12, and for the [Fe II] image, we used 58 stars with H magnitudes 10.2–13.1. Table 2 summarizes the calibration parameters. Our absolute calibration scheme is different from the common usage of ‘standard stars’ observed occasionally during the night and compared to standard references. Instead, the 2MASS data form a set of standards distributed widely across the sky and absolutely calibrated 111For details, see the 2MASS Explanatory Supplement, Cutri et al., currently available at http://www.ipac.caltech.edu/2mass/releases/second/doc/explsup.html. The obvious advantage of our scheme is that the calibration data (stars) and the target data (diffuse emission) were taken in the exact same manner along the same path through the atmosphere. The weather was not completely clear (high-altitude haze for part of the night) while taking the H2 data, but our absolute calibration will still be accurate. All near-infrared observations of fields containing 2MASS sources are therefore ‘photometric’ and can be absolutely calibrated.
| filter | ||||
|---|---|---|---|---|
| (m) | (Jy/DN) | (erg s-1 cm-2 sr-1 DN-1) | ||
| H2 | 2.12 | 1% | 2.05 | |
| [Fe II] | 1.644 | 1% | 1.59 | |
| H2 cont | 2.19 | 1% | 1.18 | … |
While writing this paper, we obtained two near-infrared spectra of 3C 391 using the CORMASS instrument (Wilson et al., 2001) on the Palomar 60′′ telescope. These spectra were calibrated by comparing the observed brightness of the detected spectral lines to the narrow-band images from the 200′′ of the same location. These spectra clearly illustrate which are the dominant emission lines in the near-infrared. Figure 8 shows the spectra toward the radio peak (top panel) and the OH maser (bottom panel). Comparing these two spectra clearly demonstrates that the location of bright [Fe II] in Fig. 6 is completely dominated by Fe, while the location of bright H2 in Fig. 7 is completely dominated by H2, with negligible continuum in the narrow-band filters. Further, the two spectral lines we observed with PFIRCAM are, by far, the brightest lines in the H and K near-infrared bands.

3 Comparison of Molecular and Ionic images
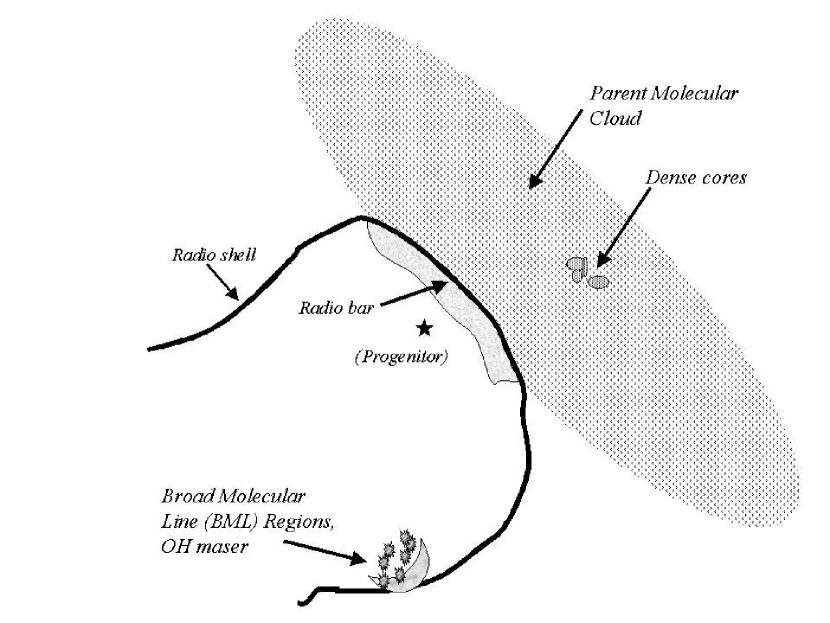
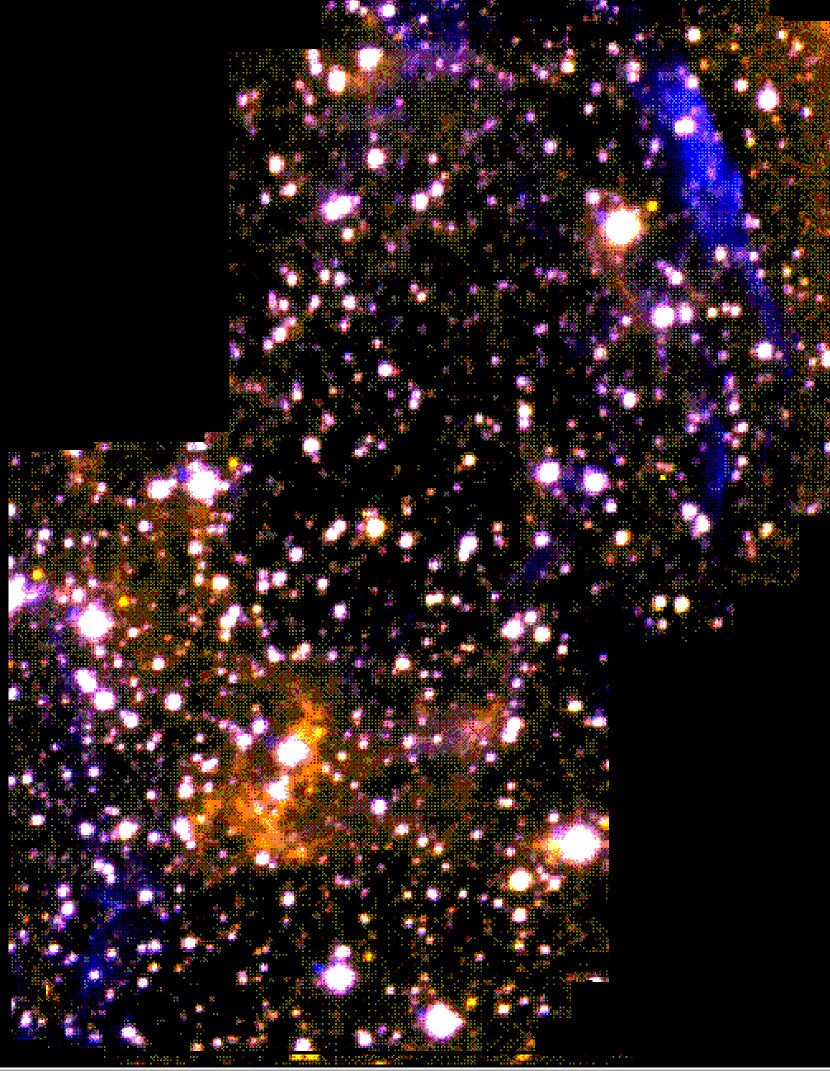
The most straightforward result of our observations is that the molecular and ionic emission comes from different regions. Figure 9 is a schematic indicating the locations of the different ‘geographic features’ in 3C 391 to which we will refer in this and the following sections. Figure 10 shows a false color image using the Palomar [Fe II] and H2 images. The [Fe II] emission is closely associated with the bright radio bar in the northwestern part of the remnant, with the [Fe II] bar fitting precisely into an intensity contour of the radio map. The other [Fe II] filaments in the northwestern area are also associated with radio ridges. The H2 emission arises predominantly from a clump in the southeastern portion of the image. The H2 emission is unfortunately centered near a bright star, and the seeing was not optimal for our observations; however, the extended H2 nebula can be clearly seen. On the angular scale of a few arcsec ( pc), the molecular and ionic shocks are essentially exclusive of each other.
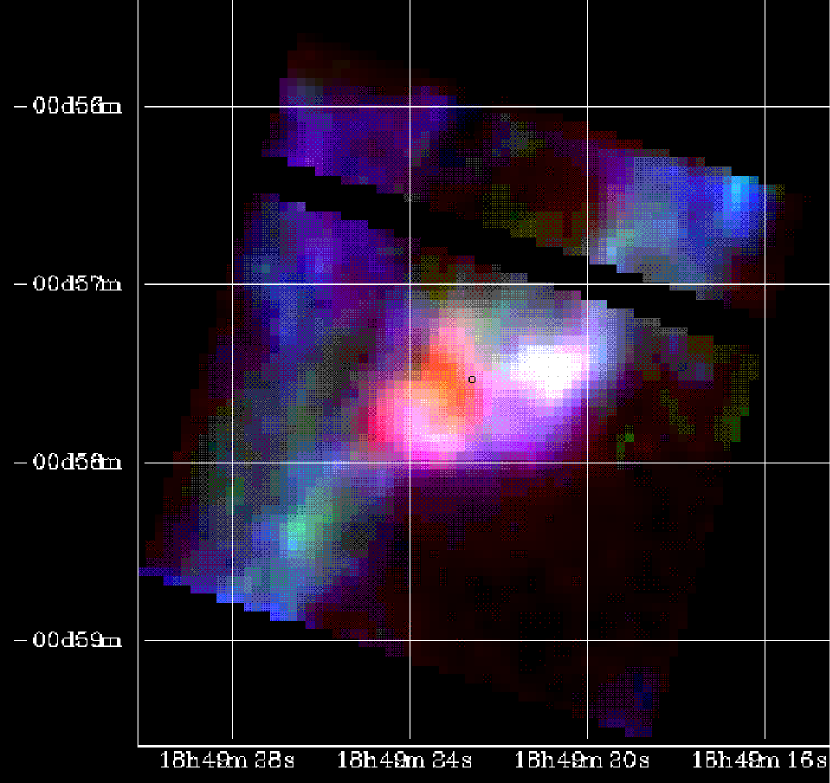
The ISO images further demonstrate differences between molecular and ionic shocks. Figure 11 shows a false color combination of three emission-line images from the ISOCAM CVF data. These mid-infrared images are significantly cleaner than the near-infrared images because stars are so much fainter in the mid-infrared, while the energy levels producing the emission lines are generally closer to ground state and more easily excited in the dense cooling layers behind the shock front. It is clear that the H2 emission arises from a resolved region near the center of the ISOCAM images. The [Fe II], [Ne II], and [Ne III] images are very similar to each other, but they are very different from the H2 images. The ionic lines follow the radio shell and a radio filament that rises northward from the H2 clump. The ionic emission actually has a small ‘cavity’ at the location of the H2 clump, as if part of the material that would have made the ionic shell is instead making the H2 clump. This configuration is not the most obvious one, for the ionic shocks are significantly faster and should leave the dense, molecular clumps behind. The projected location of the H2 clump close to the edge of the remnant suggests that the H2 clump has only recently been shocked: given ionic shock speeds of order 100 km s-1, and displacements between the molecular clump and ionic shock less than 10′′ (0.4 pc), the shock front first encountered the molecular clump less than 4000 yr before the light we are observing was emitted. The age of the remnant is thought to be only a few times greater than 4000 yr, so when we say that the H2 shock was recent, we only mean that it was in the last of the lifetime of the remnant.
The new results presented in this paper complement previous results from far- and mid-infrared spectroscopy (Reach & Rho, 2000). The spectroscopic results showed that H2 and ionic emission were both very bright and both coming from the same general location in 3C 391. However, at the angular resolution of the spectrometers that were used (ISO LWS: 80′′, SWS: ), regions with very different physical properties were lumped together. The ISOCAM image clearly resolves the ionic emission from the molecular emission toward 3C 391:BML. The 3C 391:BML position was the only position (out of the sample toward 3C 391, W 44, and W 28) for which a multiple far-infrared molecular emission lines (CO, OH, and H2O) were detected (Reach & Rho, 1998), and it is the only position within the remnant 3C 391 toward which broad molecular lines were detected (Reach & Rho, 1999). The Palomar image shows that the molecular emission is mostly confined to the 3C 391:BML region, and that the ionic emission is bright only in the northwest radio bar. The ISO SWS spectrum toward the radio bar was the only one (out of the sample toward 3C 391, W 44, and W 28) that showed higher-excitation emission from [O IV]. Thus, while the spectroscopic results implied pre-shock regions of drastically different physical conditions, the new imaging observations clearly demonstrate the separation of these regions and prove that the blast wave is propagating into a highly heterogeneous interstellar medium.
4 Molecular shocks
The 3C 391 supernova remnant is near the surface of a molecular cloud, with a bright radio bar that is very nearly tangent to that surface (Wilner, Reynolds, & Moffett, 1998). One of the relatively surprising results of our infrared observations of 3C 391 is that the brightest molecular emission does not arise from the interface with the parent molecular cloud. The millimeter-wave observations led to a similar conclusion, because the CO and CS emission lines near the radio bar have such narrow velocity widths and low excitation that they look like quiescent, ambient gas. It would be hard to hide shocked molecular gas from both the infrared and millimeter-wave observations. Thus, it appears that the shocks at the interface between the remnant and the molecular cloud are nearly completely dissociative: the molecules are destroyed and the dust grains partially vaporized (but not turned into molecules). In the following subsections we will discuss the shock-excited molecular gas, and in the next section we will return to the ionic shocks and their relationship to the parent molecular cloud.
4.1 Comparison of near-infrared and millimeter-wave images
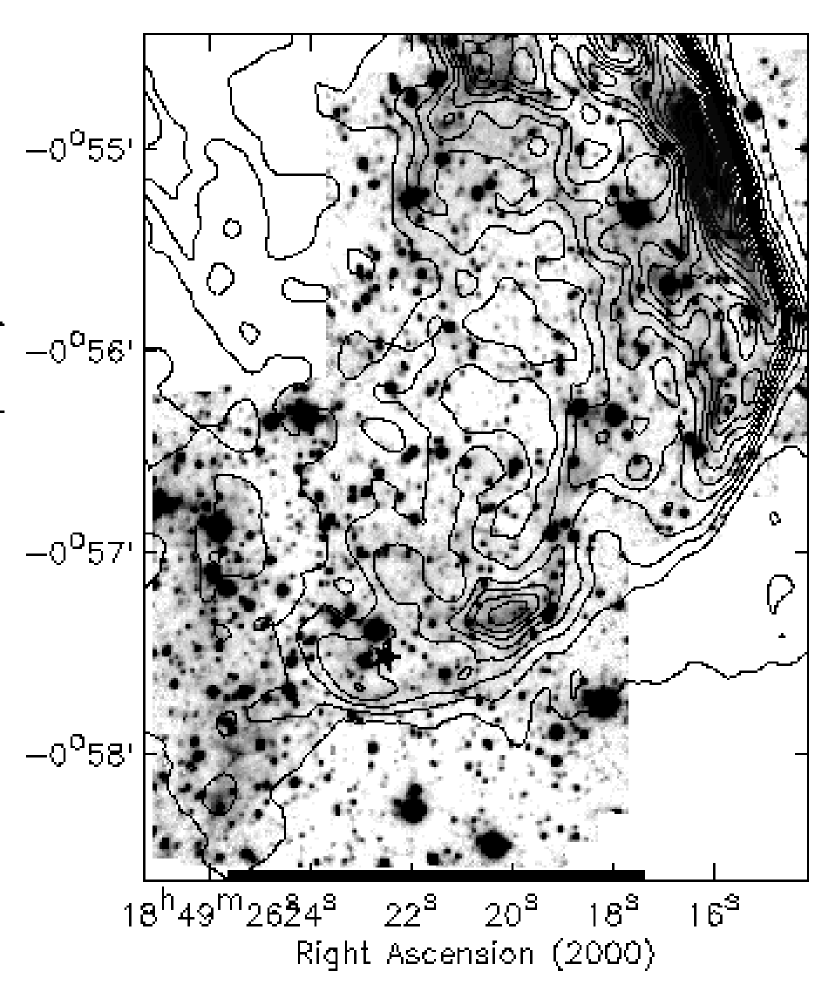
The location, size, and shape of the region that produces the mid-infrared H2 lines are the same as the region that produces the broad millimeter-wave lines in 3C 391:BML. Figure 12 shows a contour map of the near-infrared H2 emission with the continuum (stars) subtracted. For ease of quantitative comparison, the coordinates are expressed as offsets from the same position used to offset the IRAM 30-m telescope. Comparing to Fig. 5 of Reach & Rho (1999), all of the pointings of the IRAM 30-m telescope that showed wide CO(2-1) emission also show bright H2 emission. The millimeter-wave observations were sensitive both to shock-excited gas and cold gas, and they showed a peak in both the broad-line and narrow-line gas emission. The broad-line emission follows the H2 emission, at the angular resolution of the CO() data. The narrow-line gas is located immediately to the southeast of the broad-line region, centered at relative offsets , just off the lower left corner of Fig. 12 in a region with no H2 emission. This is consistent with the broad-line gas being shock-excited, while the narrow-line gas is unshocked, ambient gas. Further, since it appears that the hot H2 emission (seen in the ISOCAM and PFIRCAM images) arises from the same location as the broad-line millimeter emission, the shock must have heated the molecules without destroying them.
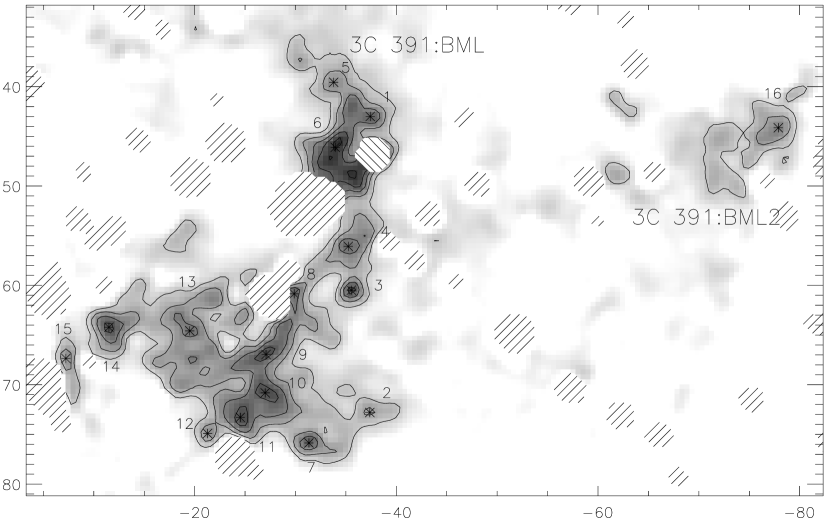
4.2 Morphology of the shocked H2
Looking at the near-infrared image in more detail, it is evident that the shocked H2 emission breaks up into a relatively structured, clumpy distribution. In Figure 12, the emitting region is very structured on the angular scale of the previous spectroscopy, and appears to show clumping down to the limit of the atmospheric seeing during our observation. We will refer to the entire H2-emitting nebula in Fig. 12 as 3C 391:BML (which is coincident with the shocked broad-molecular-line region in Figs. 5 and 6 of Reach & Rho (1999)). The main body of this nebula is irregularly shaped, in size, with a geometric center around (J2000). The individual clumps in the nebula are labeled in Figure 12 from 1 through 16, and we will refer, e.g. to ‘clump 7’ as ‘3C 391:BMLH2 7.’
To verify that the faint emission is real and correlated with molecular emission, we examined a small region of H2 emission, 3C 391:BMLH2 16. The ISOCAM CVF spectrum of this clump reveals bright mid-infrared H2 lines together with ionic lines. In the color ISOCAM image, 3C 391:BMLH2 16 is along an [Fe II] filament but also a peak in the H2 image; therefore, it appears white in Figure 11. In Fig. 10, 3C 391:BMLH2 16 appears more blue than the main body of 3C 391:BML, because of the brighter [Fe II] from the former. 3C 391:BMLH2 16 is outside the region where broad molecular line emission was previously noticed, so we derived the CO() spectrum from the previously published observations (Reach & Rho, 1999). Figure 13 shows that there is indeed broad-line emission from 3C 391:BMLH2 16. The broad-line emission is 10 times fainter than brighter parts of 3C 391:BML, but its line width is comparable. Considering that the H2 emission from 3C 391:BMLH2 16 is fainter and the clump is diluted in the beam of the IRAM 30-m telescope (used to make the CO spectra), it is not surprising that the broad-line emission is fainter than for the main body of 3C 391:BML. The comparable CO line widths suggest that the shocks being driven into the two molecular clouds are similar. The centroids of the broad molecular lines are somewhat different, with the main body of 3C 391:BML redshifted by approximately 6 km s-1 with respect to 3C 391:BMLH2 16; the redshift is most likely due to a somewhat different angle of the shock front with respect to the line of sight. The ability of the H2 image to predict the presence of broad molecular lines, as confirmed by the detection of 3C 391:BMLH2 16, shows that shocked H2 emission is a practical tracer of dense molecular shocks.

Table 3 lists the 16 main peaks of H2 emission, together with their central intensities and major and minor axes. The clumps are resolved in at least one dimension, with a typical size of order 0.1 pc. The clumps in our list account for most but not all of the H2 emission. At the angular resolution of our observations, the morphology of the H2 emission is different from that of shocks into lower-density gas: the H2 is clumpy, while the [Fe II] emission is filamentary. For most supernova remnants, the optical emission is filamentary. The special morphology of the H2 emission reflects the distinct physical properties of the pre-shock gas. While most supernova shocks seen in optical and radio images propagate into gas with density cm-3, the shocks in 3C 391:BML are propagating into regions of much higher pre-shock density, with cm-3 (Reach & Rho, 2000).
| clump | RA,Dec | Major | Minor | |||
|---|---|---|---|---|---|---|
| (J2000) | (pc) | (pc) | (erg s-1 cm-2 sr-1) | () | () | |
| 1 | 18 49 22.4 -00 57 14.7 | 0.086 | 0.065 | 0.82 | 0.06 | 0.79 |
| 2 | 18 49 22.5 -00 57 44.3 | 0.108 | 0.065 | 0.86 | 0.08 | 1.03 |
| 3 | 18 49 22.6 -00 57 32.0 | 0.065 | 0.043 | 1.54 | 0.06 | 0.74 |
| 4 | 18 49 22.6 -00 57 27.6 | 0.151 | 0.065 | 0.66 | 0.08 | 1.11 |
| 5 | 18 49 22.6 -00 57 11.2 | 0.086 | 0.086 | 0.55 | 0.05 | 0.70 |
| 6 | 18 49 22.6 -00 57 17.7 | 0.108 | 0.086 | 0.93 | 0.11 | 1.48 |
| 7 | 18 49 22.9 -00 57 47.1 | 0.129 | 0.108 | 0.95 | 0.17 | 2.27 |
| 8 | 18 49 22.9 -00 57 32.2 | 0.129 | 0.108 | 1.51 | 0.27 | 3.64 |
| 9 | 18 49 23.1 -00 57 38.2 | 0.129 | 0.065 | 0.83 | 0.09 | 1.20 |
| 10 | 18 49 23.1 -00 57 42.0 | 0.129 | 0.086 | 1.82 | 0.26 | 3.49 |
| 11 | 18 49 23.3 -00 57 44.4 | 0.108 | 0.108 | 1.87 | 0.28 | 3.74 |
| 12 | 18 49 23.5 -00 57 45.9 | 0.108 | 0.086 | 0.72 | 0.09 | 1.15 |
| 13 | 18 49 23.6 -00 57 35.7 | 0.151 | 0.086 | 0.57 | 0.10 | 1.28 |
| 14 | 18 49 24.1 -00 57 35.1 | 0.172 | 0.172 | 0.70 | 0.27 | 3.59 |
| 15 | 18 49 24.4 -00 57 38.1 | 0.129 | 0.065 | 1.01 | 0.11 | 1.45 |
| 16 | 18 49 19.7 -00 57 16.9 | 0.127 | 0.086 | 1.62 | 0.23 | 3.05 |
The clumps in our H2 image are probably are dense cores that have survived the passage of the blast wave. The clump masses were estimated from the observed brightness of the 2.12 m line using a 10-level model for the H2 molecule over a range of densities and with kinetic temperature 1300 K (derived in the next section); the results can be approximated by
| (1) |
where is the clump angular diameter at the 9 kpc distance assumed for 3C 391. The total clump mass can be higher than our calculated mass because the near-infrared line only detects the excited H2 and not the dense, cold H2 in the centers of the clumps. Analysis of the excitation of broad-line CS emission implied that the density of the mm-wave emitting region is cm-3 (Reach & Rho, 1999). A clump with diameter would therefore have a mass of 0.6 , comparable to the properties inferred from the H2 observations, suggesting that we have resolved the mm-wave emitting regions. The clumps in Table 12 would be gravitationally bound if their internal turbulent motions were less than km s-1, which is typical for quiescent gas. Thus the pre-shock clumps were likely self-gravitating.
4.3 Implications for star formation
It appears that the shock front passing through 3C 391:BML has uncovered a set of pre-stellar cores. We say that the cores are ‘pre-stellar’ because, even though they appear centrally condensed in the H2 image, there are no stars at the core locations: in the 2.19 m continuum image, there are no stars down to K magnitude 15 (1 mJy). And in the mid-infrared (12–18 m) continuum image, there are no stars down to 10 mJy. Embedded stars would need very high K-band extinctions but low 12–18 m flux. Thus, the cores probably do not harbor young stars.
The fate of these prestellar cores, after having been perturbed by the supernova shock, is worth considering in detail, because many star-forming molecular clouds will suffer internal or surface supernova explosions. The outer layers of the dense cores will be stripped by the ram pressure of the shock. Balancing the ram-pressure force, , versus the gravitational force binding a thick layer with radius from the center,, we find a stripping radius of
| (2) |
where is the supernova energy in units of erg, is radius of the (assumed adiabatic) remnant in units of 10 pc, and is the mass of the clump. The stripped radius is comparable to the observed size of the clumps, which is consistent with the hypothesis that the clumps are gravitationally bound cores stripped of their outer layers. The stripped radii are smaller than the apparent outer edges of unshocked pre-stellar cores inferred from mid-infrared extinction measurements (Bacmann et al., 2000). Clumps encountered earlier in the remnant evolution would be even more stripped or completely distorted, to become a shocked filament rather than retaining integrity as a core. For the surviving clumps, with the outer layers gone, the accretion onto the central core will slow, perhaps stunting the development of the star.
If a core has a radial density profile proportional to , then the observed masses () and radii ( cm) suggest densities of order cm-3. The lifetime estimates for pre-stellar cores of this density are of order yr (André, Ward-Thompson, & Barsony, 2000), longer than the remnant age and consistent with the idea that the several observed cores were in an intermediate, pre-stellar phase at the time of the supernova. If the pre-shock cores were already gravitationally bound, they may have been already collapsing in the center, with the outer parts supported by turbulence and magnetic field. The magnetic field and angular momentum of the outer layers would be swept away, so the pre-stellar core would no longer be as coupled to its surroundings as it would be if it had not been shocked. The net effect on the star formation potential of the shocked cores could be rather subtle, as a very dense central core may be relatively immune to the effects of a supernova shock. This topic deserves theoretical treatment, as it concerns the connection between environmental effects and star formation in the not-uncommon situation of molecular cores within 10 pc of a supernova explosion.
One of the H2 peaks, 3C 391:BMLH2 3, is precisely at the position of one of the two OH 1720 MHz masers in 3C 391 (Frail et al., 1996). The astrometry was determined using a set of 12 stars from the 2MASS catalog, and we checked for local distortion by precisely measuring the offset from the bright star near the center of 3C 391:BML. The astrometric accuracy and the radio-infrared offset are both smaller than . The H2 peak associated with the OH maser appears to be resolved into a round clump with a FWHM of . (In the 1% H2 filter, the clump brightness is equivalent to a magnitude 15.6 star, while in a broad Ks filter, the clump would be equivalent to magnitude 18.5.) This ‘maser clump’ accounts for only % of the entire H2 luminosity of 3C 391:BML. Thus, while the OH 1720 MHz masers are ‘signposts’ of molecular shock fronts (Frail & Mitchell, 1998), the OH masers are not one-to-one tracers of molecular shocks. Not all molecular shocks give rise to OH masers—other clumps that appear similar to 3C 391:BMLH2 3 (the ‘maser clump’) do not have bright, mased OH emission. Our observations may offer some clues to the nature of the OH 1720 MHz masers. If our interpretation of the H2 clumps is correct, then the 1720 MHz masers may be features of protostars or pre-stellar cores that were partially uncovered by the shocks. The precise combination of physical conditions required to make a 1720 MHz OH maser may occur in specific layer (or region) in the atmospheres of pre-stellar, shocked cores; indeed, OH masers are known to be signposts of star formation (Gaume & Mutel, 1987).
4.4 Excitation of H2
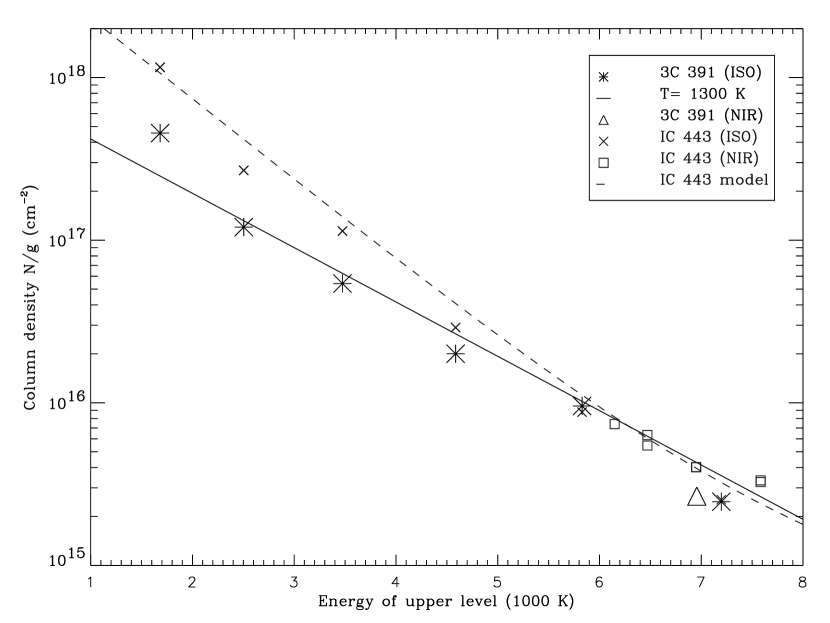
The 6 lines of H2 that were detected in the ISOCAM data span a range of upper level energies lying 1682 to 7197 K above ground, so they sample warm, collisionally-excited gas recently heated by shocks. Figure 14 shows the upper-level column densities for each of the observed lines, after correcting for extinction. The populations of levels 2000 K and higher above the ground state are well approximated by local thermodynamic equilibrium (LTE) at 1300 K with a warm H2 column density of cm-2. Some support for our extinction estimate is that the S(3) line fits nicely in Figure 14; this line is at 9.66 m and is extinguished by the silicate feature of the interstellar extinction curve. Regarding the ortho-to-para ratio, the ISOCAM spectrum includes 3 transitions of para-H2 and 3 lines of ortho-H2 (asterisks in Fig. 14). Both ortho and para transitions fall along the same trend in Fig. 14, so the ortho-to-para ratio is close to 3.
The excitation of the near-infrared line is somewhat less than predicted by a single-temperature LTE model. In LTE, a model that matches the brightness of the 0-0 S(7) line would accurately predict the brightness of the 1-0 S(1) line, because their upper energy levels are very close. However, the critical density for the upper level of the 1-0 S(1) line is cm-3, an order of magnitude larger than that of the 0-0 S(7) line, so the 1-0 S(1) line may be subthermally excited. We calculated the excitation of the 10 lowest levels of H2 using the excitation rate coefficients for H2-H2 collisions as approximated by Draine et al. (1983); the results show that gas with K and cm-3 could explain the observed excitation of the levels between 2000 and 8000 K above ground, including the levels that produce the near-infrared line.
A single-temperature model cannot explain all the observed line brightnesses: the models miss the lowest-energy line by a factor of 2. Therefore, the single-temperature models under-predict the H2 column density. For the bright, well-observed remnant IC 443, a two-temperature model could adequately explain the mid-infrared lines (Cesarsky, D. et al., 1999). Figure 14 compares the excitation model derived from near- to mid-infrared observations of IC 443 (Rho et al., 2001) and our 3C 391 data. The IC 443 model did not have to be rescaled for this comparison. For both shocks, the column density inferred from observations of the near-infrared lines alone is smaller than that inferred from the lower-energy mid-infrared lines. The actual excitation is non-LTE, and it depends both on the volume density of the emitting region and possibly on the time that the gas has cooled (Cesarsky, D. et al., 1999). We used the two-temperature excitation model to calculate the clump column densities in Table 3.
5 Ionic shocks
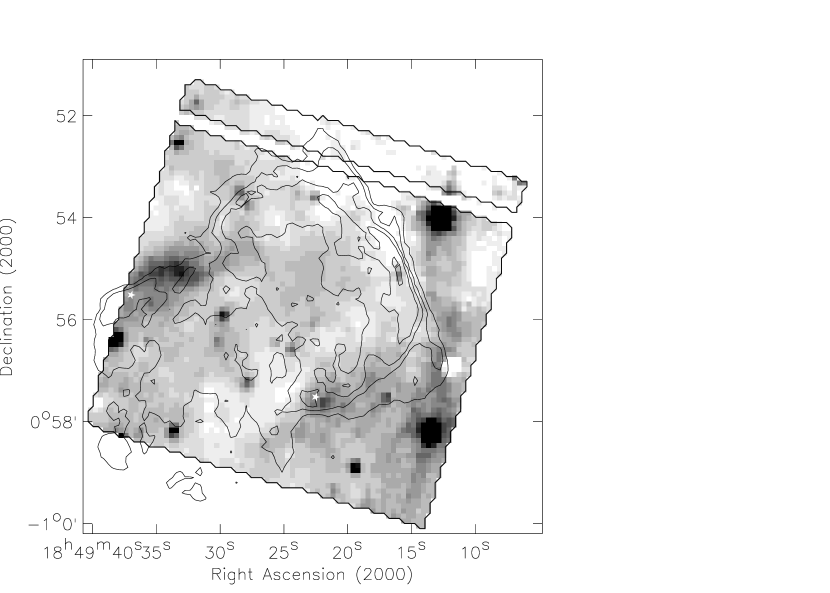
The ionic shocks are traced, in our data, by emission from [Fe II], [Ne II], and [Ne III], which follows the shell-like radio emission rather closely. Figure 15 the Palomar [Fe II] image with the resampled radio image overlaid as contours. The bright [Fe II] in the northwest agrees in detail with the size and location of the bright radio bar, and the other features, though fainter, also seem to agree in detail.
The morphology of the [Ne] emission also seems to follow the radio emission in some detail. From the CVF spectra, it appears that the 12–18 m filter image, after subtracting the reference spectrum, is dominated by the [Ne II] 12.8 m and [Ne III] 15.5 m lines. Thus the diffuse emission in Figure 2 is effectively a map of [Ne], at least for the part associated with the remnant. (Fig. 2 also contains aromatic hydrocarbon emission from unrelated gas, but for the structure related to 3C 391:BML, the spectra in Figs. 4 and 5 show that there is no aromatic hydrocarbon emission or continuum from the remnant.) From this figure we see that the radio bar is replicated in [Ne]. The radio ridge at the easternmost part of the remnant () is also present in the [Ne] image, but with an apparent shift such that the [Ne] is partly ‘outside’ of the radio shell. Care is needed in interpreting wide-band images such as Figure 2, because the spectrum can vary significantly from place to place. The disagreement between the radio and 12–18 m image may in this case be due to a contribution from dust grains, as is suggested by comparing to the 10.8–11.9 m image (see §6).
The agreements and differences between the [Ne], [Fe], and radio images are the result of combined effects of excitation, grain destruction, and magnetic field. In general, the [Fe II] image appears better-correlated with the radio emission than the [Ne] image. The close agreement of [Fe] and radio emission suggests that the shocks that are most able to accelerate cosmic rays are also the ones capable of destroying dust grains. The [Ne] emitting regions may be shocks that are less efficient at grain destruction because of higher pre-shock density, leading to lower shock velocity; grain destruction is very sensitive to the shock velocity (Jones, Tielens, & Hollenbach, 1996). The differences between [Ne] and [Fe] could also be due to excitation differences, because the [Ne] lines we observed are among levels that are closer to the ground state than the levels that produce the near-infrared [Fe II] line.
The [Fe II] 1.64 m emission from the radio bar is bright, suggesting a hot postshock region with a significant fraction of grains destroyed. The [Fe II] 26 m line was observed toward the northern part of 3C 391 using ISO SWS, in a aperture (Reach & Rho, 2000). The SWS pointing was centered on an earlier LWS pointing that was part of a strip map crossing the northern edge of the remnant. It appears that the SWS pointing called 3C 391:radio does not sample the brightest part of the radio bar, where our new Palomar image reveals a highly concentrated bar of emission. Instead, the SWS observation sampled a region of much fainter [Fe II] emission, . Comparing the near-infrared limit to the observed brightness of the 26 m line, using a 13-level excitation model for the Fe+ ion, we can conclude that the emitting region has a temperature less than 3000 K, which is consistent with the brightness of other lines observed behind the J-shocks into moderately dense gas.
The pre-shock density for the radio bar was likely comparable to that of the molecular cloud. Comparing the [O I] brightness to J-shock models, a moderate density was inferred (Reach & Rho, 1996). The brightness and morphology to the radio bar of 3C 391 is very similar to the northeast rim of IC 443, which has more complete spectroscopic observations. The surface brightness and line ratios imply a pre-shock density or order cm-3 (Rho et al., 2001). Such densities are actually comparable to the average densities of giant molecular clouds such as are traced by rotational CO lines at mm-wavelengths. For example, the Rosette molecular cloud (Williams, Blitz, & Stark, 1995) and molecular clouds in the inner galaxy (Simon et al., 2001) were found to be composed of CO-emitting regions with densities in the range cm-3 embedded in even lower density gas. Thus the ‘ionic’ shocks are plausibly shocks into the CO-emitting pre-shock regions that traditionally define molecular clouds.
So far, we have discussed only ionic lines from the shocks in the northwestern part of the remnant, arguing that these shocks are completely dissociative. The excitation of the ionic lines, the shock velocity inferred from the width of the [O I] 63 m line (Reach & Rho, 2000), and the presence of the molecular cloud surface so nearly tangent to the northwestern radio bar (Wilner, Reynolds, & Moffett, 1998) all show that the pre-shock gas was mostly molecular. Furthermore, there is some weak emission from molecular gas in the northwestern region: the H2 S(3) line was detected using the ISO SWS, at a brightness of erg cm-2 s-1 sr-1 (Reach & Rho, 2000). This emission is much weaker than that detected toward 3C 391:BML. The H2S(9), which arises from a much higher energy level than the S(3) line, was not detected from the northwest; nor is there 1–0 S(1) line emission in the Palomar image. Thus, we interpret the weak, low-excitation H2 emission from the northwestern part of 3C 391 as molecules that have reformed behind a dissociative shock. For such a shock, the molecules reform after the gas has recombined and cooled, and the bulk of the H2 emission arises in a layer with relatively low temperature (Hollenbach & McKee, 1989). In contrast, for a non-dissociative shock, the emission can arise from regions where the H2 molecules reach significantly higher excitation, with energy levels potentially approaching the dissociation energy (Draine et al., 1983). The H2 emission arises from molecules that were dissociated in the shock and subsequently reformed on the surfaces of surviving grains. As a corollary, some of the grains must survive the shock; this is not inconsistent with the observed lack of mid-infrared aromatic features or continuum from the shock fronts, because larger grains (which do not produce mid-infrared features or continuum, but do dominate the mass and far-infrared emission of interstellar dust) may survive the shocks. The timescale for reformation of H2 molecules in the physical conditions of the 3C 391 ionic shocks is yr, somewhat longer than the remnant age; thus, H2 reformation is probably only partial. One prediction of this interpretation is that the velocity widths of the H2 S(3) lines will be km s-1 in the northwest and km s-1 in the 3C 391:BML region.
6 Dust Destruction
The lack of any significant continuum emission or solid-state or macromolecular spectral features in the mid-infrared spectrum suggests that the shocks have destroyed some of the grains. The mid-infrared emission of unshocked interstellar gas is dominated by solid-state features at 6.2, 7.7, 8.6, 11.3, and 12.6 m due to aromatic hydrocarbons; these features, combined, produce the emission that was detected almost everywhere by IRAS (Léger and Puget, 1984). These features are all clearly evident in the ISOCAM CVF spectrum of unshocked gas in Figure 3. However, the shocked gas shows no solid-state features: both the molecular shock (Fig. 4) and the ionic shock (Fig. 5) spectra are devoid of aromatic features, despite bright features from the pre-shock and unrelated gas (Fig. 3). Further, the shocked emission shows no significant continuum rise at long wavelengths. This rise is normally seen in interstellar dust spectra, including those of quiescent regions like reflection nebulae (Cesarsky, D. et al., 1996c). This mid-infrared rise is required to explain the bright 25 m emission from the interstellar medium, as also detected by IRAS, because there are no bright spectral solid-state features at longer wavelengths. In H II regions, the aromatic features are weak or absent, while the mid-infrared continuum is relatively bright (Cesarsky, D. et al., 1996b). Thus, the mid-infrared emission from the interstellar medium can be considered as due to two types of particles: very small particles or macromolecules of aromatic hydrocarbons that are the carriers of the 6.2–12.6 m features, and very small solid dust particles that are carriers of the mid-infrared continuum (Désert, Boulanger, & Puget, 1990). The lack of aromatic features or continuum in the mid-infrared spectrum of 3C 391 suggests that both carriers are destroyed.
To look more carefully for aromatic hydrocarbons, we made a small image of 3C 391 with ISOCAM in the LW8 filter (10.8–11.9 m). This filter contains no significant spectral lines of shocked gas (see Fig. 4), but it is centered on the bright aromatic feature at 11.3 m. Thus emission in this filter traces the distribution of aromatic hydrocarbon particles. Figure 16 shows the 10.8–11.9 m image. The supernova remnant is not evident in this image. The total contrast in the 10.8–11.9 m image is small; after subtracting 105.8 MJy sr-1 of zodiacal emission appropriate for this filter and observing location and date, the range is 29–40 MJy sr-1 for the diffuse emission in the region observed by the ISOCAM CVF. The choice of CVF reference spectrum (§2.1) location is relatively clean of structure and typical of the galactic emission for the field.
The low-contrast structure in the 10.8–11.9 m image includes emission near the southern and northeastern parts of the radio shell. These enhancements are not coincident with the OH maser locations, nor are they coincident with the 12–18 m image. There is no emission from the bright radio bar in the northwest. Indeed, it is just possible to see an outline of much of the remnant as a ‘shadow’ in the 10.8–11.9 m image. The ‘shadow’ includes the northwestern radio bar and runs all the way from the radio bar along the inside edge of the remnant. The ‘shadow’ does not overlap with 3C 391:BML; instead, it is interior to the shock as traced by the radio emission and the infrared emission lines. The origin of the ‘shadow’ is unclear. It could be due to extinction, from unshocked gas. We suspect that the shadow actually represents a deficit of grains in the post-shock material. It is also possible that some faint PAH emission occurs outside the radio shell.
The 10.8–11.9 m image (Fig. 16) may help resolve two other issues for 3C 391. First, there is an extension from the remnant in the 12–18 m image (Fig. 2, described in §2.1), stretching to the south and seemingly doubling the infrared remnant size relative to the radio size. The 10.8–11.9 m image is too small to show the entire extension, but there is emission in the lower-right (southernmost) part of the 10.8–11.9 m image, which overlaps with the extension. Thus, it appears that the extension is bright in the aromatic features, whereas the remnant emission is faint in 10.8–11.9 m and has no aromatic hydrocarbons. Second, the 10.8–11.9 m image reveals a bright, diffuse peak just north of the eastern OH maser. This peak may explain why the 12–18 m image extends beyond the boundary of the radio shell at this location; specifically, the 12–18 m image contains some contribution from dust continuum that is correlated with the aromatic features traced by the 10.8–11.9 m image. Both the southwestern extension of the remnant and the northeastern peak are outside of the radio shell, and they are bright in both the 12–18 m and 10.8–11.9 m filters, suggesting they are due to material with very different physical conditions from the post-shock material.
The efficient destruction of small grains is actually counter to what we had expected. Small grains are actually predicted to be produced in 100 km s-1 shocks, being shattered fragments of larger grains (Jones, Tielens, & Hollenbach, 1996). The far-infrared spectra of molecular supernova remnants revealed dust continuum that was associated with the remnants; the shocked dust had a warmer far-infrared color temperature suggesting that the grains are probably smaller than the pre-shock grains. The smallest grains, which would emit in the mid-infrared apparently do not continue the size distribution of grain fragments. The smaller grains can be destroyed by sputtering in the hot gas behind the shock, and especially fast collisions can vaporize grains rather than shatter them.
7 Conclusions
Our new near- and mid-infrared observations have separated the molecular and ionic shocks in 3C 391. The ionic shocks, traced by [Fe II], [Ne II], and [Ne III], follow the nonthermal radio shell and are due to shocks propagating into moderate-density gas. The ionic shock morphology is filamentary. There is no continuum or aromatic spectral features in the mid-infrared spectrum of the ionic shocks, despite the presence of bright aromatic features and continuum in the mid-infrared spectrum of regions just outside the shock. Thus the small dust grains and aromatic hydrocarbons are efficiently destroyed in the ionic shocks, contrary to our expectation that small grains would be abundantly produced as fragments of larger grains.
Comparing our new observations of 3C 391 to the well-studied remnant IC 443 (Rho et al., 2001), we see they are generally similar, in that parts of the remnant shells are dominated by ionic shocks (northwest in 3C 391, northeast in IC 443) and parts are dominated by molecular shocks (southeast in 3C 391, south in IC 443). For 3C 391, the ionic shocks arise from the location where the supernova remnant is tangent to the surface of a giant molecular cloud, while the molecular shocks are outside the giant molecular cloud. For IC 443, it has long been assumed that the pre-shock molecular cloud is to the south, where the molecular ridge is located. Our observations show that supernova shocks into a molecular cloud can be ionic shocks through material with density of order to cm-3. Such preshock material is traced by CO() emission and defines ‘molecular clouds’ as traditionally observed. In another molecular-interacting remnant, HB 21, the molecular shocks were also found to be at locations other than the interface between the supernova remnant and molecular cloud (Koo et al., 2001). The shocks for which H2 emission dominates the cooling are those into denser material, which has a small filling factor and may or may not be present at the location and time when the blast wave passes through the molecular cloud. In this sense, molecular-interacting supernova remnants provide a unique perspective into the structure of molecular clouds.
The region 3C 391:BML, where tracers of molecular shocks including an OH 1720 MHz maser, H2O and OH far-infrared emission, and wide CO and CS mm-wave lines, resolves into a cluster of partially resolved clumps in the near-infrared H2 image. The morphology of the molecular shocks is completely different from that of the ionic shocks. The ISOCAM images show that the molecular emission is confined to the 3C 391:BML region, with the ionic shocks following the radio shell and perhaps even dimming in the region of bright molecular emission. One of the molecular clumps corresponds precisely with the location of the OH maser. The clumps most likely are dense cores from the giant molecular cloud within which the progenitor of 3C 391 formed. They are now revealed in H2 emission because of the shocks that are being driven through them by the supernova explosion some yr ago. These dense cores have their outer layers stripped and have somewhat altered chemistry in the shocked regions, potentially impacting their future star formation potential and the type of stars they may form.
References
- Abergel et al. (1996) Abergel, A. et al. 1996, A& A, 315, L329
- André, Ward-Thompson, & Barsony (2000) André, P., Ward-Thompson, D., & Barsony, M. 2000, in Protostars and Planets IV, eds. V. Mannings, A. P. Boss, & S. S. Russell (Tucson: University of Arizona Press), 59
- Arikawa et al. (1999) Arikawa, Y., Tatematsu, K., Sekimoto, Y., & Takahashi, T. 1999, PASJ, 51, L7
- Bacmann et al. (2000) Bacmann, A., André, P., Puget, J.-L., Abergel, A., Bontemps, S., & Ward-Thompson, D. 2000, A& A, 361, 555
- Cesarsky, C. et al. (1996a) Cesarsky, C. et al. 1996, A&A, 315, 32
- Cesarsky, D. et al. (1999) Cesarsky, D., Cox, P., Pineau Des Forêts, G., van Dishoeck, E. F., Boulanger, F., & Wright, C. M. 1999, A& A, 348, 945
- Cesarsky, D. et al. (1996b) Cesarsky, D., Lequeux, J., Abergel, A., Perault, M., Palazzi, E., Madden, S. & Tran, D. 1996, A& A, 315, L309
- Cesarsky, D. et al. (1996c) Cesarsky, D., Lequeux, J., Abergel, A., Perault, M., Palazzi, E., Madden, S. & Tran, D. 1996, A& A, 315, L305
- Chevalier (1999) Chevalier, R. A. 1999, ApJ, 511, 798
- Denoyer (1979) Denoyer, L. K. 1979, ApJ, 232, L165
- Désert, Boulanger, & Puget (1990) Désert, F.-X., Boulanger, F., & Puget, J.-L. 1990, A& A, 237, 1
- Draine et al. (1983) Draine, B. T., Roberge, W. G., & Dalgarno, A. 1983, ApJ, 264, 485
- Frail et al. (1996) Frail, D. A., Goss, W. M., Reynoso, E. M., Giacani, E. B., Green, A. J., Otrupcek, R. 1996, AJ, 111, 1651
- Frail & Mitchell (1998) Frail, D. A., & Mitchell, G. F., ApJ, 508, 690
- Gaume & Mutel (1987) Gaume, R. A., & Mutel, R. L. 1987, ApJS, 65, 193
- Hollenbach & McKee (1989) Hollenbach, D. J., and McKee, C. F. 1989, ApJ, 342, 306
- Jones, Tielens, & Hollenbach (1996) Jones, A. P., Tielens, A. G. G. M., & Hollenbach, D. J. 1996, ApJ, 469, 740
- Kessler et al. (1996) Kessler, M. F. et al. 1996, A& A, 315, L27
- Koo & Moon (1997) Koo, B.-C., & Moon, D.-S. 1997, ApJ, 485, 263
- Koo et al. (2001) Koo, B.-C., Rho, J., Reach, W. T., Jung, J., & Mangum, J. G., ApJ, 552, 175
- Léger and Puget (1984) Léger, A., & Puget, J.-L. 1984, A& A, 137, L5
- Olbert et al. (2001) Olbert, C. M., Clearfield, C. R., Williams, N. E., Keohane, J. W., & Frail, D. A. 2001, ApJL, 554, L205
- Reach et al. (2000) Reach, W. T., Boulanger, F., Contursi, A., & Lequeux, J. 2000, A& A, 361, 895
- Reach & Rho (1996) Reach, W. T., & Rho, J.-H. 1996, A& A, 315, L277
- Reach & Rho (1998) Reach, W. T., & Rho, J.-H. 1998, ApJ, 507, L93
- Reach & Rho (1999) Reach, W. T., & Rho, J.-H. 1999, ApJ, 511, 836
- Reach & Rho (2000) Reach, W. T., & Rho, J.-H. 2000, ApJ, 544, 843
- Reynolds & Moffett (1993) Reynolds, S. P., & Moffett, D. A. 1993, AJ, 105, 2226
- Rho & Petre (1996) Rho, J.-H., & Petre, R. 1996, ApJ, 467, 698
- Rho & Petre (1998) Rho, J.-H., & Petre, R. 1998, ApJ, 503, L167
- Rho et al. (2001) Rho, J., Jarrett, T., Cutri, R., & Reach, W. T. 2001, ApJ, 547, 885
- Rieke & Lebofsky (1985) Rieke, G. H., & Lebofsky, M. J. 1985, ApJ, 288, 618
- Seta et al. (1998) Seta, M. et al. 1998, ApJ, 505, 286
- Simon et al. (2001) Simon, R., Jackson, J. M., Clemens, D. P., Bania, T. M. & Heyer, M. H. 2001, ApJ, 551, 747
- Skrutskie (1999) Skrutskie, M. F. 1999, in Astrophysics with Infrared Surveys: A Prelude to SIRTF, eds. M. D. Bicay, C. A. Beichman, R. M. Cutri, & B. F. Madore (San Francisco: ASP), p. 185.
- White, Rainey, Hayashi, & Kaifu (1987) White, G. J., Rainey, R., Hayashi, S. S., & Kaifu, N. 1987, A&A, 173, 337
- Williams, Blitz, & Stark (1995) Williams, J. P., Blitz, L., & Stark, A. A. 1995, ApJ, 451, 252
- Wilner, Reynolds, & Moffett (1998) Wilner, D. J., Reynolds, S. P., & Moffett, D. A. 1998, AJ, 115, 247
- Wilson et al. (2001) Wilson, J. C. et al. 2001, PASP, 113, 227