Coupled spheroid and black-hole formation, and the multifrequency detectability of active galactic nuclei and submillimetre sources.
Abstract
We use a simple model of spheroid formation to explore the relationship between the creation of stars and dust in a massive proto galaxy and the growth of its central black hole. This model predicts that sub-mm luminosity peaks after only Gyr. However, without a very massive seed black hole, Eddington-limited growth means that a black hole mass of , and hence very luminous AGN activity, cannot be produced until Gyr after the formation of the first massive stars in the halo. The model thus predicts a time-lag between the peak of sub-mm luminosity and AGN luminosity in a massive proto-elliptical of a few times years. For a formation redshift , this means that powerful AGN activity is delayed until , by which time star formation in the host is complete, and sub-mm luminosity has declined to of its peak value. This provides a natural explanation for why successful sub-mm detections of luminous radio galaxies are largely confined to . Conversely the model also predicts that while all high-redshift luminous sub-mm-selected sources should contain an active (and growing) black hole, the typical luminosity of the AGN in such objects is times smaller than that of the most powerful AGN. This is consistent with the almost complete failure to detect sub-mm selected galaxies with existing X-ray surveys. Finally the model yields a black-hole:spheroid mass ratio which evolves rapidly in the first Gyr, but asymptotes to in agreement with results at low redshift. This ratio arises not because the AGN terminates star formation, but because fueling of the massive black hole is linked to the total mass of gas available for star formation in the host.
keywords:
galaxies: elliptical and lenticular, cD — galaxies: active — galaxies: evolution — quasars: general — stars: formation — (ISM:) dust, extinction — submillimetre1 Introduction
Until recently the formation/evolution of active galactic nuclei and the formation/evolution of galaxies of stars have been viewed and studied as separate problems in observational cosmology. However, two recent observational discoveries have changed this. First, it is now clear that the global history of star-formation and AGN activity track each other rather well, at least out to (Dunlop 1997; Boyle & Terlevich 1998; Franceschini et al. 2000). Second, it is also now well established that essentially all present-day galaxies contain a central black hole whose mass is proportional to the mass of the spheroidal component of the host, with (Kormendy & Gebhardt 2001; Merritt & Ferrarese 2001). Consequently the growth and fueling of super-massive black holes and the construction of galactic spheroids are now seen as potentially intimately-related processes (e.g., Silk & Rees 1998; Fabian 1999; Granato et al. 2001).
This increased awareness of possible links between black-hole and spheroid formation has coincided with recent observational advances which have the potential to provide greatly-improved constraints on the evolution of massive galaxies and AGN. In particular new sub-mm surveys with the SCUBA camera on the JCMT have resolved a substantial fraction of the sub-mm background (Smail et al. 1997; Hughes et al. 1998; Eales et al. 1999), and have revealed a population of massive, dusty star-forming objects at which are sufficiently numerous to account for the formation of all present-day massive ellipticals (Dunlop 2001; Scott et al. 2002). At the same time, deep X-ray surveys have resolved the X-ray background and have enabled the evolution of X-ray emitting black holes to be traced out to (Miyaji et al. 2000). Moreover, motivated by the potential links between black-hole and spheroid formation outlined above, there is considerable current interest in determining the level of overlap between the sub-mm and X-ray populations. Current observations indicate this overlap is, perhaps surprisingly, small (Fabian et al. 2000; Almaini et al. 2002; Barger et al. 2001).
An alternative route to exploring the link between black-hole and spheroid formation is provided by observations designed to measure the star-formation history of the hosts of known active black holes as a function of redshift. Archibald et al. (2001) performed this experiment for the most massive black holes by undertaking a sub-mm study of a sample of radio galaxies spanning a wide range in redshift at constant radio power. At low redshift it is now well established that powerful radio sources are produced by only the most massive black holes with , residing in massive elliptical hosts with (Dunlop et al. 2002). Thus, sub-mm observations of powerful radio galaxies over a wide range of redshifts can offer insight into the formation history of at least a subset of the most massive elliptical galaxies.
The principle result of this study was that the sub-mm detectability of powerful radio galaxies was found to be a strong function of redshift, with a detection rate of 75% at compared to only 15% at (Archibald et al. 2001). Indeed, the average sub-mm luminosity of the radio galaxies in the sample could be approximated as rising with increasing redshift with out to .
By definition, all the objects observed in this study contained sufficient gas to fuel the activity of their central black holes at the epoch of emission. Viewed in the light of this selection bias, the observed strong redshift dependence of sub-mm luminosity provides rather convincing evidence that the hosts of massive black holes at high redshift are very different to the relatively passive elliptical hosts of low-redshift AGN. Specifically, irrespective of whether the dust is heated primarily by the UV output of young stars or by the AGN itself, these results indicate that the mass of dust (and hence gas) in high-redshift AGN hosts is much greater at . The obvious implication is that by we are probing an era in which a significant fraction of the eventual stellar population of a typical massive elliptical has yet to be formed.
Interestingly, a comparison of the redshift distribution of the sub-mm detected radio galaxies with current best-estimates for the redshift distribution of sub-mm selected sources indicates that they are statistically indistinguishable (Archibald et al. 2001; Smail et al. 2000). This provides some justification for believing that the sub-mm evolution observed for the radio-galaxy sample may apply to spheroid formation in general. However, this then raises the obvious counter question of why so few bright sources discovered via sub-mm surveys display any obvious signs of powerful AGN activity?
Motivated by these new observational results we here develop further a simple model for the dust-enshrouded formation of massive spheroids which we have previously applied to explore the red envelope of galaxy evolution at optical-infrared wavelengths (Jimenez et al. 1999). This model is constructed by combining the stellar population and dust-formation models of Jimenez et al. (2000, 2002) with a multi-zone chemo-hydrodynamic model for a collapsing gas spheroid developed by Friaca & Terlevich (1998). The model yields predictions for the time evolution of gas, dust and the stellar population of the galaxy as a whole, but also allows us to set constraints on the growth and fueling of a central black hole by tracking the rate at which gas is deposited into the central 100 pc of the galaxy. The predictions of this model not only provide insight into the results of the SCUBA radio-galaxy survey, but also offer a possible explanation for the relative failure of X-ray surveys to detect bright SCUBA sources. The model also demonstrates that a correlation between black-hole and spheroid mass consistent with that seen in low-redshift galaxies can be produced without invoking a direct causal connection between black-hole emission and the termination of star formation in the host (as suggested by Silk & Rees 1998 and Fabian 1999).
At first sight, it might appear that this spherically symmetric calculation of spheroid formation within an isolated and complete dark matter halo is of dubious relevance in the context of the accepted paradigm of hierarchical galaxy formation driven by halo mergers. However, to date, multi-zone chemo-hydrodynamic models of the type considered here have only been developed in one dimension. Despite this technical limitation, we feel it is nevertheless important to consider the detailed predictions of such a model, especially given the extremely simplified recipes of star-formation currently adopted in the construction of semi-analytic models of galaxy formation(e.g, Somerville & Primack 1999; Benson et al. 2001). Moreover, for AGN host galaxies forming at (i.e. at or near the peak epoch of quasar activity), the simple model presented here may in fact offer a good approximation to the average behaviour of the baryons within the forming host galaxy. This is because, in such highly-biased regions within the early Universe, the merging of collapsed dark matter haloes of mass into a final halo mass is completed very rapidly (see Section 5).
The structure of this paper is as follows. In Section 2 we describe the key components of our theoretical model of a young elliptical galaxy, and summarize the predicted time evolution of the observable properties of such an object. The predictions of this model at sub-mm wavelengths are then compared with the results of the sub-mm study of radio galaxies in Section 3. In Section 4 we explore the predicted fueling and growth of the central black hole, and compare the predictions of the model with measurements of black-hole masses at low redshift and with the cosmological evolution of AGN activity. Finally, in Section 5 we discuss the implications of this model for the connection between black-hole and host-galaxy evolution, focusing on the predicted sub-mm detectability of AGN, and the X-ray detectability of sub-mm selected sources. For the calculation of physical quantities we assume a flat universe with , and throughout.
2 Model of a forming elliptical
The stellar populations observed in massive elliptical galaxies, especially those residing in clusters, appear to be highly coeval, consistent with the majority of the stars having formed on a timescale Gyr (e.g., Bower et al. 1992a, b). Whether these stars formed in a single region, or in smaller separate regions which merged to form the final spheroid, the star formation is expected to be vigorous, comprehensive, and obscured by dust - the initial gas reservoir being quickly consumed in the star formation process, and the remnants of the process being blown away by stellar winds and supernovae (e.g., Zepf & Silk 1996).
Jimenez et al. (2000) have developed multi-frequency models of galaxies formed via such rapid and violent dust-enshrouded starbursts. These models predict the time evolution of the ultraviolet-millimeter spectrum of a young elliptical galaxy based on a calculation of the star-formation rate and the resultant chemical evolution of the interstellar medium (ISM).
2.1 How the Models Work
There are three key components to the model: (i) the stellar emission from the model galaxy, (ii) the re-processing of this emission by dust, and (iii) the star-formation law which underpins both these processes.
2.1.1 Evolution of the Stellar Population
Given a star-formation law and an initial mass function, the stellar populations that form in each time step build up to form a complete model galaxy (Jimenez et al. 1998, 2002). Given a value for metallicity and the initial stellar mass (governed by the IMF), the evolutionary track of a star is calculated by the code JMSTAR15 (Jimenez et al. 1996; Jimenez & MacDonald 1996), which includes a proper treatment of the post-main-sequences phases of evolution. In the absence of dust and gas the integrated emission of the model galaxy at any time step is simply the sum of the flux from every star in the population.
The model assumes a Salpeter IMF of , where is the number of stars formed per unit volume with a mass , and . The IMF includes a low-mass cutoff at , and is assumed to be constant in both time and space.
2.1.2 Dust Model
The dust model (Jimenez et al. 2000) uses a simplified version of the Draine & Lee (1984) dust emission template, and is based on the formalism of Xu & de Zotti (1989).
For the purposes of calculating the far-infrared emission, the dust is simply assumed to lie in a thin shell which surrounds the entire galaxy, illuminated by the uniform radiation field generated by the stellar population. This distribution is not realistic. However, individual stars and gas clouds cannot be resolved in high-redshift systems. Given the lack of knowledge concerning the true distributions, this simple model is no worse than a more complicated model of dust and star geometry which cannot possibly be justified by the data.
This simple dust distribution is not, however, deemed appropriate for calculating the reddening of the galaxy light. Dense molecular clouds are the birthplace of stellar clusters, where all the massive stars are formed (e.g., Lada et al. 1991). It takes years for stellar winds and supernovae to disperse these clouds, which is approximately the lifetime of the most massive stars (e.g., Herbig 1962; Elmegreen & Lada 1977; Blitz & Shu 1980). The primary source of extinction of the galaxy light is the dust inside these molecular clouds, not the dust lying outside the starburst region (which is the assumed geometry for estimating the far-infrared emission of the galaxy). Thus, the model assumes that for the first years of a star’s life, the star is only visible in the infrared, with the optical and ultraviolet emission completely obscured. After years, the molecular cloud is assumed to have been dispersed, and the star becomes visible in the optical and ultraviolet regimes.
2.1.3 Star-Formation and Chemical Evolution
The model uses a star-formation law developed by Friaca & Terlevich (1998). Assuming spherical symmetry, the galaxy is divided into 100 radial zones. A 1-D hydro-dynamical code is used to follow the radial movement of the ISM and stars, including episodes of gas infall and outflow. The star-formation rate has a power-law dependence on the gas density: . The star-formation rate also has a radial dependence on the flow of the gas.
Using the resulting distribution of the gas flow, the chemical evolution is solved by taking into account the lifetimes of stars, and using modern nucleosynthesis predictions to compute the yields of stars of different masses. In particular, for stars with masses the yields were taken from Renzini & Voli (1981), while for stars with the yields from Hillebrandt (1982) were assumed. For SNII progenitors with we adopted the Woosley & Weaver (1995) yields and extrapolated these for . Finally, for SN Ia we adopted the yields from Nomoto et al. (1984).
As star formation continues the interstellar gas is heated by Type II supernovae. Eventually, the thermal energy of the gas is enough to overcome the escape velocity, and the remaining gas is expelled from the galaxy. At this point, the primary burst of star formation ceases. Later on, the red giants of low mass stars and Type I supernovae replenish the gas reservoir and metal reserves of the ISM, albeit to a limited extent. There is also a fresh infall of primordial gas which further dilutes the metallicity of the ISM. These new gas reserves allow residual star formation to occur.
2.2 Time Evolution of the Models
| Event | Timescale |
|---|---|
| 50 stars formed | 0.3 Gyr |
| 98 stars formed | 1.0 Gyr |
| 100 stars formed | 1.7 Gyr |
| dust mass peaks | 0.2 Gyr |
| metallicity peaks | 2.0 Gyr |
Friaca & Terlevich performed their 1-dimensional hydrodynamical/chemico calculations for a range of assumed proto-galaxy gas masses, a fact which we exploit in Section 4.2. However, for comparison with the properties of radio galaxies we adopt a fiducial model which yields an eventual stellar mass of . The key stages of formation of a massive elliptical galaxy, as predicted by this dust-enshrouded starburst model are summarized in Table 1.
The primary burst of formation is rigorous and intense, taking only Gyr to form the first half of the stellar population. At its peak, the star-formation rate is no higher than a few . As the primary burst of formation draws to a close, subsequent episodes of formation occur due to the replenishment of the gas reservoir. This residual formation is less vigorous, and although of the stellar population is formed within a Gyr, it takes a further 0.7 Gyr to form the final .
One prediction of this model which appears to be a generic prediction of models of dust-enshrouded star formation is that the dust mass peaks when the galaxy is approximately half formed. For example, Edmunds & Eales (1998) and Frayer & Brown (1997) have developed analytical equations which govern the relationship between gas depletion, star-formation, and dust creation. These equations also predict a maximum in dust mass half-way through the star formation process. This is a consequence of competing processes: star formation is required to create the dust, but star formation also consumes the metal-enriched gas which houses the dust produced by previous generations of massive stars. It transpires that these competing effects balance to produce a maximum in dust mass approximately half-way through formation of the stellar population.
Even though half of the stars are formed very rapidly, in the first 0.3 Gyr, it can be seen from Table 1 that star formation persists in the host at some level for more than a Gyr. As demonstrated by Jimenez et al. (1999), at optical-infrared wavelengths this has the important effect of predicting that, even for a formation redshift , the largest values of observed from an evolving elliptical are produced at . This prediction counters previous suggestions that pseudo-monolithic models for elliptical formation can be excluded in favor of hierarchical models simply due to lack of extremely red objects at high redshift (Zepf 1997). In the current context, this extended tail of star-formation activity leads to the prediction that a massive elliptical should be detectable at the 1-2 mJy level at 850 up to Gyr after the onset of star-formation activity.
3 Galaxy Evolution - comparison with radio-galaxy data
3.1 An Example: 4C41.17
The multi-frequency evolution of galaxy luminosity predicted by the model can be used to assess the evolutionary status of well-observed massive galaxies at high redshift. As an example of how this can work we here consider two specific predictions of the model. The first is the predicted evolution of sub-mm flux density, and the second is the predicted evolution of optical-sub-mm color. The first of these is obviously an absolute property, dependent not only on the viability of the model but also on galaxy mass and assumed cosmology. In contrast the second is a relative measure of the mass of dust compared to the mass of stars which have already formed. While reliable estimates of galaxy mass at high redshift are not yet achievable, one can at least ask the question of whether, for reasonable values of assumed mass, these two predictions lead to the same conclusion about the evolutionary status of a given object.
The radio galaxy 4C41.17 is one of the best studied of all objects known at (e.g., Chambers et al. 1990; Dunlop et al. 1994; Dey et al. 1997; van Breugel et al. 1998). Two other properties of 4C41.17 make it particularly useful as a test of the model predictions. First, as the host of one of the most powerful known radio sources, it would seem safe to assume that it is the progenitor of a massive elliptical with an eventual stellar mass of at least . Second, its observed optical emission is known to be dominated by starlight rather than the AGN (Dey et al. 1997).
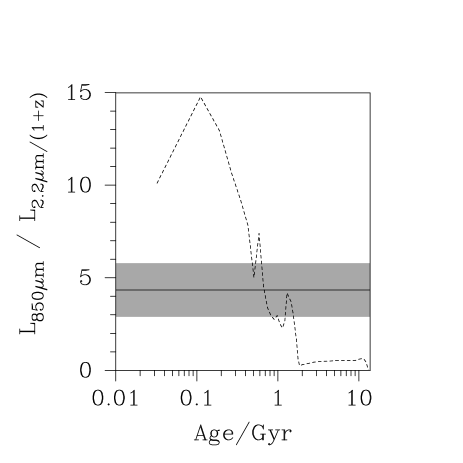
In Figure 1, we compare the time evolution of and predicted by the model with the observed values for 4C41.17. This comparison indicates that 4C41.17 is experiencing a starburst which is Gyr old, having begun at . If the model is a correct description of 4C41.17, then of the final stellar mass of the galaxy has already been formed.
This conclusion is driven primarily by the value of the ratio observed for 4C41.17 which, in essence, indicates that while active star-formation is still continuing at a high level the majority of the stellar population is already in place. But we can see that this conclusion is also consistent with the observed 850 flux-density of 4C41.17 provided its total baryonic mass exceeds , which seems perfectly reasonable given the stellar masses of the hosts of low-redshift radio sources (Dunlop et al. 2002). Thus, consistent with the original conclusions of Dunlop et al. (1994), this model comparison indicates that 4C41.17 is observed in the final stages of its formative starburst.
If this conclusion is correct, it is worth noting that the model predicts an object as massive as 4C41.17 would have produced a sub-mm flux density as large as mJy if it had been observed only 0.3-0.6 Gyr earlier, only 0.2 Gyr after formation (i.e. at for a formation redshift ). However, if observed at this stage in its evolution the model also predicts that the galaxy would have been much harder to detect in the near-infrared, with . Moreover, as discussed further below, at this stage it seems unlikely that 4C41.17 would have been capable of powerful radio emission. The inferred properties of 4C41.17 only 0.5 Gyr prior to the actual observed emission epoch are therefore interestingly similar to the observed properties of many of the sub-mm selected sources found in the blank-field SCUBA surveys (Dunlop 2001). This point is pursued further in section 5.
3.2 Redshift dependence of sub-mm luminosity
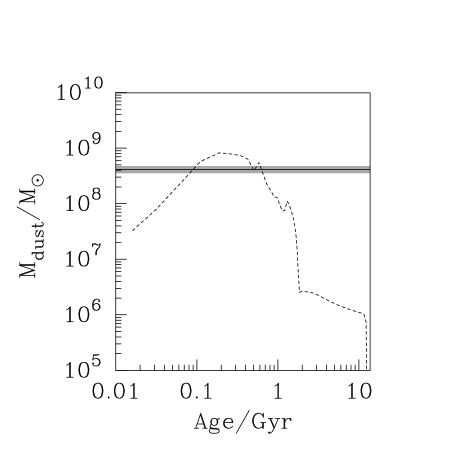
Assuming a formation redshift of as inferred above for 4C41.17, we plot in Figure 2 the redshift evolution of the gas mass, dust mass, and stellar mass predicted by the model.
The formation of the spheroid lasts approximately 1 Gyr and is 95% complete by . While it would seem unreasonable to ascribe a single formation redshift to all powerful radio galaxies, it is nevertheless interesting that is also the redshift below which radio galaxies generally appear as relaxed spheroids in infrared images, and above which they generally appear to be more complex, extended and clumpy sources in the rest-frame optical (van Breugel et al. 1998; Pentericci et al. 2001). Moreover, as also illustrated in Figure 2, the predicted redshift evolution of sub-mm luminosity is undeniably reminiscent of the redshift dependence of mean for the full radio-galaxy sample observed by Archibald et al. (2001).

In summary, the observed sub-mm - optical properties of high-redshift radio galaxies are, at least to first order, consistent with the model predictions for an assumed typical formation redshift .
3.3 Redshift dependence of optical luminosity
Finally, we plot in Figure 3 the redshift evolution of optical luminosity, both in terms of absolute -band magnitude, and in terms of observed magnitude. As can be seen from the lower plot, the -band absolute magnitude is 1.4 magnitudes brighter than , consistent with observations which indicate that radio galaxies are typically times more luminous than galaxies.

4 Black Hole Evolution
Having established that the model provides a plausible description of the evolution of massive ellipticals as traced by radio galaxies, we now explore the predictions of the model for central black-hole growth, and AGN output as a function of time/redshift.
4.1 Black Hole Growth
As detailed in Friaca & Terlevich (1998) one output of the multi-zone model is the amount of gas delivered per unit time to the central regions of the galaxy ( pc).
To calculate the growth of the central black hole we assume that all of this fuel is available for consumption by the central black hole (true in the absence of any other limiting factor, Burkert & Silk 2001). However, as illustrated in Figure 4 (for our fiducial model ) in practice for most of the first Gyr, the growth of the central black hole is limited not by this fuel supply, but by the Eddington limit (following the prescription of Small & Blandford 1992), unless a very large seed mass () is adopted. Figure 4a shows how black-hole mass consumption compares with central fuel delivery as a function of time for an assumed seed mass of 10 and an assumed black-hole radiative efficiency of 10, while Figure 4 shows the effect of increasing the seed mass to 1000. We consider to represent a reasonable range for assumed seed mass because observationally no stars with masses larger than are known (Figer et al. 1998), and because theoretical models indicate that the first generation of population III stars may have produced black holes of mass (Fryer et al. 2001; Madau & Rees 2001).
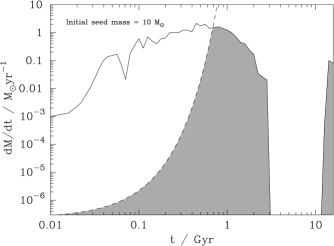
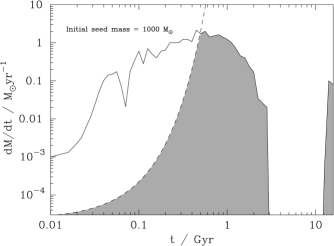
Figures 5a and 5b show how black-hole mass grows as a function of time for both assumed seed masses. In the first case the final black-hole mass is , while in the second case it is . Thus, varying the seed mass by a factor of 100 has only a very minor effect on the final mass of the black hole. Indeed, even if it is assumed that all the mass deposited into the central 100 pc is ultimately consumed by the black hole (i.e. including that fraction of gas which is delivered, but cannot be consumed during the Eddington-limited accretion phase) the final mass is still not very different, at .


Inspection of Figures 4 and 5 shows that the black hole grows and radiates at the Eddington limit for the first Gyr (doubling in mass every yrs) but that beyond that point, when the black hole has grown to a mass of a few times , the fuel delivery is unable to sustain further Eddington-limited fueling/growth. However, the black hole continues to grow to its final mass in excess of for a further Gyr or so, through sub-Eddington accretion before the gas supply is essentially switched off 3 Gyr after formation.
Although this paper does not pretend to place any new constraints on our understanding of black-hole accretion mechanisms, it is nevertheless important to ask whether the accretion rates produced by this model are consistent with current understanding of the rate at which a black hole can consume matter from an accretion disc. In particular, one might question whether the black hole is capable of consuming the gas delivered to it at the peak rate which approaches (see Figure 4). In fact, for a massive spheriod (with central velocity dispersion ) the calculations of Burkert & Silk (2001) indicate that accretion disc viscosity can be expected to limit the mass consumption rate of a super-massive black hole at the centre of a forming spheriod to for a critical Reynolds number in the range (Duschl et al. 2000). Thus, our current knowledge of accretion disc physics does not appear to conflict with our assumption that the black-hole can consume all the gas delivered to the central region of the galaxy at a peak rate which, in this particular model, approaches .
Several features of these results deserve comment. First, due to the assumption of Eddington-limited growth, the spheroid does not contain a black hole of sufficient mass to host a quasar (i.e. ; Dunlop et al. 2002) until Gyr after commencement of star-formation. This predicted delay is still consistent with the discovery of quasars at in our favored cosmology ( Gyr at ), and can only be significantly accelerated by the assumption of either a very large seed mass or possibly runaway merging of black holes as suggested by Ebisuzaki et al. (2001).
Second, the final black-hole mass results in a black-hole:spheroid mass ratio of (or 0.0017 if all available gas is consumed by the black hole), in very good agreement with observational results at low redshift (Kormendy & Gebhardt 2001; Merritt & Ferrarese 2001). Note that this ratio arises not from invoking the assumption that the black-hole itself is responsible for regulating and terminating star-formation in the host (Silk & Rees 1998; Fabian 1999), but rather because the gas dynamics and star-formation in the forming spheroid has not allowed Eddington-limited exponential black-hole growth to continue beyond the first Gyr, and ultimately terminates significant black-hole fueling after the first Gyrs (we note that Burkert & Silk 2001 also appeal to star formation to limit excessive black-hole growth, but in their model the star-formation in question is specifically assumed to be in the outer accretion disc).
Third, there is a window lasting Gyr where the black hole has reached a mass sufficient to be capable of producing a powerful AGN and during which it is still receiving fuel at a sufficient rate () to do so. The bulk of the mass of the black-hole is actually accreted at sub-Eddington rates during this ‘AGN epoch’.
Fourth, the epoch of peak sub-mm luminosity precedes peak AGN luminosity by Gyr, due to the fact that sub-mm output peaks half-way through spheroid formation. Indeed, dependent on assumed seed mass, the black-hole mass at the time of peak sub-mm emission is only , offering an interesting alternative explanation (c.f. pure obscuration) for the failure to detect bright SCUBA sources at X-ray wavelengths (see Section 5).
4.2 The black-hole:spheroid mass relation
Given the rather successful prediction of our fiducial model that a host spheroid with mass should house a black-hole of mass , it is obviously of interest to undertake the same calculation for the range of spheroid masses originally modeled by Friaca & Terlevich (1998). The results of this calculation are presented in Figure 6, where predicted black-hole mass (for seed masses of 10 and ) is plotted against spheroid mass for five different galaxy masses. The best-fitting relation to these predicted data has a slope of 0.002, consistent with current estimates of the normalization of the relation (Kormendy & Gebhardt 2001; Merritt & Ferrarese 2001).

The fact that this relation can be successfully predicted without any need to appeal to a causal connection between black-hole radiation and gas ejection is perhaps unexpected, but obviously interesting. It suggests that this relation may simply come about because the amount of gas delivered to the central regions of a forming spheroid is roughly proportional to the total baryonic mass of the spheroid, with the rate and duration of gas delivery to the central region being limited by the star-formation process.
4.3 AGN Activity
Detailed observations of low-redshift AGN indicate that production of a QSO with requires a black-hole mass while production of a radio-loud source with requires (Dunlop et al. 2002; Laor 1998; McLure & Dunlop 2002). Although current constraints are poor, existing data on quasars at high redshift certainly do not contradict the hypothesis that these mass thresholds are physically significant and still apply even at (Kukula et al. 2001). If we now apply these mass thresholds to the model predictions shown in Figure 5, we can see that the model predicts that quasar-level optical activity cannot be produced until Gyr after commencement of star formation in the host, while production of a powerful radio source is delayed by Gyr.
However, the model predictions potentially extend beyond the basic prediction of such time delays. In particular, reference to Figures 4 and 5 shows that, until the black hole passes the aforementioned mass threshold of , the rate of gas delivery into the central regions of the galaxy by the cooling flow is well in excess of that required to sustain Eddington-limited black-hole growth. As discussed by Fabian (1999), in this situation it might be reasonably assumed that all optical emission, and a substantial fraction of soft X-ray emission from the growing black-hole is extinguished and that in its rapid growth phase the black hole may be only readily observable at hard X-ray wavelengths.
The model thus makes a number of predictions about the observability of high-redshift AGN at different wavelengths which can be compared with the results of current and future observations. These can be summarized as follows.
-
1.
Assuming that, due to bias, massive spheroids such as that represented by our fiducial model are the first to collapse, the first AGN observable at optical wavelengths should be rather luminous QSOs, emerging Gyr after the onset of massive star formation in the galaxy halo. This is because, by the time the central black hole ceases to be smothered by the central cooling flow and enters the regime of sub-Eddington accretion, it has already grown to a mass . This prediction is at least consistent with the relative success of bright quasar surveys in locating high-redshift QSOs (Fan et al. 2000).
-
2.
For a formation redshift , a powerful QSO should therefore emerge at , simply because Eddington-limited growth of the central black hole from a seed mass requires Gyr to produce a black hole of the required mass . For any formation redshift, luminous QSOs should not exist at redshifts significantly in excess of . The current quasar redshift record stands at (Fan et al. 2001).
-
3.
For a formation redshift , production of a powerful radio source is predicted to be delayed until , based once again on Eddington-limited growth and adoption of a minimum black-hole mass threshold of . For any formation redshift, powerful radio sources should not be found at redshifts significantly in excess of . The current radio-source redshift record stands at (van Breugel et al. 1999).
-
4.
Conversely, the predicted -Gyr time lag between the onset of massive star-formation activity and the appearance of a central QSO in our model can be used to infer the first epoch of massive star-formation from the redshifts of the most distant QSOs. Given the current QSO redshift record of , our model would predict that massive star-formation commenced in its host galaxy at .
-
5.
The very highest redshift AGN should only be visible in hard X-rays, as they rapidly approach a mass via Eddington-limited accretion fueled by a cooling flow delivering gas at super-Eddington rates to the central regions of the forming galaxy.
5 The Starburst-AGN connection
Finally we focus on the issue of the connection between host-galaxy and black-hole evolution. In Figure 7 and Figure 8 we plot together the redshift dependence of AGN output as inferred from Figures 4 and 5, alongside the evolution of host sub-mm luminosity, again assuming a formation redshift .


This combined diagram is instructive because it allows one to predict the properties of objects uncovered at different wavelengths as a function of flux-density and redshift. We emphasize that although Figure 7 represents the predictions of the specific model considered here, most of the resulting observable consequences apply to any quasi-monolithic model of elliptical formation in which star-formation activity peaks in a small fraction of a Gyr, while the rate of black-hole growth is dictated by Eddington-limited accretion starting from a modest seed mass.
First, it can be seen that the predicted duty cycle of quasar activity at high redshift is considerably longer ( Gyr) than that which is generally inferred from (presumably retriggered) activity at low redshift, with excessive black-hole masses being avoided by the fact that most of the accretion during this primary, long-lived active phase is sub-Eddington. Consequently it is hard to escape the prediction that, for a reasonable range of formation redshifts, a substantial fraction of the present-day massive elliptical population should be active at the same time around . In fact, provided that one assumes at least half of optical QSOs are obscured by orientation effects, the comoving number density of quasars at is , comparable to the present-day number density of ellipticals with (Kochanek et al. 2001).
Second, it is clear that sub-mm observations of powerful AGN are unlikely to uncover the most luminous sub-mm sources, but should be capable of yielding detections for those objects observed in the overlap period when the black-hole has grown to large mass but sub-mm luminosity has not yet declined to undetectably low levels. Statistically, this is clearly most likely to be the case for the highest redshift AGN, and we would therefore predict that the sub-mm detectability of powerful AGN should be a strong function of redshift, approaching unity at . As already discussed this does indeed appear to be the case for powerful radio galaxies (Archibald et al. 2001), and we would predict that the sub-mm detectability of optical and X-ray selected QSOs should be a similarly strong function of redshift.
Third, it can be seen from Figure 7 that, most strikingly for the assumed seed mass of 1000, the formation redshift of 4C41.17 inferred from its near-IR to sub-mm color in section 3, does indeed result in maximum AGN output at its observed redshift of as well as a sub-mm luminosity at this redshift in excellent accord with the observed value of mJy (Archibald et al. 2001). Thus the model can successfully account for the basic observed properties of this well-studied object at the observed epoch. Given that 4C41.17 appears to be one of the most massive objects in the universe, Figure 7 also indicates that the most luminous sub-mm sources are unlikely to exceed the sub-mm output of 4C41.17 by more than a factor , and thus sub-mm surveys are unlikely to uncover essentially any sources brighter than mJy.
Finally, we would expect such extreme SCUBA sources, and indeed the majority of sub-mm sources uncovered by the current relatively shallow sub-mm surveys to be biased toward the epoch of peak sub-mm output. As illustrated in Figure 7 and Figure 8 at this stage (which occurs in our model only Gyr after the onset of star-formation), the growing black hole is likely not only to be heavily obscured, but to have a black-hole mass (and AGN output) times smaller than that of luminous quasars. This means that, regardless of their precise redshift distribution, the fraction of bright sub-mm detected sources which should also prove detectable at X-ray wavelengths with current facilities is small. This prediction is at least qualitatively consistent with current results which indicate that only of bright sub-mm sources show any detectable signs of AGN activity at any wavelength (Fabian et al. 2000; Almaini et al. 2002; Barger et al. 2001). We emphasize that while the growing black-hole at this stage may well be heavily obscured, the model presented here predicts that SCUBA sources are unlikely to be detectable with current Chandra surveys primarily because the black hole is simply not big enough, rather than by insisting that the sources are Compton thick with scattering (Fabian 1999); even for unobscured AGN the deep Chandra observations presented by Almaini et al. (2002) are incapable of detecting a black-hole less massive than at . The model therefore also predicts that AGN heating makes a negligible contribution to the luminosity of high-redshift SCUBA sources.
In a future paper we intend to explore the effect of applying our model to track the behavior of the baryons within a CDM merger tree leading to a massive () collapsed dark matter halo at . However, for now we simply note that the simple model presented here may well offer a good approximation to the average behavior of the baryons within such a merger tree. This is because, for such highly-biased regions within the high-redshift universe, the merging of collapsed dark matter haloes of mass into a final halo of mass is completed in a timescale Gyr, comparable to the timescale of the star-formation and black-hole formation processes described in this paper.
ACKNOWLEDGMENTS
James Dunlop acknowledges the enhanced research time afforded by the award of a PPARC Senior Fellowship. Ross McLure acknowledges the support of a PPARC Fellowship, while Raul Jimenez acknowledges partial support from a PPARC Advanced Fellowship.
References
- Almaini et al. (2002) Almaini O. et al., 2002, MNRAS, in press, astro-ph/0108400
- Archibald (1999) Archibald E. N., 1999, PhD thesis, University of Edinburgh
- Archibald et al. (2001) Archibald E. N., Dunlop J. S., Hughes D. H., Rawlings S., Eales S. A., Ivison R. J., 2001, MNRAS, 323, 417
- Barger et al. (2001) Barger A. J., Cowie L. L., Mushotzky R. F., Richards E. A., 2001, AJ, 121, 662
- Benson et al. (2001) Benson A. J., Frenk C. S., Baugh C. M., Cole S., Lacey C. G., 2001, MNRAS, 327, 1041
- Blitz & Shu (1980) Blitz L., Shu F. H., 1980, ApJ, 238, 148
- Bower et al. (1992a) Bower R. G., Lucey J. R., Ellis R. S., 1992a, MNRAS, 254, 601
- Bower et al. (1992b) —, 1992b, MNRAS, 254, 589
- Boyle & Terlevich (1998) Boyle B. J., Terlevich R. J., 1998, MNRAS, 293, L49
- Burkert & Silk (2001) Burkert A., Silk J., 2001, ApJ, 554, L151
- Chambers et al. (1990) Chambers K. C., Miley G. K., van Breugel W. J. M., 1990, ApJ, 363, 21
- Dey et al. (1997) Dey A., van Breugel W., Vacca W. D., Antonucci R., 1997, ApJ, 490, 698
- Draine & Lee (1984) Draine B. T., Lee H. M., 1984, ApJ, 285, 89
- Dunlop (1997) Dunlop J. S., 1997, in Observational Cosmology with the New Radio Surveys, Bremer M., et al., eds., Kluwer, p. 157
- Dunlop (2001) —, 2001, in UMass/INAOE conference proceedings on ‘Deep millimeter surveys’, Lowenthal J., Hughes D. H., eds., World Scientific, p. 11
- Dunlop et al. (1994) Dunlop J. S., Hughes D. H., Rawlings S., Eales S. A., Ward M. J., 1994, Nature, 370, 347
- Dunlop et al. (2002) Dunlop J. S., McLure R. J., Kukula M. J., Baum S. A., O’Dea C. P., Hughes D. H., 2002, MNRAS, in press, astro-ph/0108397
- Duschl et al. (2000) Duschl W. J., Strittmatter P. A., Biermann P. L., 2000, A&A, 357, 1123
- Eales et al. (1999) Eales S., Lilly S., Gear W., Dunne L., Bond J. R., Hammer F., Le Fèvre O., Crampton D., 1999, ApJ, 515, 518
- Ebisuzaki et al. (2001) Ebisuzaki T. et al., 2001, ApJL, 562, L19
- Edmunds & Eales (1998) Edmunds M. G., Eales S. A., 1998, MNRAS, 299, L29
- Elmegreen & Lada (1977) Elmegreen B. G., Lada C. J., 1977, ApJ, 214, 725
- Fabian (1999) Fabian A. C., 1999, MNRAS, 308, L39
- Fabian et al. (2000) Fabian A. C. et al., 2000, MNRAS, 315, L8
- Fan et al. (2001) Fan X. et al., 2001, AJ, 122, 2833 astro-ph/0108063
- Fan et al. (2000) Fan X. et al., 2000, AJ, 119, 1
- Figer et al. (1998) Figer D. F., Najarro F., Morris M., McLean I. S., Geballe T. R., Ghez A. M., Langer N., 1998, ApJ, 506, 384
- Franceschini et al. (2000) Franceschini A., Bassani L., Cappi M., Granato G. L., Malaguti G., Palazzi E., Persic M., 2000, A&A, 353, 910
- Frayer & Brown (1997) Frayer D. T., Brown R. L., 1997, ApJS, 113, 221
- Friaca & Terlevich (1998) Friaca A. C. S., Terlevich R. J., 1998, MNRAS, 298, 399
- Fryer et al. (2001) Fryer C. L., Woosley S., Herger A., 2001, ApJ, 550, 372
- Granato et al. (2001) Granato G. L., Silva L., Monaco P., Panuzzo P., Salucci P., De Zotti G., Danese L., 2001, MNRAS, 324, 757
- Herbig (1962) Herbig G. H., 1962, ApJ, 135, 965
- Hillebrandt (1982) Hillebrandt W., 1982, A&A, 110, L3
- Hughes et al. (1998) Hughes D. H. et al., 1998, Nature, 394, 241
- Jimenez et al. (2002) Jimenez R., Dunlop J., Padoan P., Peacock J., MacDonald J., Jørgensen U. G., 2002, MNRAS, submitted
- Jimenez et al. (1999) Jimenez R., Friaca A. C. S., Dunlop J. S., Terlevich R. J., Peacock J. A., Nolan L. A., 1999, MNRAS, 305, L16
- Jimenez & MacDonald (1996) Jimenez R., MacDonald J., 1996, MNRAS, 283, 721
- Jimenez et al. (2000) Jimenez R., Padoan P., Dunlop J. S., Bowen D. V., Juvela M., Matteucci F., 2000, ApJ, 532, 152
- Jimenez et al. (1998) Jimenez R., Padoan P., Matteucci F., Heavens A. F., 1998, MNRAS, 299, 123
- Jimenez et al. (1996) Jimenez R., Thejll P., Jørgensen U. G., MacDonald J., Pagel B., 1996, MNRAS, 282, 926
- Kochanek et al. (2001) Kochanek C. S. et al., 2001, ApJ, 560, 566
- Kormendy & Gebhardt (2001) Kormendy J., Gebhardt K., 2001, in The 20th Texas Symposium on Relativistic Astrophysics, Martel H., Wheeler J. C., eds., AIP
- Kukula et al. (2001) Kukula M. J., Dunlop J. S., McLure R. J., Miller L., Percival W. J., Baum S. A., O’Dea C. P., 2001, MNRAS, 326, 1533
- Lada et al. (1991) Lada E. A., Evans N. J., Depoy D. L., Gatley I., 1991, ApJ, 371, 171
- Laor (1998) Laor A., 1998, ApJ, 505, L83
- Madau & Rees (2001) Madau P., Rees M. J., 2001, ApJ, 551, L27
- McLure & Dunlop (2002) McLure R. J., Dunlop J. S., 2002, MNRAS, 331, 795
- Merritt & Ferrarese (2001) Merritt D., Ferrarese L., 2001, MNRAS, 320, L30
- Miyaji et al. (2000) Miyaji T., Hasinger G. ., Schmidt M., 2000, A&A, 353, 25
- Nomoto et al. (1984) Nomoto K., Thielemann F.-K., Wheeler J. C., 1984, ApJ, 279, L23
- Pentericci et al. (2001) Pentericci L., McCarthy P. J., Röttgering H. J. A., Miley G. K., van Breugel W. J. M., Fosbury R., 2001, ApJS, 135, 63
- Renzini & Voli (1981) Renzini A., Voli M., 1981, A&A, 94, 175
- Scott et al. (2002) Scott S. et al., 2002, MNRAS, 331, 817
- Silk & Rees (1998) Silk J., Rees M. J., 1998, A&A, 331, L1
- Smail et al. (2000) Smail I., Ivison R., Blain A., Kneib J.-P., Owen F., 2000, in ASP Conf. Ser. 195: Imaging the Universe in Three Dimensions, van Breugel W., Bland-Hawthorn J., eds., p. 248
- Smail et al. (1997) Smail I., Ivison R. J., Blain A. W., 1997, ApJ, 490, L5
- Small & Blandford (1992) Small T. A., Blandford R. D., 1992, MNRAS, 259, 725
- Somerville & Primack (1999) Somerville R. S., Primack J. R., 1999, MNRAS, 310, 1087
- van Breugel et al. (1998) van Breugel W. J. M., Stanford S. A., Spinrad H., Stern D., Graham J. R., 1998, ApJ, 502, 614
- van Breugel et al. (1999) van Breugel W. J. M., De Breuck C., Stanford S. A., Stern D., Rottgering H., Miley G. K., 1999, ApJ, 518, L61
- Woosley & Weaver (1995) Woosley S. E., Weaver T. A., 1995, ApJS, 101, 181
- Xu & de Zotti (1989) Xu C., de Zotti G., 1989, A&A, 225, 12
- Zepf (1997) Zepf S. E., 1997, Nature, 390, 377
- Zepf & Silk (1996) Zepf S. E., Silk J., 1996, ApJ, 466, 114