Long-term Multi-wavelength Observations of GRS 1758–258 and the ADAF Model
Abstract
We present a long-term multi-wavelength light curve of Galactic black hole candidate GRS 1758–258 by combining previously published and archival data from GRANAT, ROSAT, CGRO, RXTE, BeppoSAX, ASCA, EXOSAT, and the VLA. In addition we include first spectral results from the balloon-borne Gamma-ray Arcminute Telescope Imaging System (GRATIS). In light of divergent analyses of the 1991–1993 ROSAT observations, we have re-analyzed these data; we find the soft X-rays track the hard X-rays, and that the fits require no black-body component— indicating that GRS 1758–258 did not go to the high state in 1993. We offer an interpretation based on the ADAF model for a system with . We find the 1990–1993 coeval hard and soft X-ray observations support the ADAF predictions. We discuss a new way to constrain black-hole mass with spectral data and the ADAF theory, and apply this technique to GRS 1758–258 to find –9 at an assumed distance of 8.5 kpc. Further investigations of the ADAF model allow us to evaluate the model critically against the data and flux-flux diagram of Barret, McClintock, & Grindlay (1996) and to understand the limits of the latter’s “X-ray burster box.”
1 Introduction
GRS 1758–258 is one of the most fascinating objects in the X-ray/gamma-ray sky and we have much to learn about it yet. For being second only to 1E 1740.7–2942 as the brightest persistent gamma-ray source near the Galactic center (Main et al., 1999), GRS 1758–258 remains an enigma. Not only do its remoteness and high column density obscure it, but its proximity to GX 5–1, which delayed its discovery until 1990, even now poses a minor obstacle to low-energy () observations.
The few established facts about GRS 1758–258 are tantalizing. The search for a counterpart in the optical and infrared turned up no distinct result, but only two or more candidates within (Martí et al., 1998). Even more interestingly, Rodríguez and collaborators working with the VLA found not one, but at least three radio sources near the X-ray source that have a roughly jet-like symmetry with respect to it (Rodríguez et al., 1992). This weak jet structure reveals GRS 1758–258, just as its neighbor 1E 1740.7–2942, to be a microquasar (Mirabel et al., 1993, 1992a), but with a lower column density than 1E 1740.7–2942 (cf. e.g. Main et al., 1999), making it more amenable to observation. GRS 1758–258 also shows similarities to Cyg X-1, in that persistent, low-level hard emission dominates its luminosity (Tanaka & Lewin, 1995; Liang, 1998). This persistence puts GRS 1758–258 among the type III BHB’s of Zhang et al. (1997b), while the radio jets put it among Zhang et al.’s type II BHB’s.
In this paper we combine data from published and publicly available data from high-energy missions and the VLA to produce a long-term light curve for the source in the radio and in soft and hard X-rays. We performed our own reduction of the VLA data, including several observations without published results. In the first part of the paper (§2), we enumerate the diverse data sources that we have tapped, and our handling of them, especially of the 1990–1993 ROSAT observations (§2.2), which are the only soft X-ray observations bridging the 1991–1992 hard X-ray dip.
Second, we compare the data from the various data sets with each other, and with results of observations of other celestial objects (§3). Most notably, we find (§3.1) no ultra-soft component throughout the twelve years spanned by the soft X-ray observations, strongly arguing against the possibility that GRS 1758–258 was in the high state at any of those times. We investigate possible correlations of hard X-rays with soft X-rays, and the hard X-rays with spectral shape.
In §4 we combine the ROSAT data with those of GRANAT to constrain models of accretion disk emission: the ADAF model (§4.1), the two-temperature model (§4.2), and the disk corona model (§4.3). Finally in §5 we show that the ADAF model explains properties of the flux-flux diagram and “X-ray Burster Box” of Barret et al. (1996), and evaluate the model in light of the diagram and data of that paper.
2 Observations
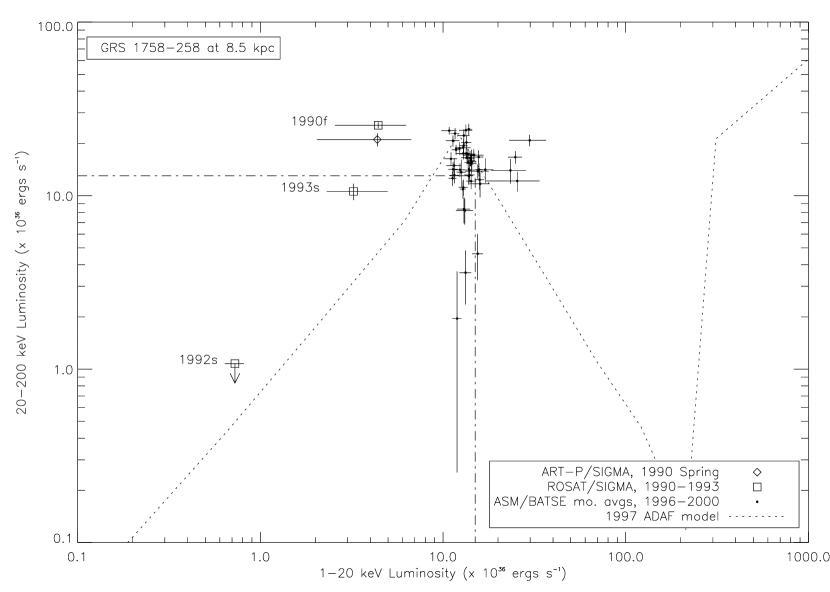
In figure 1 we combine data from many instruments to produce a long-term light curve and spectral index history for the source. The soft X-ray light curve is of unabsorbed flux.
Below we briefly describe the major instruments and how the data were derived. Other instrument characteristics are listed in table 1. Minor, miscellaneous instruments are listed in table 2.
2.1 GRANAT
The ART-P and SIGMA telescopes on the Russian GRANAT satellite discovered GRS 1758–258 in March–April 1990 (Mandrou, 1990). GRANAT observed the source seasonally through spring 1996.
The power-law indices in the plot come from table 1 of Kuznetsov et al. (1999). This table contains results of fitting two seasonal spectra a year to a power-law over the range 30–300 keV. Above 150 keV the spectrum decays exponentially. In order to get results comparable to other experiments’ fits below 150 keV, we had to band-limit the GRANAT photon indices. We fit the spectrum from the sum of their data (shown in their figure 5) below 150 keV in XSPEC to , This index is 0.304 less than the power-law index for the full 30–300 keV range. We subtracted this number from each of their table 1 indices to derive the band-limited index below 150 keV. This procedure assumes the temporal independence of the spectral shape, an assumption supported by the lack of evidence for change in spectral hardness (Kuznetsov et al., 1999).
The fluxes in the plot were produced by adding to the flux derived from their 40–200 keV luminosities (their table 1), a power-law flux from 20–40 keV, calculated using the just-derived band-adjusted index.
2.2 ROSAT
ROSAT observed GRS 1758–258 in September 1990, March 1992 and spring 1993, spanning the hard X-ray dip of 1991–1992. In section 3, we use these data to constrain the corona models for disk emission and the ADAF model. They are pivotal to our argument that there was no ultrasoft component in 1993 and that the soft and hard X-rays tracked through the 1991–1992 dip.
Two groups have published analyses of the ROSAT/PSPC’s 31 March–2 April 1993 pointed observation of GRS 1758–258: Mereghetti et al. (1994) and Grebenev et al. (1997, Proc. 2nd Integ. Workshop.). The original 1994 analysis found a high soft component and took source counts from a radius of around the source in an effort to collect dust-scattered photons; this analysis took background counts from five circles of radius in the external regions of the detector to avoid contamination by GX 5–1.
On the other hand, the 1997 re-analysis of the 1993 data showed a relatively low soft component, and conjectured that the difference comes from “contamination of the field [of the original analysis] by the nearby very bright source GX 5–1.” For this analysis “source and background counts were extracted from a circle of radius and an annulus of radii (both centered at the GRS 1758–258 position)” to exclude contamination by GX 5–1.
We conducted an independent analysis of the 1993 observation. In order to set the extraction radius for GRS 1758–258 we considered several factors. We wanted to include at least 90% of the photons from the source, taking into account the scattering halo (assumed to scale with that of GX 5–1, cf. Predehl & Schmitt, 1995) while firmly excluding any photons from GX 5–1. In addition we wanted to eliminate any contribution from the brighter background sources, in particular 1WGA J1800.2–2539 (localized only in 1995) at 13.5 arcminutes from GRS 1758–258. After examining several trial radii we compromised on an extraction radius of nine arcminutes, with background selected from a nine-arcminute radius circle at the western edge of the detector. To exclude any possible contamination from GX 5–1, we extracted background from an area outside the central ring of the PSPC (cf. e.g. Chu et al., 2000) rather than the usual annular region just outside the central source region.
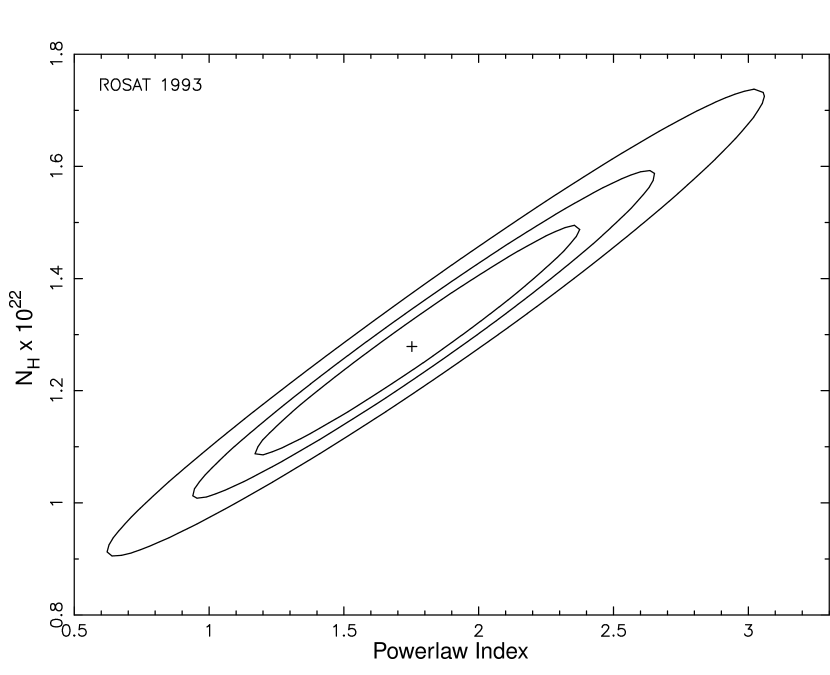
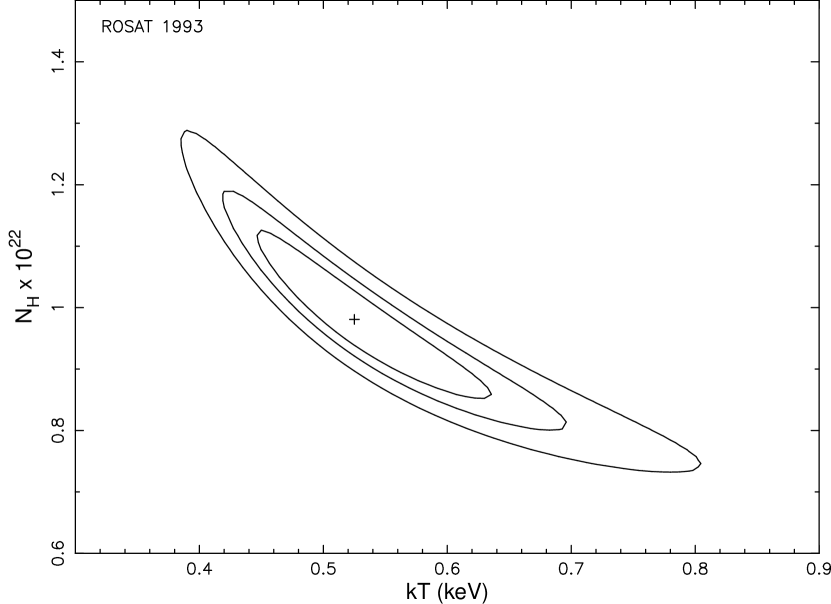
After extraction, the data were fit in XSPEC to a power-law with photoelectric absorption and then to a black-body with absorption, giving the respective best-fit values of , cm-2 (), and , cm-2 (). Figure 2 shows the error contours of our fits. It is noteworthy that the black-body fit is inconsistent at more than the four-sigma level with the standard column () for the source (Mereghetti et al., 1997; Heindl & Smith, 1998; Main et al., 1999). We will more fully address the blackbody fit in §3.1 below, but suffice it to say for now that our fits indicate the black-body component is incompatible with the accepted column for the source.
The count rate for the 7900-second spring 1993 observation was cts s-1 for 0.1–2.4 keV. The 1990 September 10–12 All-Sky Survey observation of the source had a slightly higher count rate of cts s-1 for the same energy range. This count rate comes from the HEASARC ROSAT All-Sky Survey Bright Source Catalog, as revised in 1996, which supersedes the cts s-1 reported in Mereghetti et al. (1994). The latter paper used preliminary data to conclude that the “soft and hard spectral components are anti-correlated [if one ignores the 1992 observation]. Between 1990 September and 1993 March both varied by about a factor of 2, but in opposite directions”. Based on the more definitive count rate, we find no anti-correlation, but rather a correlation between the 1990 and 1993 soft X-ray fluxes. The HRI observation 13 March 1992 reported a rate of cts s-1, statistically consistent with the cts s-1 reported in Mereghetti et al. (1994).
No spectral information is available from the 1990 ROSAT All-Sky Survey observation. The HRI data provides no spectral information. Thus we have assumed the 1993 spectral shape for all three observations in deriving the unabsorbed fluxes in table 3, which is quite reasonable, given the large error bars on our photon index, which easily encompasses the majority of indices in figure 1.
Grebenev et al. (1997) found for the 4100-second 5 March 1992 off-axis PSPC observation of GRS 1758–258 a power-law index of . In contrast, we consider their flux for this observation to be somewhat suspect since the proper extraction area is not unambiguous in this distorted region of the focal plane.
In extrapolating ROSAT fluxes for figure 1, we assume the photon index of 1993 held for 1990, but we use Grebenev’s 2.47 for the 1992 observation.
2.3 CGRO
CGRO/BATSE data comes from NASA’s Marshall Space Flight Center: the 20–100 keV fluxes and their associated errors were produced by fitting each day’s BATSE Earth occultation data to a powerlaw with spectral index 1.8. To extend the energy range of the flux to 200 keV, we ignored the exponential cutoff above and simply continued the power-law index of 1.8 out to 200 keV. (We added a 30% correction to better agree with the GRANAT fluxes.)
Deriving the photon indices proved more of a challenge. For each
viewing period we produced the .pha and .rmf files with
the standard FTOOLS bod2pha and bod2rmf. We then fit
the data from each viewing period to a powerlaw within XSPEC and
recorded the results. To give the values plotted in the figure, we
performed weighted averages of the spectral indices for each of three
periods within each observational cycle. The errors on the indices
are large, but they hint at a trend resembling an upside-down cycloid,
with a cusp occurring during the hard X-ray dearth of 1991–1992, and
another in the dearth of 1999.
2.4 RXTE
The ASM fluxes presented in figure 1 are derived from “quick-look” results provided by the RXTE/ASM team and archived at MIT. These light-curves are binned into three energy bands, 1.5–3 keV, 3–5 keV, and 5–12 keV. We converted these to fluxes by comparing the count rates with the average ASM Crab count rates in each channel, and extrapolated to 20 keV using a power-law index from the last two bands. The power-law indices ranged from but have been omitted from the PLI plot because of their large errors ().
Except for the two-month spike at the end of 1998-beginning of 1999, the ASM data is flat not only in figure 1, but also in the individual bands. There is no sign of the oscillation from late February to September 1999 noted by Smith et al. (1999). It is difficult to tell if the flatness is meaningful, or the result of inclusion of the Galactic diffuse emission or other discrete sources in the ASM’s large field of view. It might be possible to subtract the diffuse emission, but unfortunately, the sky coordinates and position angle of each pointing are not readily available.
2.5 Other X-ray Data
Data from the 10 April 1997 BeppoSAX observation were obtained from the NASA’s HEASARC archive and fit in XSPEC to a power-law with (MECS) cm-2, , for and (LECS) cm-2, , for . For the PDS data, we found with for .
GRATIS is a balloon-borne coded aperture imaging experiment consisting of 36 co-aligned one-dimension telescopes with a total effective area of 378 cm2 at 30 keV. Each telescope consists of a two-mm-thick CsI(Na) crystal coupled to a photomultiplier tube (PMT) passively collimated to have a field of view (FWZI). The average energy resolution of the detectors is 19% at 60 keV. GRATIS is more fully described in Harrison et al. (1989) and Keck et al. (2001).
GRATIS observed GRS 1758–258 from 5:43 to 6:43 hours UT on 17 October 1995. GRATIS was launched on its balloon from Alice Springs in the center of the Australian outback at 23.80∘ S, 133.40∘ E. To remove the background contribution, we subtracted the blank-field pointing that immediately preceded this observation (4:43 to 5:43 UT) centered at , epoch 2000. This field contains no known high-energy sources. GRS 1758–258 is at whereas the background pointing is at . The two fields have comparable contribution from the Galactic diffuse emission, since the longitudinal variation is slow for (Iwan et al., 1982), and the latitudinal variation is nearly flat when (Valinia & Marshall, 1998, figure 2b). GX 5–1 lay just on the edge of the fine-collimator field of view for the source pointing. In principle the rotations of some of the tubes should permit photons from GX 5–1 to fall into the coarse-collimators’ field of view. Omitting data counts from these tubes did not significantly alter the 20–132 keV fit.
We unfolded the source counts using the standard XSPEC package from NASA’s HEASARC. The response matrix was constructed with Lawrence Livermore National Laboratory’s COG Monte-Carlo photon transport package (Buck & Lent, 1993; Wilcox & Lent, 1989). A more detailed description of data the analysis can be found in §4.1 of Keck (2001), available online111http://www.astro.columbia.edu/~jwk/thesis.pdf. The best-fit power-law model to the data has a photon index of with a reduced of 1.08 for nine degrees of freedom. The flux was () ergs cm-2 s-1.
The September 1985 EXOSAT/ME data came from the HEASARC archive data for EXO 1757-259, with GRS 1758–258 9.4 arcminutes off-center. The unfolded spectrum is plotted in Skinner (1990). The data file does not list the region of the detector from which the source counts were extracted, but the 45-arcminute field of view (FWHM) of the ME means that the observation may include contamination from GX 5–1 in addition to the Galactic diffuse emission. Using XSPEC we fit the data to a power-law with absorption: cm-2, , for .
The 1–20 keV flux point and upper limits for Mir-Kvant/TTM have been extrapolated assuming a power-law index of 1.8. Our data are taken from the one detection and five upper limits of Aleksandrovich et al. (1998).
For completeness, we mention that the flux of ergs cm-2 s-1 and power-law index of from the 15–180 keV POKER instrument (Bazzano et al., 1993). The error bar is far too large to add anything to the plot.
2.6 Radio Data
Radio fluxes measured by the Very Large Array (VLA) were originally published in Mirabel et al. (1992b); Mirabel & Rodríguez (1993); Rodríguez et al. (1992); Lin et al. (2000b)222The 16 July 1992 flux quoted in Mirabel & Rodríguez (1993) supersedes that in Rodríguez et al. (1992), according to Luis Rodríguez and Josep Martí (priv. comm., 2000).. The April 1997 data point was provided by Josep Martí.
As part of our review of the data on GRS 1758–258, we performed our own reduction of the VLA observations of GRS 1758–258, including those in 1994, 1995 and 1996, which have not been previously published. Only in 1997 did the VLA begin observations of GRS 1758–258 at cm, when Lin et al. (2000b) noted a flat spectral index. We used the classic, 15 October 1999 version of AIPS in our reduction. For all observations the gain calibrator was 1328+307 (a.k.a. 3C 286, 1331+305) and phase calibrator was 1748-253 (1751-253), except for the 3 August 1997 observation, which used 0134+329 (3C 48, 0137+331) for the gain calibrator. The phase calibrator had a boot-strapped flux density in the range 0.47–0.52 Jy. The upper limits in the plot of these points are one-sigma, while those for the previously published data are four-sigma.
The re-analyzed points are statistically compatible with the previously published results, as can be seen in the bottom panel of figure 1. The four additional points our analysis adds to the light-curve add no further correlation to the X-ray data.
3 Results
We now further analyze and integrate the observations to compose a picture of GRS 1758–258.
3.1 Black-body temperatures
Mereghetti et al. (1994) claimed to find a soft X-ray excess in 1993 data. Lin et al. (2000b) found that a fit to 1997 multi-instrument observation with a power-law with exponential cutoff (PLE) was just as good without the black-body () as with (). Mereghetti et al. (1997) found that the fits to the ASCA data did not require a black-body component as the model of a lone power-law gave an acceptable () fit.
Unlike the 1994 paper, but in agreement with the latter two papers, we find that a black-body component is not needed in the ROSAT data and in the observations of other soft X-ray missions.
As we mentioned in §2.2, the typically observed column density for GRS 1758–258 of cm-2 (Mereghetti et al., 1997; Heindl & Smith, 1998; Lin et al., 2000b) lies far outside the three-sigma contour for our black-body fit to the 1993 ROSAT/PSPC data, shown in figure 2. Our best-fit column with this model ( cm-2) is inconsistent with the usual column at the four- or five-sigma level. (While this could be an anomaly resulting from a sudden absence of intrinsic absorption, we find this explanation unlikely in explaining one highly deviant result.) Additionally the power-law model provides a good fit consistent with the standard column (, see figure 2).
We also fit the data of other soft X-ray missions over twelve years. The spectra from all of these observations are very similar to the ASCA spectrum in figure 3 of Mereghetti et al. (1997). Table 4 shows ’s that result with and without a black-body component added to the powerlaw fit. The respective results are comparable, indicating that the ultrasoft component is unnecessary. As discussed above, the black-body component is characteristic of the high state, so the lack of it indicates that none of these observations occurred in that state. Furthermore, the absence of any major hard X-ray flux changes strongly argues against the source changing states in this period. Thus we conclude that the source was not in the high state in this period.
Mereghetti et al. (1997) estimated that to hide an ultrasoft component behind a hot corona requires a relatively large scattering opacity .
As expected, the black-body temperatures fall in the range . For comparison, the black-body plus power-law fit to the 1995 ASCA data in Mereghetti et al. (1997) found a black-body temperature around 0.4–0.5 keV. The best-fit HT model of Lin et al. (2000b) to the 1997 August XTE data gave a black-body temperature .
3.2 High- and Low-energy Fluxes & Flux-Flux Diagram
Whereas an anti-correlation between the hard and soft X-ray fluxes is the usual sign of the transition between a low (hard) state and a high (soft) state, the correlation of the ROSAT data with the GRANAT data through the 1991–1992 dip indicates that such a transition did not take place.
Figure 3 illustrates the correlations, or lack of, between the hard X-ray (20–200 keV) luminosity and the soft X-ray (1–20 keV) in the manner of Barret et al. (1996, hereafter BMG).
The RXTE/ASM data does not show any significant correlation, positive or negative, to the hard X-ray dip in 1999. Except for the two-month spike at the end of 1998-beginning of 1999, the ASM data is flat as shown in figure 1, and in the individual bands. There is no sign of the oscillation from late February to September 1999 noted by Smith et al. (1999). It is difficult to tell if the flatness is meaningful, or the result of inclusion of the Galactic diffuse emission or other discrete sources in the ASM’s large field of view. It might be possible to subtract the diffuse emission, but unfortunately, the sky coordinates and position angle of each pointing are not readily available.
3.3 Correlation between Spectral Intensity and Shape
Many black-hole candidates (e.g. Cyg X-1) display spectral pivoting, so that the flux in a narrow energy band () remains relatively constant in time, while the fluxes at higher and lower energies anti-correlate. This phenomenon occurs between the high and low states, in what is known as the intermediate state. A consequence of spectral pivoting is that while the bolometric luminosity remains relatively constant (Zhang et al., 1997a), a correlation is established between the flux and power-law index in any given band above or below the pivot.
The GRANAT photon indices are consistent with a constant spectral slope because of the large error bars. We see a suggestion of a correlation between BATSE fluxes and spectral indices in figure 1. For example, the flux dip of 1991–1992 has a higher index and therefore a softer spectrum.
We wanted to test for a correlation between the photon index and the flux, but calculation of flux assumes an index. Such a method can bias the results or exaggerate any correlation between intensity and shape.
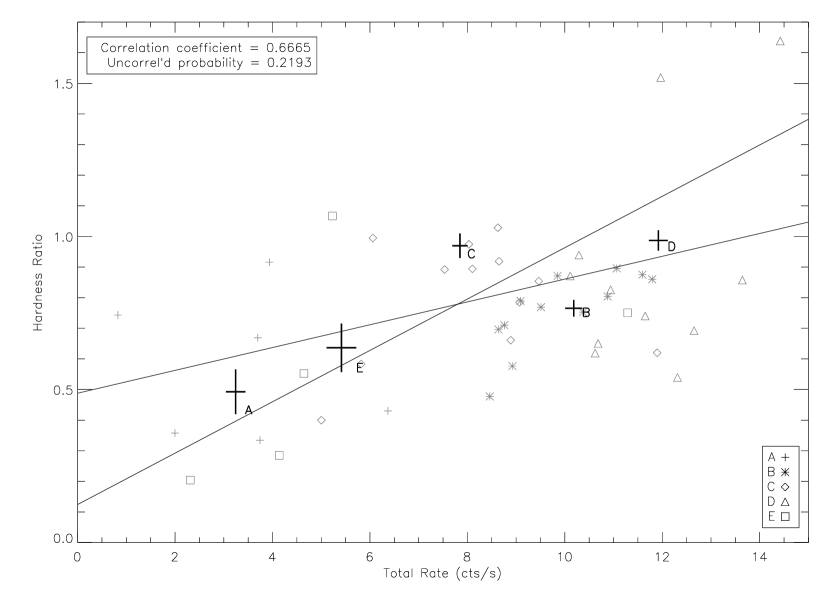
Hardness ratio and count rate are good metrics for photon index and flux, and have the advantage of being independent of one another. It is difficult to compare raw count rates across instruments, so we restrict our analysis to BATSE data, which has the longest temporal baseline.
We plot the hardness ratio (ratio of counts above and below 78 keV) against the total BATSE count rate in figure 4. The boundary between high and low counts is chosen to give a hardness ratio on average. The thick crosses represent averages over five periods that have similar total count rate throughout. From the slopes of linear fits to the averaged data, we find a linear-correlation coefficient (cf. Bevington & Robinson, 1992, pp. 198–200, §11.2). The probability of an uncorrelated parent distribution having a coefficient that big or bigger is only %, so there is a weak correlation between shape and intensity. Consequently we expect lower fluxes to have higher, softer photon indices, a conclusion that agrees with the predictions of the ADAF theory, discussed below (§4.1).
4 Discussion
Here we describe three models to account for the observed emission from GRS 1758–258. In all of these models, the soft X-ray emission comes from the disk and the hard X-ray emission comes from the corona or hot-electron cloud. The first is the advection dominated accretion flow model, which we apply in a novel way. The latter two are standard Keplerian accretion models.
In our discussions of the latter two models, we assume the argument of Shapiro, Lightman, & Eardley (1976) that the seed photons range in energy from 0.05 keV to 5 keV. (The exact mechanism of emission is not important, but possibilities include black-body emission from the disk and synchrotron radiation from disk electrons, as explained in Shapiro et al. (1976); Zhang et al. (1997b).) In these models, we explain the correlation between the hard and soft X-rays as a consequence of the Comptonization of soft X-rays into hard by the corona. The accurate determination of the ROSAT fluxes is critical here, as we extrapolate the soft X-ray flux from that data.
4.1 Advection Dominated Accretion Flow
We begin with the advection-dominated accretion flow (ADAF) model. This is the most mature model of black-hole accretion, in that its proponents have published spectral predictions (Esin et al., 1997, 1998). Thus we decided to test the model in detail for GRS 1758–258, and to scout out the theory-testing terrain that imminent observational improvements will open to detailed exploration.
The accretion flow has two zones: an inner advection dominated flow, and an outer thin accretion disk. The inner ADAF accretes into the black hole as a quasi-spherical two-temperature corona, while the thin disk is Keplerian. The soft X-ray emission comes from the disk and the hard X-ray emission comes from the corona.
The present model resembles the two-temperature model of Shapiro, Lightman, & Eardley (1976) with the difference that the transition radius between the quasi-spherical and Keplerian zones, , changes with accretion rate. The most notable characteristic of the model is that the state of black hole accretion, as illustrated in figure 1 of Esin et al. (1997, hereafter EMN), is controlled by one parameter, the mass accretion rate , where . The last definition assumes a ten percent radiative conversion efficiency. (This assumption is restricted to this definition; the radiative efficiency, , of the model itself varies with .)
In other words
or
Another significant feature of the ADAF theory is the scale invariance of the states: the theory is the same for black holes of any size, from Galactic to super-massive (Narayan & Yi, 1995), which means the radiative efficiency for a given is independent of black-hole (primary) mass, that is . Since the Eddington luminosity scales with the primary’s mass, the luminosity of any given state also scales with mass, thus establishing a correlation between black hole mass and luminosity at known :
If we know , we can compare the model luminosity at given mass to measured luminosity to find the mass of the observed black hole ().
We now use the mass-luminosity correlation and the observed flux extremes to constrain the mass of GRS 1758–258. Since the ADAF models scale with primary mass, the scale factor that best allows the model to fit the data fluxes is the same factor that must multiply the model’s assumed mass. In theory, the model’s mass scaled by the factor is then the mass of the primary. In reality, other model parameters such as the binary’s inclination angle , viscosity , and the fraction of the total pressure due to gas (as opposed to magnetic) pressure also effect the luminosity, though they do not effect all energies and all states uniformly, as does the primary mass . Additionally, since the model predicts luminosities while we measure fluxes, our technique only gives us the primary mass at an assumed distance , so instead of , we find .
We take the ADAF model from the curves of EMN for , , , for Nova Muscae, and of Esin et al. (1998, figure 1b) for for Cyg X-1. The luminosities of the high-state spectra for the 1997 model are not exactly correct because the high-state curves in figure 10 of EMN do not extend out to 200 keV. To overcome this limitation, we have replaced the curve with its suitably renormalized counterpart from Figure 1a of Esin et al. (1998); the two curves agree to a constant factor for their common energies. The remaining high-state hard luminosities are integrated from linear extrapolations, which may make them slightly high, though not by much, judging from the extrapolation of the curve.
The 1998 model is an incremental improvement to the 1997 model. Observational evidence from Życki et al. (1997) that the transition radius varies in the low state and not exclusively in the intermediate state moved the model’s authors to incorporate this feature. Other changes reflect that a different source is being modeled. Figure 4a of EMN makes it clear that instead of increases the flux in both soft and hard X-ray bands, at least for the low state. The change in is more complicated, as its value effects the value of . For , , while for , and the flux shifts to harder energies at the critical value, according to EMN’s figure 4b. The 1998 theory models Cyg X-1, but the authors do not make clear how its wind-driven nature effects the model.
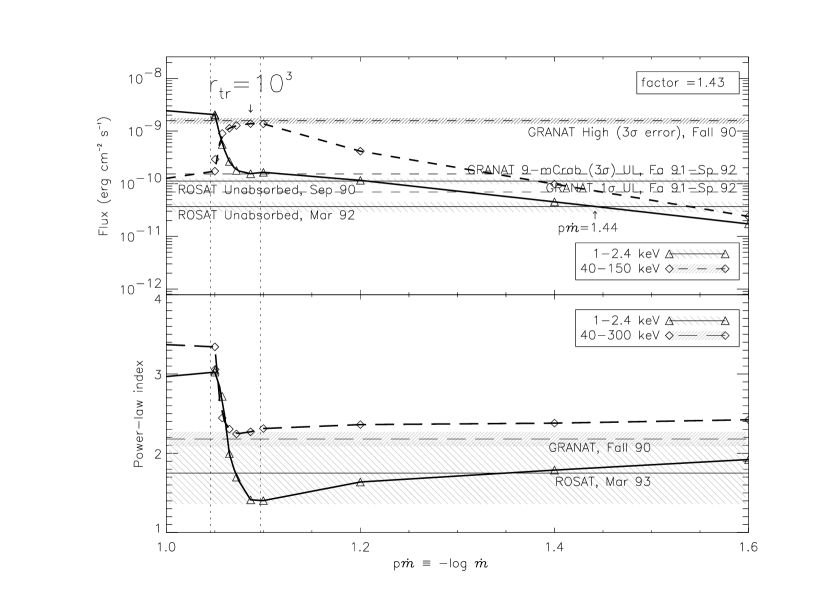
We find the minimum scaling factor for the model fluxes to produce the maximum observed hard X-ray fluxes is 1.43. For consistency, we can check that the GRANAT and ROSAT minima from the 1991–1992 dip are still possible with this multiplicative factor; we can also check the coeval photon indices. Figure 5 shows the model integrated over hard and soft energy bands as thick curves, along with the observed flux extremes in those bands, plotted as thin horizontal lines with hatched error bands. The ordinate is , so higher is to the left. We begin in the low state on the right hand side. Moving from right to left as increases, we see both the hard (dashed curve) and soft (solid curve) fluxes increase monotonically until we cross the first dotted vertical line, past which , putting the flow into the intermediate state. The transition radius, , rapidly contracts as we move to the left and the hard and soft emission bands ‘swap’ intensies. As we further increase past the second dotted line, the flow enters the high state, in which the soft flux increases while the hard flux decreases. The second panel of figure 5 shows the power law indices predicted by the model and observed by GRANAT and ROSAT. Note that the model’s hard X-ray power-law index increases with decreasing flux, in agreement with the intensity–shape correlation we saw in the BATSE data (§3.3).
We find that the theory is consistent with the GRANAT and ROSAT observations. The scaling factor multiplying the maximum hard model flux is just enough to reproduce the maximum GRANAT flux in 1990 of mCrab at the three-sigma lower-limit. The factor also allows the soft model flux to match the 1992 ROSAT observed flux minimum at the same p as the hard model flux falls below the coeval GRANAT upper limit. In the lower panel we see that the model’s hard photon index just brushes against the top error-bar of the GRANAT 1990 index at approximately the same p at which the 1990 GRANAT max occurs. At the p of the 1992 flux minima, the model’s soft photon index is well within the error bar of what we assume to be the coeval ROSAT index. So we find that the ADAF theory can consistently reproduce the GRANAT flux maximum and the ROSAT minimum at the same time as it predicts a hard X-ray flux that falls below the GRANAT upper-limit.
Furthermore, if we attribute the multiplicative factor of 1.43 to primary mass alone, then to agree with the GRANAT fall 1990 high at the three-sigma level, we must have .333The 1998 paper samples spectra more sparsely in p, so it is not clear what would be gained by a similar analysis with it. Again we note that the spectral consequences of the assumed values for inclination angle, viscosity and fractional gas pressure are not clear from the published ADAF papers.
We could achieve a more sophisticated constraint on the factor by running all of the ROSAT and GRANAT flux and photon index data through a chi-squared analysis, but the authors of the theory warn that “the uncertainties in the model are still too large to draw meaningful quantitative conclusions” (Esin et al., 1998), so such an analysis is unwarranted with the theory as it now stands.
This mass is similar to that found for Cyg X-1 which is interesting because Cyg X-1 remains usually in the low state with only occasional forays into the high. Unlike Cyg X-1, which has a massive companion and accretes via wind, the non-detection of an optical companion for GRS 1758–258 constrains its mass to (Chen et al., 1994), so it must accrete by Roche-lobe overflow. The other dynamically confirmed BHBs with identifiable secondaries also accrete by Roche-lobe overflow, but most of them have also been seen in a very high state (cf. figure 6, discussed in §5).
4.2 Comptonizing Donut Model
While our primary goal was to study the ADAF model, we thought it worthwhile to use our data with the two-temperature and corona models to derive analytic estimates for some relevant parameters.
We apply the data to the two-temperature model of Shapiro, Lightman, & Eardley (1976, hereafter SLE). The best fits to the spring 1993 observations data from ROSAT and GRANAT give , and . We use these indices to extrapolate the hard and soft fluxes measured by these missions to the required energy bands: ergs cm-2 s-1 and ergs cm-2 s-1. So .
We use these fluxes to derive model parameters. Combining the model’s assumed cloud temperature of with , we obtain . Our result agrees with others. Kuznetsov et al. (1999) fit the 1990–1997 GRANAT data to a Comptonized disk model and found and . on the other hand the best-fit HT (Titarchuk, 1994; Hua & Titarchuk, 1995) plus black-body model of Lin et al. (2000b) to the 1997 August XTE data gave with an electron (cloud) temperature .
We likewise find from our data the scattering fraction . So less than a third of the soft X-rays need be upscattered by a Comptonizing cloud that pushes the bounds of optical thinness to give the hard X-ray () spectrum in spring 1993. This result is consistent with the % SLE found by applying their model to Cyg X-1. Our simple analytic results agree with the broad conclusions of others concerning general model parameters.
4.3 Partial Disk Corona
We now consider the disk corona model first proposed by Liang & Price (1977) and Bisnovatyi-Kogan & Blinnikov (1977) as an alternative to the two-temperature model that would stabilize the disk. In this model the corona is adjacent to the disk and sandwiches it from above and below like an undersized hamburger bun. See Liang (1998) for further discussion.
As with the previous model, the disk emits soft X-rays which are then Compton up-scattered to produce the hard X-rays . The corona covers some fraction, , of the disk, so of the original photons have no chance of interacting with it. If the corona’s optical depth is , another of the original photons pass through the corona unaffected. The formalism for deriving the covering fraction in terms of observables is identical to that of the previous model, with . The covering fraction is then
The extrapolated luminosity ratio () from the spring 1993 ROSAT and GRANAT data remains . From the GRANAT spring 1993 Comptonized disk model temperature of and , we find and . For this , we get the same amplification factor as for the previous model, , so the covering fraction –35%. So less than about a third of the emitting region of the disk was covered by a corona in spring 1993.
Our purely spectral analysis provides independent confirmation of results from timing data. Lin et al. (2000a) found that the lack of PDS steepening with increasing photon energy eliminated the model investigated by Böttcher & Liang (1998). Maccarone & Coppi (2001) found a % reprossessing fraction by interpreting the soft X-ray lags in XTE J 1748–2848 with a radiative feedback model.
5 Further Inquiries with the ADAF Model
We now explore the ADAF model in the context of the flux-flux diagram of Barret, McClintock, & Grindlay (1996, BMG). We find that the ADAF model explains the boundaries of the “burster-box” and reveals a gap in the diagram’s differentiation of black-holes from neutron stars.
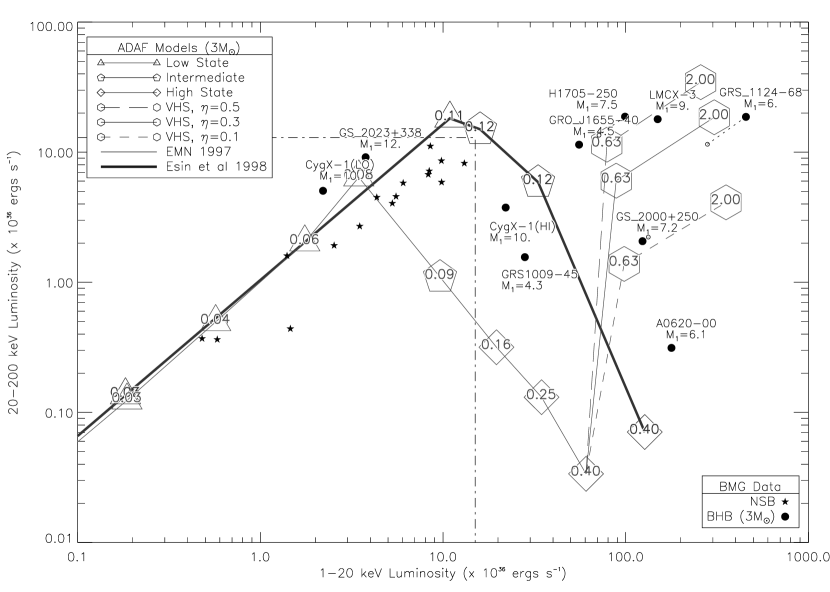
In figure 6 we re-present figure 13 of Barret et al. (2000) overlaid with the tracks of the ADAF models of Esin et al. (1997, EMN) and Esin et al. (1998). To make the comparison meaningful, we have scaled the luminosities of each black hole binary by , and the respective 1997 and 1998 models by and . So assuming scale invariance of the ADAF model holds, we normalize the luminosities to .
With one exception, all of the black hole binaries (BHBs) are in reasonable agreement with the theory (though, since BMG’s data lacks error bars, it is difficult to tell what reasonable means). The solid points show the BHBs at their highest observed hard luminosities, so it is no surprise that the plot catches them either at the corner that represents or in the very-high state. The 1996 paper flags A0620-00 as having a somewhat doubtful hard X-ray tail. With that one exception, the models appear to have good agreement with the theory, including the very high state theory. No one value for the fraction of disk energy dissipated directly in the corona, , clearly stands out, but is reasonably close to three BHB points, whereas the other two values of have only one each. It is remarkable that the 1998 theory, which was constructed for Cyg X-1, predicts soft X-rays that are not only over-luminous in both low and high states, but that are both over-luminous by the same factor of . A similar factor obtains for GRS 1009-45, whose mass has only recently been measured (Filippenko et al., 1999).
Remarkably the 1998 theory places the transition between low and intermediate states, which is the first simultaneous maxima of soft and hard X-rays, at the corner of the burster box. Notice that the neutron-star binaries (NSBs), which have not been renormalized by mass, lie along the theory’s low-state line (which runs roughly parallel to the line along which the luminosity points scale with ). Consequently the BMG plot does not distinguish low-state BHBs from NSBs. Since NSBs would likely show a black-body component (Narayan et al., 1997) and this component appears in BHBs only with the onset of the intermediate and high states, perhaps the presence or absence of the black-body component would distinguish NSBs from BHBs within the box. This criterion falls short if the 1997 model is the more accurate, because the model predicts that intermediate-state and some high-state black holes fall in the box.
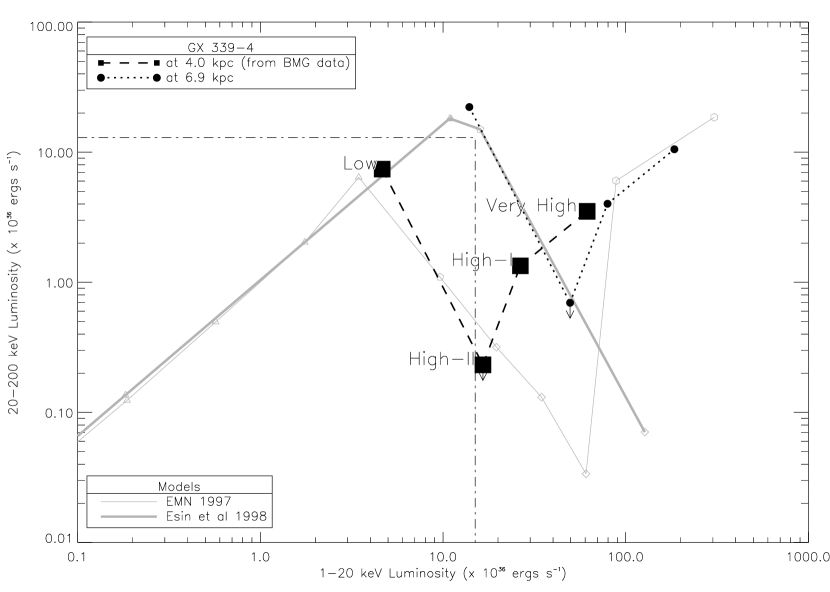
BMG’s figure 3 shows the plot for four observations of GX 339-4 at an assumed distance of 4.0 kpc. The points in the plot are labeled from left to right “Low state,” “High state II,” “High state I,” “Very high state.” (The nomenclature is apparently different from that of the ADAF papers.) In figure 7 we compare this data to the ADAF models at minimal () black-hole mass. We see that the high-state segment of the 1997 model agrees reasonably well with the data, but that the “high-I data point” (third from left) is somewhat distant from both the high and the very-high state segments. EMN caution that their very-high state is speculative. Esin et al. (1998) do not treat this state for Cyg X-1, so we do not know how the very-high-state theory changes with the change in parameters between the papers, but it is safe to assume that it cannot change without losing agreement with the BHB points on the BMG plot of figure 6. This part of the theory comes reasonably close to the data, as well as giving good agreement between the data and the 1998 model for the low and high states, on the assumption that GX 339–4 is a factor of more distant, in closer proximity to the Galactic center ( kpc). The typical absorption column to the source (1– cm-2; Belloni et al., 1999; Méndez & van der Klis, 1997) is consistent with this conclusion. Of course, any agreement with the ADAF theory presumes that the source is in fact a black hole, a premise which is not without dissent (e.g. Cowley et al., 1987). The same authors estimate the 4.0 kpc distance to the source from its color and by assuming its interstellar line velocity is due to differential rotational in the Galactic plane.
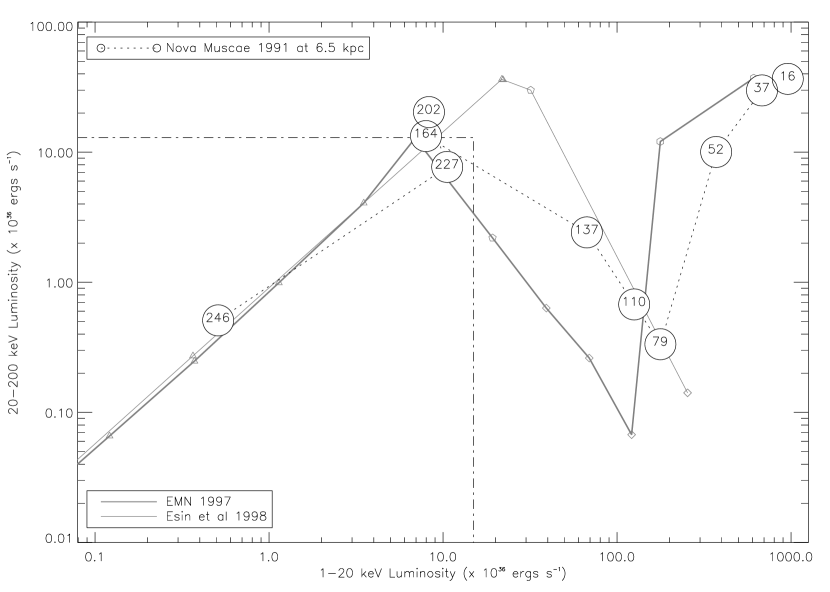
BMG’s figure 2 shows the plot for ten points from the burst of Nova Muscae 1991 (GRS 1124-68) after its X-ray maximum 16 January of that year. In figure 8 we compare this data to the ADAF models at () black-hole mass. Recall that the model of EMN (1997) was constructed to fit this source. It is not surprising that the EMN model fails to fit the very high state data, since the model’s authors ventured only a tentative proposal for that state. What is surprising is that the high-state model is so far removed from the data, as figure 12 of EMN primed us to expect that the model was in much better agreement with this state.
6 Conclusion
We have seen that the preponderance of the data indicates that GRS 1758–258 was in a low state in the early 1990’s, since there was no black-body component (§3.1) and the soft and hard X-rays were correlated (§3.2). (Lack of dependable soft X-ray data prevents us from speaking about the 1999 X-ray dearth.) We found a correlation between the hard X-ray spectral intensity and shape.
We applied the data to three models of accretion disk emission and used it to constrain the geometries of the Comptonizing torus (§4.2) and the disk-corona models (§4.3). In the former, two-temperature model, less than a third of the soft photons are upscattered to give the observed hard emission, while the latter disk-corona model would say that about the same fraction of the disk is covered by a corona, consistent with the % reprocessing fraction found by SLE in applying their theory to Cyg X-1.
In §4.1 we found that the coeval GRANAT and ROSAT data were consistent with the ADAF theory for an accreting black hole that spends most of its time in the low state, but perhaps occasionally sidles up into the intermediate state. The correlation between the hard X-ray intensity and spectral shape observed in the BATSE data (§3.3) further supports the theory. We then introduced a new technique for constraining the mass of the primary and applied it to GRS 1758–258. With the present data we constrained the mass of the black hole primary .
In §5 we critically assessed the ADAF model against the flux-flux diagram of Barret et al. (1996, BMG). We found that the ADAF model explains the high-luminosity corner of the “burster-box” but also raises the possibility that the box includes not only the advertised neutron stars, but also some low-luminosity black holes. Furthermore we found differences between the ADAF model and BMG’s data for Nova Muscae 1991 and GX 339-4. The discrepancy for the latter appears to be overcome by positing a distance of kpc instead of 4.0 kpc.
For a more critical test of the ADAF theory along this same line, additional data from binaries in various states is necessary. Continuous all-sky monitoring in both the soft and hard X-ray bands, such as would be provided by EXIST (Grindlay et al., 2000; Grindlay & EXIST Science Working Group, 2000), would be key to this effort, and the luminosity’s mass-scaling allows us to compare directly the tracks of black holes of diverse masses across a flux-flux diagram such as BMG’s. (As many BHC’s have exponential tails [Liang 1998], lowering the upper limit of the hard flux of the diagram to could well improve its convenience and resolving power in comparing BHC’s.) Timing signatures (cf. Belloni et al., 1999) could then establish the corresponding accretion state.
References
- Aleksandrovich et al. (1998) Aleksandrovich, N. L., Borozdin, K. N., Emel’Yanov, A. N., Sunyaev, R. A., & Skinner, G. K. 1998, Astronomy Letters, 24, 742
- Barret et al. (1996) Barret, D., McClintock, J. E., & Grindlay, J. E. 1996, ApJ, 473, 963+
- Barret et al. (2000) Barret, D., Olive, J. F., Boirin, L., Done, C., Skinner, G. K., & Grindlay, J. E. 2000, ApJ, 533, 329
- Bazzano et al. (1993) Bazzano, A., Cocchi, M., La Padula, C., Sood, R., & Ubertini, P. 1993, Astronomy & Astrophysics Supplement Series, 97, 169
- Belloni et al. (1999) Belloni, T., Méndez, M., van der Klis, M., Lewin, W. H. G., & Dieters, S. 1999, ApJ, 519, L159
- Bevington & Robinson (1992) Bevington, P. R. & Robinson, D. K. 1992, Data Reduction and Error Analysis for the Physical Sciences (McGraw-Hill, Inc.)
- Bisnovatyi-Kogan & Blinnikov (1977) Bisnovatyi-Kogan, G. S. & Blinnikov, S. I. 1977, A&A, 59, 111
- Böttcher & Liang (1998) Böttcher, M. & Liang, E. P. 1998, ApJ, 506, 281
- Buck & Lent (1993) Buck, R. & Lent, E. 1993, LLNL Energy and Technology Review
- Chen et al. (1994) Chen, W., Gehrels, N., & Leventhal, M. 1994, Astrophysical Journal, 426, 586
- Chu et al. (2000) Chu, Y., Kim, S., Points, S. D., Petre, R., & Snowden, S. L. 2000, AJ, 119, 2242
- Cowley et al. (1987) Cowley, A. P., Crampton, D., & Hutchings, J. B. 1987, AJ, 93, 195
- Esin et al. (1997) Esin, A. A., McClintock, J. E., & Narayan, R. 1997, ApJ, 489, 865+
- Esin et al. (1998) Esin, A. A., Narayan, R., Cui, W., Grove, J. E., & Zhang, S. 1998, ApJ, 505, 854
- Filippenko et al. (1999) Filippenko, A. V., Leonard, D. C., Matheson, T., Li, W., Moran, E. C., & Riess, A. G. 1999, PASP, 111, 969
- Gilfanov et al. (1993) Gilfanov, M., Churazov, E., Sunyaev, R., Khavenson, N., Novikov, B., Dyachkov, A., Kremnev, R., Sukhanov, K., Bouchet, L., Mandrou, P., Roques, J. P., Vedrenne, G., Cordier, B., Goldwurm, A., Laurent, P., & Paul, J. 1993, Astrophysical Journal, 418, 844+
- Grebenev et al. (1997) Grebenev, S. A., Pavlinsky, M. N., & Sunyaev, R. A. 1997, in Proc. of the 2nd INTEGRAL Workshop “The Transparent Universe” (held in St. Malo, France, Sept. 16-20, 1996, eds. Winkler, C.; Courvoisier, T.; Durouchoux, Ph.), ESA SP-382, pp. 183-186, 183–186
- Grindlay et al. (2000) Grindlay, J., Bildsten, L., Chakrabarty, D., Elvis, M., Fabian, A., Fiore, F., Gehrels, N., Hailey, C., Harrison, F., Hartmann, D., Prince, T., Ramsey, B., Rothschild, R., Skinner, G., & Woosley, S. 2000, in Proceedings of the Fifth Compton Symposium, ed. M. L. McConnell & J. M. Ryan (American Institute of Physics), 141–162
- Grindlay & EXIST Science Working Group (2000) Grindlay, J. & EXIST Science Working Group. 2000, AAS/High Energy Astrophysics Division, 32, 2004+
- Harrison et al. (1989) Harrison, F. A., Kahn, S. M., Hailey, C. J., Ziock, K. P., & Lubin, P. M. 1989, Proc. SPIE, 1159, 36
- Heindl & Smith (1998) Heindl, W. A. & Smith, D. M. 1998, Astrophysical Journal, 506, L35
- Hua & Titarchuk (1995) Hua, X. & Titarchuk, L. 1995, ApJ, 449, 188+
- Iwan et al. (1982) Iwan, D., Shafer, R. A., Marshall, F. E., Boldt, E. A., Mushotzky, R. F., & Stottlemyer, A. 1982, ApJ, 260, 111
- Jung et al. (1993) Jung, G., Kurfess, J., Johnson, W., Strickman, M., Kinzer, R., Purcell, W., Grabelsky, D., & Ulmer, M. 1993, in The Second Compton Symposium: AIP Conference Proceedings, ed. Fichtel, C. and Gehrels, N. and Norris, J.P., Vol. 304, 427–430
- Keck et al. (2001) Keck, J., Craig, W., Hailey, C., Harrison, F., Hong, J., Kahn, S., Lubin, P., McLean, R., Pivovaroff, M., Seiffert, M., Wurtz, R., & Ziock, K. 2001, Nuclear Instruments & Methods, 286, in progress
- Keck (2001) Keck, J. W. 2001, PhD thesis, Columbia University
- Kuznetsov et al. (1999) Kuznetsov, S. I., Gilfanov, M. R., Churazov, E. M., Sunyaev, R. A., D’Yachkov, A. V., Khavenson, N. G., Novikov, B. S., Kremnev, R. S., Goldoni, P., Goldwurm, A., Laurent, P., Paul, J., Roques, J. ., Jourdain, E., Bouchet, L., & Vedrenne, G. 1999, Astronomy Letters, 25, 351
- Liang (1998) Liang, E. P. 1998, Phys. Rep., 302, 67
- Liang & Price (1977) Liang, E. P. T. & Price, R. H. 1977, ApJ, 218, 247
- Lin et al. (2000a) Lin, D., Smith, I. A., Böttcher, M., & Liang, E. P. 2000a, Astrophysical Journal, 531, 963
- Lin et al. (2000b) Lin, D., Smith, I. A., Liang, E. P., Bridgman, T., Smith, D. M., Martí, J., Durouchoux, P., Mirabel, I. F., & Rodríguez, L. F. 2000b, Astrophysical Journal, 532, 548
- Maccarone & Coppi (2001) Maccarone, T. J. & Coppi, P. S. 2001, Astrophysical Journal Letters, in submitted
- Main et al. (1999) Main, D. S., Smith, D. M., Heindl, W. A., Swank, J., Leventhal, M., Mirabel, I. F., & Rodríguez, L. F. 1999, Astrophysical Journal, 525, 901
- Maisack et al. (1993) Maisack, M., Kendziorra, E., Kretschmar, P., Kunz, M., Staubert, R., Döbereiner, S., Pietsch, W., Reppin, C., Efremov, V., Kaniovsky, S., & Sunyaev, R. 1993, in The Second Compton Symposium: AIP Conference Proceedings, ed. Fichtel, C. and Gehrels, N. and Norris, J.P., Vol. 304, 451–455
- Mandrou (1990) Mandrou, P. 1990, IAU Circular, 5032, 1+
- Martí et al. (1998) Martí, J., Mereghetti, S., Chaty, S., Mirabel, I. F., Goldoni, P., & Rodríguez, L. F. 1998, Astronomy & Astrophysics, 338, L95
- Méndez & van der Klis (1997) Méndez, M. & van der Klis, M. 1997, ApJ, 479, 926+
- Mereghetti et al. (1994) Mereghetti, S., Belloni, T., & Goldwurm, A. 1994, Astrophysical Journal, 433, L21
- Mereghetti et al. (1997) Mereghetti, S., Cremonesi, D. I., Haardt, F., Murakami, T., Belloni, T., & Goldwurm, A. 1997, Astrophysical Journal, 476, 829+
- Mirabel et al. (1992a) Mirabel, I., Rodríguez, L. F., Cordier, B., Paul, J., & Lebrun, F. 1992a, IAU Circular, 5477, 1+
- Mirabel et al. (1992b) Mirabel, I. F., Cordier, B., Paul, J., Lebrun, F., & Duc, P. A. 1992b, IAU Circular, 5655, 1+
- Mirabel & Rodríguez (1993) Mirabel, I. F. & Rodríguez, L. F. 1993, in The Second Compton Symposium: AIP Conference Proceedings, ed. Fichtel, C. and Gehrels, N. and Norris, J.P., Vol. 304, 413–420
- Mirabel et al. (1993) Mirabel, I. F., Rodríguez, L. F., Cordier, B., Paul, J., & Lebrun, F. 1993, Astronomy & Astrophysics Supplement Series, 97, 193
- Narayan et al. (1997) Narayan, R., Garcia, M. R., & McClintock, J. E. 1997, ApJ, 478, L79
- Narayan & Yi (1995) Narayan, R. & Yi, I. 1995, ApJ, 452, 710+
- Predehl & Schmitt (1995) Predehl, P. & Schmitt, J. H. M. M. 1995, A&A, 293, 889
- Rodríguez et al. (1992) Rodríguez, L. F., Mirabel, I. F., & Martí, J. 1992, Astrophysical Journal, 401, L15
- Shapiro et al. (1976) Shapiro, S. L., Lightman, A. P., & Eardley, D. M. 1976, ApJ, 204, 187
- Skinner (1990) Skinner, G. 1990, in Gamma-ray Line Astrophysics: AIP Conference Proceedings, ed. P. Durouchoux & N. Prantzos, Vol. 232, 358–360
- Smith et al. (1999) Smith, D. M., Heindl, W. A., & Swank, J. H. 1999, IAU Circular, 7266, 2+
- Sunyaev et al. (1990) Sunyaev, R., Churazov, E., Gilfanov, M., Pavlinsky, M., Grebenev, S., Dekhanov, I., Kuznetsov, A., Yamburenko, N., Ballet, J., Laurent, P., Paul, J., Salotti, L., Natalucci, L., Niel, M., Roques, J., & Mandrou, P. 1990, in Gamma-ray Line Astrophysics: AIP Conference Proceedings, ed. P. Durouchoux & N. Prantzos, Vol. 232, 29–41
- Tanaka & Lewin (1995) Tanaka, Y. & Lewin, W. H. G. 1995, in X-Ray Binaries, ed. W. H. G. Lewin, J. van Paradijs, & E. P. J. van den Heuvel (Cambridge University Press), 126–164
- Titarchuk (1994) Titarchuk, L. 1994, ApJ, 434, 570
- Valinia & Marshall (1998) Valinia, A. & Marshall, F. E. 1998, ApJ, 505, 134
- Wilcox & Lent (1989) Wilcox, T.P., J. & Lent, E. 1989, COG - A Particle Transport Code Designed to Solve the Boltzmann Equation for Deep-Penetration (Shielding) Problems. Vol. 1: User Manual, Tech. Rep. M-221-1, Lawrence Livermore National Laboratory
- Zhang et al. (1997a) Zhang, S. N., Cui, W., Harmon, B. A., Paciesas, W. S., Remillard, R. E., & van Paradijs, J. 1997a, ApJ, 477, L95
- Zhang et al. (1997b) Zhang, S. N., Mirabel, I. F., Harmon, B. A., Kroeger, R. A., Rodríguez, L. F., Hjellming, R. M., & Rupen, M. P. 1997b, in Proceedings of the Fourth Compton Symposium, ed. C. D. Dermer, M. S. Strickman, & J. D. Kurfess (American Institute of Physics), 141–162
- Życki et al. (1997) Życki, P. T., Done, C., & Smith, D. A. 1997, ApJ, 488, L113
| instrument | band (keV) | citation |
|---|---|---|
| GRANAT/SIGMA | 30–1300 | see text, cf. Kuznetsov et al. (1999) |
| ROSAT/PSPC | 0.1–2.5 | this work |
| ROSAT/HRI | 0.1–2.5 | this work |
| CGRO/BATSE | 20–1000 | this work |
| RXTE/PCA (PLI) | 2–60 | Main et al. (1999), fig. 2 |
| RXTE/ASM (flux) | 1.5–12 | this work |
| Mir-Kvant/TTM | 1–20 | see text, cf. Aleksandrovich et al. (1998) |
| GRATIS | 20–200 | this work |
| mo. year | dayaareferenced to 1 Jan 1990 = JD 2447892.5 | instrument | band (keV) | citation |
|---|---|---|---|---|
| Aug 1985 | -1599 | SL2/XRT | 2.5–25 | Skinner (1990) |
| Sep 1985 | -1562 | EXOSAT/ME | 1.5–50 | this work |
| May 1989 | -228 | POKER | 15–180 | Bazzano et al. (1993) |
| Apr 1990 | 106 | GRANAT/ART-P | 4–60 | Sunyaev et al. (1990) |
| Jul 1991 | 564 | CGRO/OSSE | 50– | Jung et al. (1993) |
| Oct 1992 | 1021 | Mir-Kvant/HEXE | 20–200 | Maisack et al. (1993) |
| Mar 1995 | 1914 | ASCA/SIS | 0.4–10 | Mereghetti et al. (1997) |
| Aug 1996 | 2419 | RXTE/PCA-HEXTE | 2.5–250 | Heindl & Smith (1998) |
| Apr 1997 | 2657 | BeppoSAX/LECS | 0.1–10 | this work |
| Apr 1997 | 2657 | BeppoSAX/MECS | 1.3–10 | this work |
| Apr 1997 | 2657 | BeppoSAX/PDS | 15–300 | this work |
| Aug 1997 | 2784 | HEXTE&OSSE | 20–700 | Lin et al. (2000b), HEASARC archive |


| ergs cm-2 s-1 | |||
|---|---|---|---|
| Observation Date | Originalaafrom Mereghetti et al. (1994) | Our Re-analysis | Instrument |
| 1990 Sep 10–12 | 1.4 | PSPC (survey) | |
| 1992 Mar 13 | 0.76 | HRI | |
| 1993 Mar 31–Apr 2 | 2.8 | PSPC | |
| date | BB temp. | BB norm | modelaa“CompST” abbreviates the Sunyaev-Titarchuk Comptonization model, as implemented in XSPEC. | w/o BB | instrument | notes | |
|---|---|---|---|---|---|---|---|
| Sep 1985 | BB+PL | 1.095 (32) | 1.037 (34) | EXOSAT/ME | |||
| Sep 1985 | BB+PL | 1.048 (32) | 1.037 (34) | EXOSAT/ME | |||
| Sep 1985 | BB+CompST | 0.993 (57) | 0.985 (38) | EXOSAT/ME | |||
| Mar 1993 | BB+PL | 0.998 (13) | 0.879 (15) | ROSAT/PSPC | |||
| Mar 1993 | BB+CompST | 1.091 (12) | 0.947 (14) | ROSAT/PSPC | |||
| Mar 1995 | BB+PL | 0.971 (280) | 1.051 (282) | ASCA/SIS | |||
| Mar 1995 | BB+CompST | 0.974 (279) | 1.029 (281) | ASCA/SIS | |||
| Apr 1997 | BB+PL | 1.321 (78) | 1.335 (80) | BeppoSAX/LECS | |||
| Apr 1997 | BB+CompST | 1.341 (77) | 1.357 (79) | BeppoSAX/LECS |