A multi–Lorentzian timing study of the atoll sources 4U 0614+09 and 4U 1728–34
Abstract
We present the results of a multi–Lorentzian fit to the power spectra of two kilohertz QPO sources; 4U 0614+09 and 4U 1728–34. This work was triggered by recent results of a similar fit to the black–hole candidates (BHCs) GX 339–4 and Cyg X–1 by Nowak in 2000. We find that one to six Lorentzians are needed to fit the power spectra of our two sources. The use of exactly the same fit function reveals that the timing behaviour of 4U 0614+09 and 4U 1728–34 is almost identical at luminosities which are about a factor 5 different. As the characteristic frequency of the Lorentzians we use the frequency, , at which each component contributes most of its variance per log frequency as proposed by Belloni, Psaltis & van der Klis in 2001. When using instead of the centroid frequency of the Lorentzian, the recently discovered hectohertz Lorentzian is practically constant in frequency. We use our results to test the suggestions by, respectively, Psaltis Belloni and van der Klis in 1999 and Nowak in 2000 that the two Lorentzians describing the high–frequency end of the broad-band noise in BHCs in the low state can be identified with the kilohertz QPOs in the neutron star low mass X–ray binaries. The prediction for the neutron star sources is that if the two kilohertz QPOs are present, then these two high–frequency Lorentzians should be absent from the broad–band noise. We find, that when the two kilohertz QPOs are clearly present, the low–frequency part of the power spectrum is too complicated to draw immediate conclusions from the nature of the components detected in any one power spectrum. However, the relations we observe between the characteristic frequencies of the kilohertz QPOs and the band–limited noise, when compared to the corresponding relations in BHCs, hint towards the identification of the second–highest frequency Lorentzian in the BHCs with the lower kilohertz QPO. They do not confirm the identification of the highest–frequency Lorentzian with the upper kilohertz QPO.
1 Introduction
Low mass X-ray binaries (LMXBs) can be divided into black–hole candidates (BHCs) and neutron–star LMXBs. The accretion process in these LMXBs can be studied through the timing properties of the associated X-ray emission (see for an overview van der Klis 2000). The Fourier power spectra of the neutron–star LMXBs contain several timing features; a power–law red noise component in the lowest frequency range of the spectrum ( 1 Hz) called very low frequency noise (VLFN), a band–limited noise component (BLN) which is in most cases flat at low frequency and steepens to an approximate power–law with an index of about 1 at higher frequency and several quasi–periodic oscillations (QPOs) at low ( Hz) and high frequencies. The high frequency QPOs, at frequencies from a few hundred Hz to more than 1000 Hz are called kilohertz QPOs. The correlation between the timing features at low frequency and the spectral properties led to a precise classification of the neutron star systems as Z or atoll sources (Hasinger & van der Klis 1989). Note, that the component that we call BLN has been previously called “high–frequency noise” in atoll sources; this is presumably the same phenomenon that is called “low–frequency noise” in Z sources (cf. van der Klis 1995). The timing features of the BHCs include among others a band–limited noise component, a bump between 1 and 10 Hz and several QPOs. For the low–frequency ( Hz) part of the power spectrum links between BHCs in the low state and neutron–star LMXBs were suggested (e.g., van der Klis 1994a,b), in particular concerning the band–limited noise and some of the QPOs.
The improved sensitivity and the discovery of several new timing features with the Rossi X–ray Timing Explorer (RXTE) has opened up new possibilities for connecting the timing properties of the neutron–star LMXBs and the BHCs. In the atoll source 4U 0614+09 van Straaten et al. (2000, hereafter vS00) found that the relation between power density and break frequency of the band–limited noise was similar to that established for BHCs in the low state. Wijnands & van der Klis (1999, hereafter WK99) showed that the break frequency of the band–limited noise and the centroid frequency of a low–frequency QPO follow the same correlation for both the neutron–star LMXBs and the BHCs. Psaltis, Belloni & van der Klis (1999, hereafter PBK99) made a systematic study of QPOs and broad–band noise components of the neutron–star LMXBs and the BHCs. They suggested the identification of two features by plotting their frequencies versus each other. The BHCs’ high–frequency bump between 1 and 10 Hz was tentatively identified with the lower kilohertz QPO in the Z and atoll sources and the BHCs’ low–frequency QPO with the horizontal branch oscillations/low–frequency QPO in the Z/atoll sources.
Recently, Nowak (2000) described the power spectra of the BHCs GX 339–4 and Cyg X–1 with a fit function consisting of four Lorentzian components and suggested the identification of the two highest frequency Lorentzians, which together describe the high–frequency end of the broad–band noise, with the two kilohertz QPOs. The Lorentzian that is used to fit the low–frequency end of the broad–band noise has a centroid frequency fixed to zero. The additional Lorentzian fits a bump at low frequencies. In the picture of Nowak (2000) for the BHCs the first Lorentzian corresponds to the broken power law of WK99, the second Lorentzian to the low–frequency QPO of WK99 and PBK99 and the third Lorentzian to the high–frequency bump between 1 and 10 Hz of PBK99. This work forms the original motivation for the current paper. Also triggered by Nowak (2000), Belloni, Psaltis & van der Klis (2001, hereafter BPK01) describe a paradigm for fitting the power spectra of low–luminosity bursters and BHCs in their low/hard state. They describe the power spectra of these sources with a fit function consisting of four Lorentzian components of which in practice three are zero–centered. The suggestion of Nowak (2000) might be tested by comparing his black hole results with neutron star sources, where both kilohertz QPOs can be clearly identified and strong broad–band noise is simultaneously present: the prediction for the neutron star sources is that if the two kilohertz QPOs are present the two high–frequency Lorentzians should be absent from the broad–band noise. In this work we test the multi–Lorentzian fit function of Nowak (2000) and BPK01 on two of the atoll sources, namely 4U 1728–34 and 4U 0614+09. The timing properties at low and high frequencies of 4U 1728–34 and 4U 0614+09 have previously been studied in connection with color diagrams by vS00 for 4U 0614+09 and Di Salvo et al. (2001, hereafter DS01). For both sources strong correlations were found between the frequencies of several components and the position of the source in the color diagram.
We find that instead of four Lorentzians one to six Lorentzians are needed to fit the power spectra of 4U 1728–34 and 4U 0614+09. We describe these different Lorentzian components in §3. In §4 we compare our results with those of Nowak (2000) and BPK01.
2 Observations and Data Analysis
In this work we analyse data from RXTE’s proportional–counter array (PCA; for instrument information see Zhang et al. 1993) of the neutron–star LMXBs 4U 1728–34 and 4U 0614+09. For 4U 1728–34 we used the Fourier power spectra 1 to 19 obtained by and described in DS01. The power spectra were constructed by dividing the PCA light curve into segments of 256 s and then binning the data in time before Fourier transforming such that the Nyquist frequency is always 2048 Hz; the normalization of Leahy et al. (1983) was used. Power spectra were combined based on the position in the color diagram, which is thought to be an indicator of mass accretion rate. The resulting power spectra were then converted to squared fractional rms. The Poisson noise estimated between 1200 and 2048 Hz (where neither noise nor QPOs are known to be present) was subtracted before fitting the power spectra.
For 4U 0614+09 we use a large data set previously studied by vS00 plus recent observations performed between 2000 September 1 and 4 and 2001 May 24 and 28. In the September 2000 observations the source was at levels corresponding to the lowest mass accretion rate (as inferred from colors and power–spectral properties) observed by vS00. In the May 2001 observations the inferred mass accretion rate was at an even lower level. Starting May 12, 2000, the propane layer on PCU0, which functions as an anti–coincidence shield for charged particles, was lost. This leads to a contamination of the data from electrons trapped in the Earth’s magnetosphere or from solar flare activity. For the September 2000 and May 2001 observations we therefore exclude all data with ELECTRON2 0.09, where ELECTRON2 is the measured coincidence of events between the PCU propane layer and either of the two anodes in the first layer of PCU2, the only detector that was switched on in all the observations. The ELECTRON2 screening led to a loss of about 12% of the data. The loss of the propane layer in PCU0 also leads to an increased background rate for PCU0. We approximately take this into account by adding 30% of the PCU0 background rate to the total background rate. For the colors used above we have excluded PCU0.
In vS00 the 4U 0614+09 data were split into near–continuous time intervals of approximately 2500 s which were called observations. For the present work, to improve statistics, we constructed representative intervals by adding up several observations that showed very similar power spectra in vS00. As all characteristic frequencies in the power spectra are correlated with each other and with the position of the source in the hardness–intensity diagram (parametrized in vS00 by a variable ) we can select the data on one of these frequencies. The only power spectral feature that is present in all observations is the high–frequency noise. However, at a (the break frequency of the band–limited noise, see for a definition vS00) of about 25 Hz and higher the correlation with the other frequencies and with the position in hardness–intensity diagram breaks down (see figures 3 and 6 in vS00). Therefore, for a well below 25 Hz we used to select the data and for a of about 25 Hz and higher we used the centroid frequencies of the kilohertz QPOs. To represent the highest mass accretion rate in 4U 0614+09 (where the kilohertz QPOs are mostly absent) we add up the two observations at = 2.59 and = 2.64 in vS00. As in the case of 4U 1728–34, we number the intervals (1–9) in order of an increasing inferred mass accretion rate. We note that we could have selected the data based on value as was done for 4U 1728–34 (see above), but because of the scatter in the correlation of with the frequencies of the power spectral features (see figures 3 and 4 in vS00), in 4U 0614+09 this leads to an artificial broadening of the power spectral features and in the case of the kilohertz QPOs sometimes even to double peaks.
For each interval of 4U 0614+09 we constructed a power spectrum in the same fashion as for 4U 1728–34 (see above), but with a Nyquist frequency of 4096 Hz. An interval contains between 53 and 382 power spectra. We subtracted the Poisson noise estimated between 2000 and 4000 Hz (as, different from 4U 1728–34, QPOs are known to be present between 1200 and 1400 Hz) before fitting the power spectra.
We fitted the power spectra with a sum of Lorentzian components. One to six Lorentzian components were needed for a good fit. We only include those Lorentzians in the fit whose significance based on the error in the power integrated from 0 to is above 3.0 . In addition to the Lorentzians a power–law component is used to fit the so called very low–frequency noise (VLFN). For the intervals where the kilohertz QPOs have sufficiently high frequencies not to interfere with the low–frequency features and vice versa, we fit the kilohertz QPOs between 500 and 2048 Hz and then fix the kilohertz QPO parameters when we fit the whole power spectra, similar to what was done in DS01. This is for computational reasons only; the results are the same as those obtained with all parameters free.
We plot the power spectra and the fit functions in the power times frequency representation (e.g. Belloni et al. 1997, Nowak 2000), where the power spectral density is multiplied with its Fourier frequency. For a fit function consisting of many Lorentzians this representation helps to visualize a characteristic frequency corresponding to each Lorentzian component (BPK01) namely, the frequency where each component contributes most of its variance per logarithmic frequency interval. This characteristic frequency, is not equal to the centroid frequency, , of the Lorentzian but to , where is the HWHM of the Lorentzian. In this work we therefore use as characteristic frequency for broad features. For narrow features the characteristic frequency is nearly the same as . All power spectral features that we find in 4U 0614+09 and 4U 1728–34 become broader towards lower interval number (see §3). Several features can be classified as QPOs at higher characteristic frequencies but evolve into broad bumps as their frequencies become lower. Therefore, to be consistent we use for all features. The actual Lorentzian functions fitted were of the form:
where , and (the fractional rms integrated from 0 to ), (the quality factor, defined as ) and were the independent fit parameters.
3 Results
The two sources 4U 1728–34 and 4U 0614+09 yielded remarkably similar results. One to six Lorentzian components were needed for a good fit. In addition to these Lorentzians, intervals 14–19 of 4U 1728–34 and 8 and 9 of 4U 0614+09 needed a power–law component to fit the very low–frequency noise (VLFN). We show power spectra and fit functions in Figure 1 for 4U 1728–34 and in Figure 2 for 4U 0614+09. The values of for all Lorentzian components are listed in Table 1, the values of are listed in Table 2 and the values of the integrated fractional rms (over the full PCA energy band) are listed in Table 3. The quoted errors in , and use = 1.0.
If we compare the /dof values of our fits with the /dof values of a broken power–law fit (for a description see DS01) to the same intervals there seems to be a clear statistical preference for the multi–Lorentzian function. For rather similar numbers of degrees of freedom (between 131 and 145, and usually higher in the multi–Lorentzian than in the broken power–law fit) the values of the multi–Lorentzian fits are more than 10 lower than of the broken power–law fits in 15 out of 28 cases, whereas the inverse is true in only 4 of the 28 cases. The fits are generally better for 4U 0614+09 (all with a /dof below 1.9) than for 4U 1728–34 (/dof below 4.1); this could be due to the different methods used to select the data (see §2).
Allmost all fitted power–spectral features (described below) were already identified in DS01 and vS00. In DS01 and vS00 the BLN component is described with a broken power law, whereas we use a zero-centered Lorentzian. As in DS01 and vS00 we use Lorentzians to describe two low–frequency QPOs (when present), a broad high–frequency feature ( Hz) and the two kilohertz QPOs. We do not describe the behaviour of the VLFN component in this work; for a discussion of this component in 4U 1728–34 and 4U 0614+09 see respectively DS01 and vS00. In the current work, it only affects the power spectra below 0.1–1 Hz.
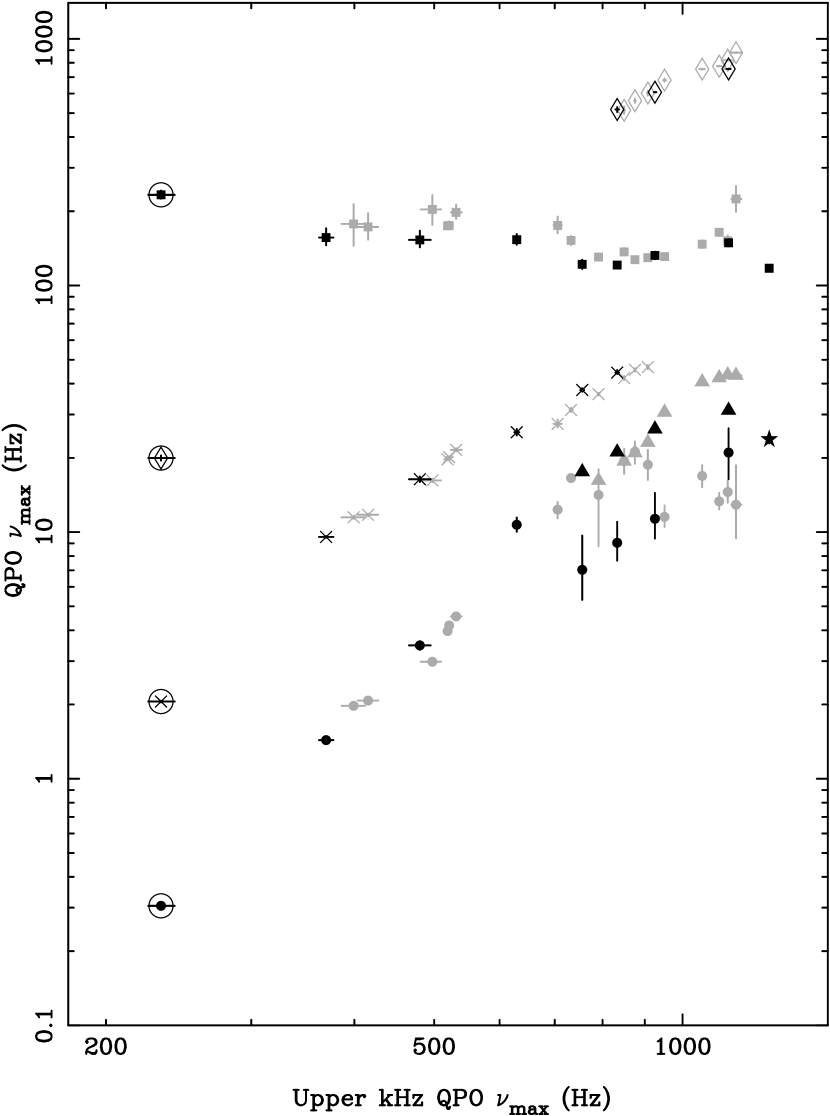
To confirm the identification of the components, we have plotted the of the Lorentzians versus the of the Lorentzian identified as the upper kilohertz QPO () in Figure 3. Intervals 18 and 19 of 4U 1728–34 are not included in this plot as these intervals only showed one Lorentzian. The grey symbols mark the 4U 1728–34 points, the black symbols the 4U 0614+09 points. In Figure 3 five correlations are present, of which the top three can be unambiguously identified with the Lorentzians described in §3.2–3.4. For the other two correlations the identification is more complicated; see §3.1. The points from interval 1 of 4U 0614+09 (from recent observations in May 2001) are circled. The Lorentzian at 233 Hz of this interval can be identified based on frequency, value or fractional rms as either the upper kilohertz QPO or the hectohertz Lorentzian. In Tables 1, 2 and 3 we list this Lorentzian as the upper kilohertz QPO. In Figure 3 and in all further figures we will use the parameters of this Lorentzian both for the upper kilohertz QPO and for the hectohertz Lorentzian. These points will be circled.
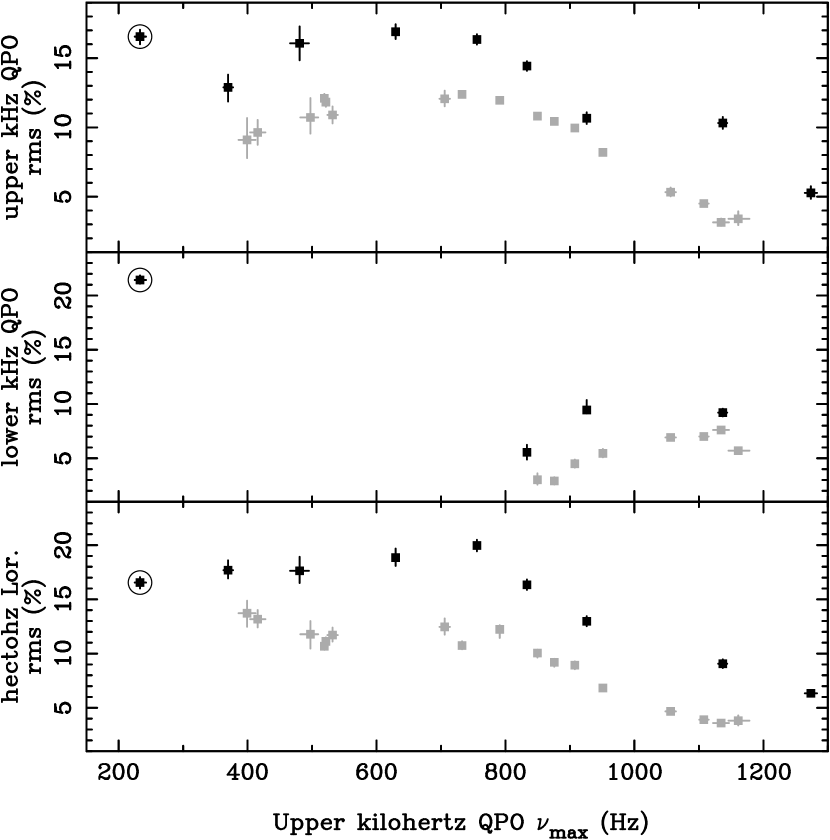
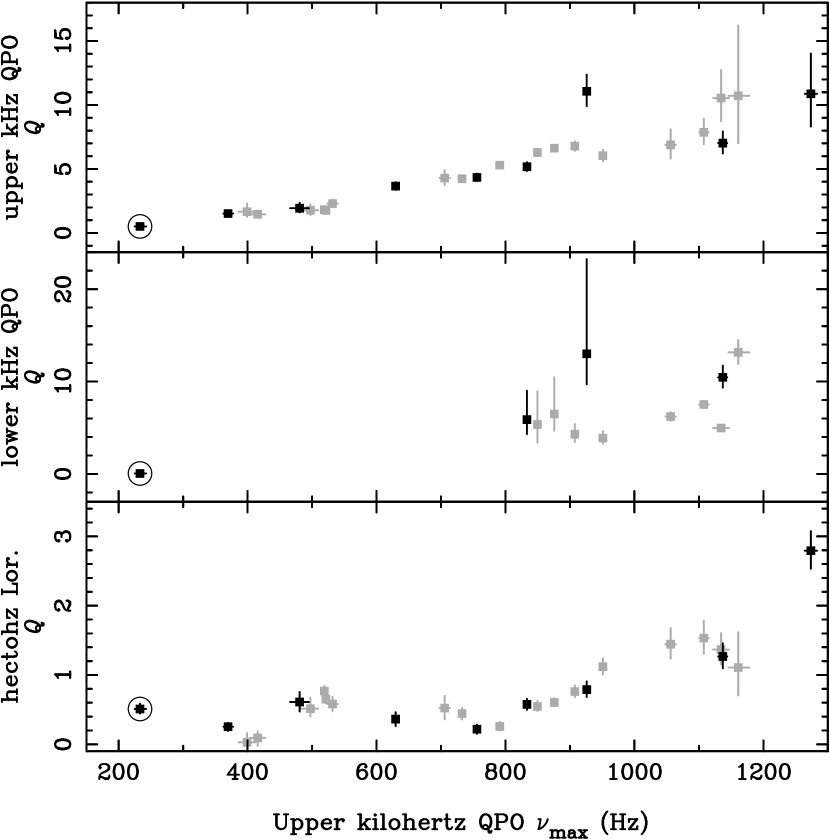
The two sources show a remarkable similarity in their behaviour. This similarity is also shown in the behaviour of the values (Table 2) and the fractional rms’s of the different components (Table 3), although the fractional rms in 4U 0614+09 is generally higher by about a factor of 1.3 to 2 than that in 4U 1728–34. Note that the hydrogen column density, , is about a factor 10 higher for 4U 1728–34 (e.g. Schultz 1999). This leads to the absorbtion of more low–energy photons for 4U 1728–34 than for 4U 0614+09 and could increase the factor as most power spectral features are stronger at higher energies. In Figures 4 and 5 we plot the fractional rms and the value of the hectohertz Lorentzian, the lower and upper kilohertz QPOs (see below for a description of these components) versus .
3.1 The band–limited noise
The zero–centered Lorentzian which is used to fit the band–limited noise (BLN), is present in most of the intervals (except interval 9 of 4U 0614+09). As noted in §1, previously the BLN in the atoll sources was referred to as HFN (high frequency noise) in the literature, but as it has the lowest characteristic frequency of all components that name seems no longer appropriate. The characteristic frequency of this component (), increases with interval number. This increase is halted at interval 13 for 4U 1728–34 and interval 5 for 4U 0614+09. Here an additional, non zero–centered Lorentzian component had to be included in the fit to the BLN. As previously noted by DS01, the characteristic frequency of this new component, , continues to follow the relations between the and the characteristic frequencies of the other components (see Fig. 3) as well as the relation with interval number. We shall refer to this Lorentzian as the very low–frequency Lorentzian. The very low–frequency Lorentzian is generally broader at lower frequencies (see Tables 1 and 2) except for interval 18 and 19 of 4U 1728–34 and 9 of 4U 0614+09 for which the identification as very low–frequency Lorentzian is ambiguous (see below). Note that in the broken power law description, the very low–frequency Lorentzian is usually not statistically required in 4U 0614+09, whereas it is in 4U 1728–34 (DS01).
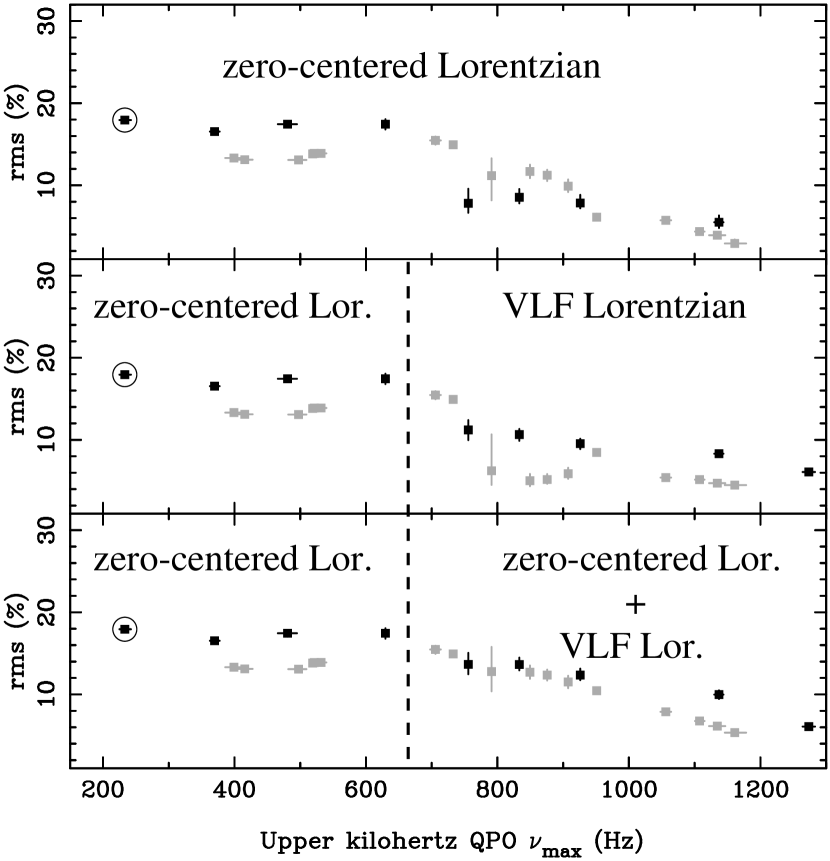
In Figure 6 we plot the fractional rms of the BLN versus . In the top panel we plot the fractional rms of the zero–centered Lorentzian. In the middle panel we plot the fractional rms of the very low–frequency Lorentzian when it is present, and the fractional rms of the zero–centered Lorentzian when it is not. In the bottom panel finally we plot the fractional rms of the zero–centered Lorentzian and the very low–frequency Lorentzian summed together. In the top two panels the relation tends to jump when the very low–frequency Lorentzian appears, where this jump does not occur in the bottom plot. The relation is also smoother in the bottom plot. This behaviour together with the frequency behaviour of the zero–centered Lorentzian and the very low–frequency Lorentzian described above could hint at the zero–centered Lorentzian and the very low–frequency Lorentzian being two components that together fit one feature. It could however also be that the very low–frequency Lorentzian is present in the intervals where we do not detect it and biases our fractional rms and measurements for the zero–centered Lorentzian. This would then explain the fractional rms and connections between the zero–centered Lorentzian and the very low–frequency Lorentzian.
We also investigated the possibility that the very low–frequency Lorentzian is a sub–harmonic of the low–frequency Lorentzian. We found that in the deviations from a harmonic relation are 0.5–4.4 . However, note that in the representation a harmonic relation has no real physical meaning. In the representation, where a harmonic relation has physical meaning, the deviations from a harmonic relation between the very low–frequency Lorentzian and the low–frequency Lorentzian are 1.9–6.5 . When we require an harmonic relation between the centroid frequencies of the very low–frequency Lorentzian and the low–frequency Lorentzian in the fits to the power spectra where both features are simultaneously present (5 and 6 for 4U 0614+09 and 9–12 for 4U 1728–34) we find that this significantly worsens the fits (F–test probabilities from 0.05 to ). Note that for intervals 1, 2, 4, 5 and 6 of 4U 1728–34 there appears to be some residual power near the frequency where the sub–harmonic of the low–frequency QPO should be.
In intervals 18 and 19 of 4U 1728–34 and 9 of 4U 0614+09 there is only one Lorentzian present. Based on the relations of characteristic frequency, and rms fractional amplitude with interval number, this Lorentzian can be identified as either the zero–centered Lorentzian or the very low–frequency Lorentzian. As fitting this Lorentzian with a zero–centered Lorentzian provides bad fits, we have listed it as the very low–frequency Lorentzian in Tables 1 and 2, but this identification is uncertain. Contrary to all other components, the characteristic frequency of this component decreases with interval number (see Tables 1 and 2).
3.2 The low–frequency Lorentzian
The second Lorentzian at low frequencies (which we shall refer to as the low–frequency Lorentzian) was present in intervals 1–12 for 4U 1728–34 and 1–6 for 4U 0614+09 (see Figures 1 and 2). The characteristic frequency of this component, , also increases with interval number (see Table 1). In 4U 1728–34 ranges from 11.5–46.7 Hz, in 4U 0614+09 from 2.0–44.6 Hz. The low–frequency Lorentzian is too broad to be classified as a QPO () at low frequencies ( 25 Hz; see Tables 1 and 2) and only exceeds 2 at higher frequencies. Note that the low–frequency Lorentzian might be present in interval 6 of 4U 0614+09 ( = 60.5 Hz); as the significance based on the error in the integrated power is only 2.4 we have not included this Lorentzian in the fit.
3.3 The hectohertz Lorentzian
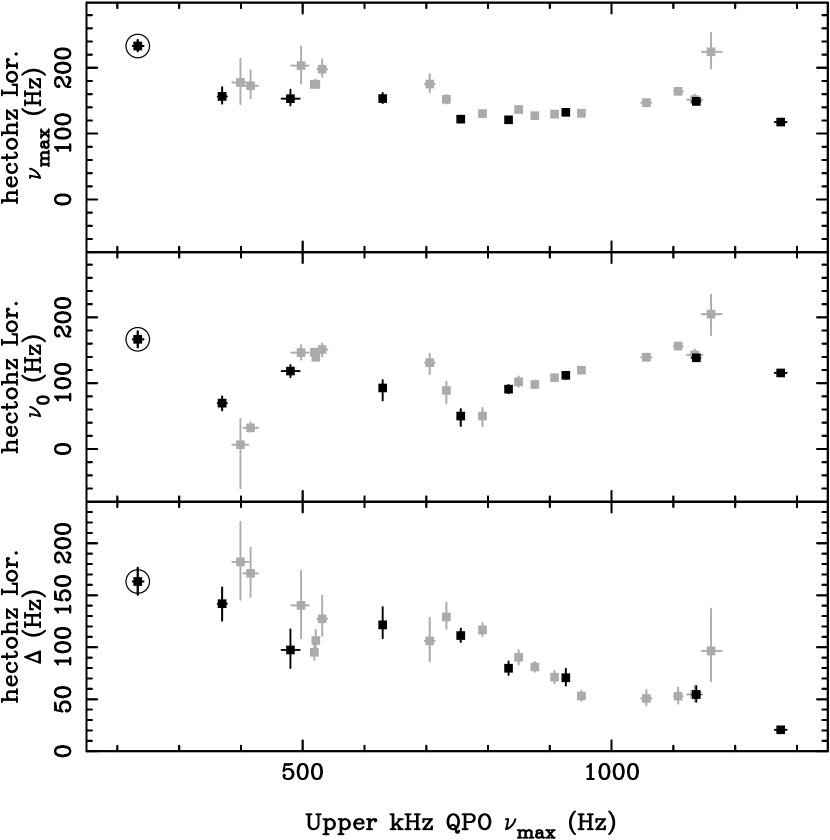
The fourth component, which we shall refer to as the hectohertz Lorentzian, is fitted with a Lorentzian with a characteristic frequency of the order of 100 Hz. The hectohertz Lorentzian is only absent in intervals 18 and 19 of 4U 1728–34, at the highest inferred mass accretion rate. The Lorentzian at 233 Hz in interval 1 of 4U 0614+09, at the lowest inferred mass accretion rate, can be identified as either the hectohertz Lorentzian or the upper kilohertz QPO. The hectohertz Lorentzian is broad at low interval numbers and becomes narrower at high interval numbers (see Table 2). This is a good example of how the characteristic frequency of a Lorentzian is determined by and . In Figure 7 we plot , and versus the centroid frequency of the upper kilohertz QPO. As increases, falls such that is nearly constant.
3.4 The kilohertz QPOs
The fifth and sixth Lorentzians were used to fit the pair of kilohertz QPOs. This pair is present in intervals 10–17 for 4U 1728–34 and 6–8 for 4U 0614+09. In interval 1 of 4U 0614+09 there is a Lorentzian present at Hz. Based on its frequency this Lorentzian can be tentatively identified with the relation which PBK99 associate with the lower kilohertz QPO. However, this Lorentzian is much broader and stronger than any of the “normal” lower kilohertz QPOs in 4U 0614+09 and 4U 1728–34 (see Figures 4 and 5); its broad shape is similar to the corresponding feature seen at similar frequencies in the low–luminosity bursters (BPK01). In the other intervals (except 18 and 19 for 4U 1728–34) there is only one kilohertz QPO present, which can be identified as the upper kilohertz QPO based on the correlations of its frequency with the frequency of the other features (see Fig. 3) or interval number (see DS01). The Lorentzian at 233 Hz in interval 1 of 4U 0614+09 can be identified as either the hectohertz Lorentzian or the upper kilohertz QPO. Both kilohertz QPOs are broader at lower frequencies (see Tables 1 and 2). At frequencies below Hz the upper kilohertz QPO becomes too broad to be classified as a real QPO ().
4 Comparison with other sources
A way to compare the results of our multi–Lorentzian fit to the two atoll sources with previous fits of this function to other neutron–star LMXBs and BHCs (Shirey 1998, Nowak 2000, BPK01) is to plot the characteristic frequencies of the different Lorentzians components versus the frequency of one Lorentzian component which has already been identified for all these sources. There are three obvious candidates to plot everything against that have already been identified by WK99 and PBK99 (see the introduction): the band–limited noise component, the low–frequency Lorentzian and the lower kilohertz QPO. Here we choose to present the results of comparing to the band–limited noise component. If we use the characteristic frequency of the low–frequency Lorentzian instead, our conclusions do not change. If we use the characteristic frequency of the lower kilohertz QPO our points fall on the relations shown in BPK01; any differences between our conclusions and those of BPK01 are discussed below.
The large advantage of using the band–limited noise component is that in our data this component is present in all spectra, whereas the lower kilohertz QPO is only present in 11 (perhaps 12, see §3.4) and the low–frequency Lorentzian in 18 out of the 28 power spectra. Also in the other sources the band–limited noise component can almost always be clearly identified, where for the other peaks there can be ambiguity about which peak is which (see, e.g., Homan et al. 2001). A disadvantage of using the band–limited noise component is that in both 4U 1728–34 and 4U 0614+09 at a certain point the frequency of the very low–frequency Lorentzian “takes over” from the frequency of the zero–centered Lorentzian (see §3.1). So, just plotting the characteristic frequencies of the different Lorentzian components versus leads to a confusing picture where the correlations break down, i.e. at the intervals where both the zero–centered Lorentzian and the very low–frequency Lorentzian are present. This can be resolved by using as the characteristic frequency of the the band–limited noise if the very low–frequency Lorentzian is present, and otherwise. We call the thus defined characteristic frequency of the band–limited noise . Although the physical connection between the zero–centered Lorentzian and the very low–frequency Lorentzian is uncertain (see §3.1), the smooth run of and with upper kilohertz QPO frequency visible in Fig. 3 indicates that for 4U 0614+09 and 4U 1728–34 could serve as horizontal coordinate to plot everything against as well as . We caution however, that due to the extensive data sets available for our two sources we are able to keep track of through the transformation from zero–centered Lorentzian to very low–frequency Lorentzian. With less data, confusion is likely. The correlation of with the other frequencies breaks down at interval 9 of 4U 0614+09 (cf. §3.1). However, as this is only one very extreme point this is not a real problem for our present purpose. We have excluded intervals 18 and 19 of 4U 1728–34 from the correlations, as for these intervals only one component, the very low–frequency Lorentzian, is present. But note that in these intervals also there is evidence of a break down in the correlations with (§3.1).
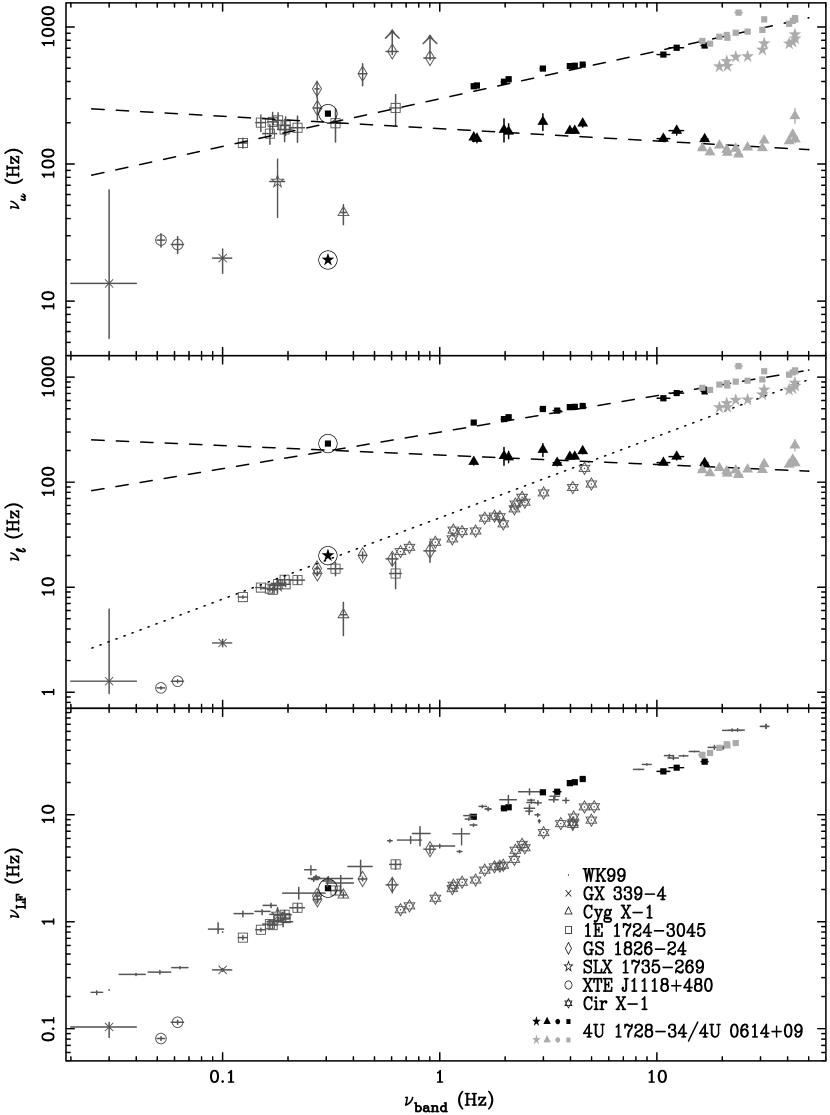
In Figure 8 we compare our results with those of Nowak (2000; the BHCs GX 339–4, Cyg X–1) and BPK01 (the low–luminosity bursters 1E 1724–3045, GS 1826–24, SLX 1735–269 and the BHC XTE J1118+480) by plotting all characteristic frequencies versus . The points for which we use as are black, those for which we use are grey. We have also included the results for Cir X–1 from Shirey (1998) that were also used in PBK99. That author also used a zero–centered Lorentzian to fit the broad–band noise, and fitted two peaked features with Lorentzians. The only difference with Nowak (2000) and BPK01 is that the high–frequency tail in Shirey (1998) was fitted with a power law, whereas Nowak (2000) and BPK01 use an additional Lorentzian. The grey symbols in Fig. 8 represent the results from Shirey (1998), Nowak (2000) and BPK01, the black symbols our results on 4U 1728–34 and 4U 0614+09. For clarity Figure 8 is split up in three panels. In the bottom panel we plot the characteristic frequency of the low–frequency Lorentzian (), versus (the WK99 relation). In this plot we have included the points from WK99 without the 4U 1728–34 and 4U 0614+09 points. However, note that WK99 use a broken power–law instead of a zero–centered Lorentzian to fit the band–limited noise. This will lead to systematic deviations in characteristic frequency (see BPK01). Also note that for both 1E 1724–3045 and GS 1826–24 there are usually two low frequency peaks present (see BPK01); a narrow peak and a broad component at a slightly higher frequency. If both these peaks are present we use the of the broad peak to compare with 4U 1728–34 and 4U 0614+09 based on the strong similarities of the broad peak with the low frequency Lorentzian in these sources (see also Figure 9).
Most of our results on 4U 1728–34 and 4U 0614+09 coincide with the WK99 data. A few points lie slightly below the WK99 relation just as the points of GX 339–4, Cyg X–1 of Nowak (2000) and 1E 1724–3045, GS 1826–24 and SLX 1735–269 of BPK01. This may be due to the systematic frequency deviations between a zero–centered–Lorentzian and a broken power–law (see BPK01). The XTE J1118+480 points of BPK01 and the Cir X–1 points of Shirey (1998) are well below the WK99 relation but may line up with each other. Note that the QPO in Cir X–1 was previously identified as with the PBK99 relation (see PBK99).
In the middle and top panels we plot the characteristic frequencies of the hectohertz Lorentzian and both kilohertz QPOs versus for 4U 1728–34 and 4U 0614+09. We have fitted the correlations of the characteristic frequencies of the hectohertz Lorentzian and the upper kilohertz QPO to with power–laws in order to extrapolate these correlations to lower frequencies (dashed lines in Fig. 8). For the lower kilohertz QPO the range in from these two sources alone is too small to draw strong conclusions from the extrapolation. For these fits we excluded interval 9 of 4U 0614+09 where the correlations between and the frequencies of the other Lorentzians break down (see Fig. 3). We also exclude interval 1 of 4U 0614+09 from the fit (although these points are shown in the Figure) as for this interval the identification of the hectohertz Lorentzian and the lower and upper kilohertz QPO are uncertain (see §3). We use these power–law fits only to get an indication for what the characteristic frequencies for the hectohertz Lorentzian and the upper kilohertz QPO would be expected to be at low frequencies. The difference between the two panels is that in the middle panel we compare with the characteristic frequency of the Lorentzian ( in BPK01) that PBK99 (for the points from Shirey 1998), Nowak (2000) and BPK01 identify with the lower kilohertz QPO and in the top panel with the Lorentzian ( in BPK01) that Nowak (2000) and BPK01 identify with the upper kilohertz QPO. We find that also when plotting versus the relation between and (middle frame) is similar to the relation of the lower kilohertz QPO with . Also the Hz Lorentzian of interval 1 of 4U 0614+09 falls fairly close to the relation between and . However, more work needs to be done to connect both relations.
Concerning the top panel, Nowak (2000) and BPK01 found that the BHC points (GX 339–4, Cyg X–1 and XTE J1118+480) as well as the SLX 1735–269 point followed the extension to low frequencies of the “lower versus upper kilohertz QPO frequency” of PBK99. The points of 1E 1724–3045 and GS 1826–24 were above the relation. We find that the BHC points (GX 339–4, Cyg X–1 and XTE J1118+480) as well as the single point from SLX 1735–269 lie well below the extrapolated relation of with the characteristic frequency of the upper kilohertz QPO; the points might be consistent with the extrapolation of the lower kilohertz QPO relation. We can therefore not identify the highest frequency Lorentzian in these sources with the upper kilohertz QPO based on this relation. Note again that the identification of might be wrong in sources for which only litle data has been analyzed (see above). The points of GS 1826–24 are well above the relation and only the points of 1E 1724–3045 fall in the right range. However, the 1E 1724–3045 points also fall in the right range to be identified with the hectohertz Lorentzian. The same conclusion can be drawn for the 233 Hz Lorentzian of interval 1 of 4U 0614+09.
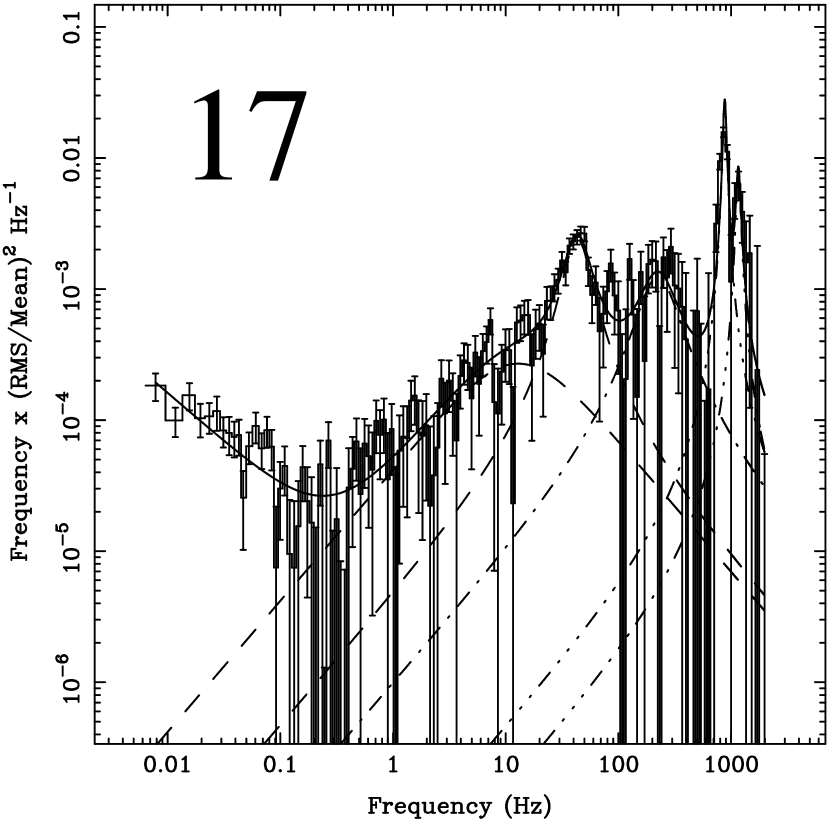
Interval 1 of 4U 0614+09 shows a similar to that of the Cyg X–1 observation from Nowak (2000) and to that of observations of the low luminosity bursters 1E 1724–3045 and GS 1826–24 from BPK01. In Figure 9 we plot the power spectra of 4U 0614+09, 1E 1724–3045 and Cyg X–1 that have a of about 0.3 Hz. For 1E 1724–3045 we use the same data that made up interval E of BPK01 and for Cyg X–1 we use the RXTE observations on 1996 October 22, the same as used by Nowak (2000). We constructed the power spectra in the same fashion as for 4U 1728–34 and 4U 0614+09 (see §2). The power spectra of 4U 0614+09 and 1E 1724–3045 are almost identical at both low and high frequencies. The power spectrum of Cyg X–1 is only similar to those of the neutron stars at low frequencies. The two high frequency peaks are both weaker relative to the low frequency peaks and about a factor of 4 lower in characteristic frequency than those in 4U 0614+09 and 1E 1724–3045. An explanation for this might be that the characteristic frequencies of the high frequency peaks in the spectrum scale with the mass of the central object and that the low frequency peaks are independent of this mass.
5 Discussion
5.1 Comparison between 4U 1728–34 and 4U 0614+09
The use of exactly the same fit function for both 4U 1728–34 and 4U 0614+09 shows the similar timing behaviour of these two atoll sources (see §3). Especially the frequencies and the values are almost identical. This similarity is quite remarkable, as the X–ray luminosity is about a factor 5 larger for 4U 1728–34 (Ford et al. 2000). Note that the luminosities for 4U 1728–34 and 4U 0614+09 in Ford et al. (2000) are based on distance to these sources calculated from type I X–ray bursts. The luminosity is thought to reach the Eddington limit in the so called radius expansion bursts (Lewin, van Paradijs & Taam 1993). For 4U 1728–34 a radius expansion burst was used (Foster et al. 1986) but for 4U 0614+09 no radius expansion bursts have been observed, therefore only an upper limit on the distance was derived by assuming that the flux is less than the Eddington limit (Brandt et al. 1992). So the luminosity in Ford et al. (2000) for 4U 0614+09 is also an upper limit. The fractional rms in 4U 1728–34 is systematically lower than that in 4U 0614+09, which may be related to its higher luminosity. Note that the data are inconsistent with a model in which the kilohertz QPO amplitudes are the same and the higher luminosity of 4U 1728–34 is caused by an additional source of X–rays unrelated to the kilohertz QPOs; then the rms values in 4U 1728–34 would be expected to be a factor of 5 lower, while they are only lower by about a factor of 1.3 to 2. Another stunning difference between 4U 1728–34 and 4U 0614+09 is that in the whole RXTE data set on 4U 0614+09 obtained until now ( ks) no type I X–ray bursts have been observed, whereas 4U 1728–34 is a well known burster that shows type I X–ray bursts in all parts of the color–color diagram (van Straaten et al. 2001, Franco 2001). Note that although no type I X–ray bursts have been observed for 4U 0614+09 with RXTE, two X–ray bursts from this source have been previously detected. One with the OSO–8 satellite (Swank et al. 1978) and one with the GRANAT satellite (Brandt et al. 1992).
5.2 The hectohertz Lorentzian
The hectohertz Lorentzian has been identified in several other neutron star LMXBs (SAX J1808.4-3658, 4U 1705–44; Wijnands & van der Klis 1998). Sunyaev & Revnivtsev (2000) use a sample of 9 BHCs and 9 neutron star LMXBs (including SAX J1808.4-3658, 4U 1705–44, 4U 0614+09 and 4U 1728–34) to show that neutron star systems show significant broad–band noise above several hundred Hz where BHC do not. The hectohertz Lorentzian is one of the contributers to this excess of power in SAX J1808.4-3658, 4U 1705–44, 4U 0614+09 and 4U 1728–34 and could be in the other sampled neutron star LMXBs.
The hectohertz Lorentzians could be related to the Hz QPO in the BHC GRS 1915+105 (Morgan, Remillard & Greiner 1997) and the Hz QPO in the BHC GRO J1655–40 (Remillard et al. 1999). These oscillations also have stable frequencies and fall in the same frequency range as the hectohertz Lorentzians we observe. However, these QPOs are much narrower ( for the Hz QPO and for the Hz QPO) and have much weaker rms fractional amplitudes (1 %). Models to explain these stable QPOs in the BHCs all invoke strong gravity near the central black hole (see for a review Cui, Chen & Zhang 2000).
Recently, Fragile, Mathews & Wilson (2001) made a tentative identification of the 9 Hz QPO in the BHC GRO J1655–40 (Remillard et al. 1999) with the orbital frequency at the Bardeen–Petterson transition radius (e.g. Bardeen & Petterson 1975). Based on the similarities between the hectohertz Lorentzian in the neutron star LMXBs and the 9 Hz QPO in GRO J1655–40 they also suggest this identification for the hectohertz Lorentzian. For 4U 0614+09 and 4U 1728–34 we can confirm that in indeed several properties of the hectohertz Lorentzian are quite similar to those of the 9 Hz QPO in GRO J1655–40. As in the case of the 9 Hz QPO, the hectohertz Lorentzian always has and for both features the characteristic frequency is nearly constant whilst the frequencies of other components change.
5.3 Comparison with BHCs and low–luminosity bursters
As noted in §1, if the two highest frequency QPOs in the BHCs could be identified with the lower and upper kilohertz QPO in the atoll sources (as suggested by respectively PBK99 and Nowak 2000), one would predict that in 4U 1728–34 and 4U 0614+09 the two high–frequency Lorentzians should be absent from the broad–band noise if the two kilohertz QPOs are present. Our results show a more complicated picture; when the two kilohertz QPOs are clearly present, then in addition to the zero–centered Lorentzian and the low–frequency Lorentzian, two more Lorentzian components are present, the very low–frequency Lorentzian and the hectohertz Lorentzian. These Lorentzians however have quite a special character. The characteristic frequency of the very low–frequency Lorentzian is strongly connected with the characteristic frequency of the zero–centered Lorentzian and might be part of the BLN (see §3.1), which is not clear for the two highest–frequency Lorentzians describing the broad–band noise in the BHCs. The hectohertz Lorentzian is almost constant in frequency with a frequency of about 150 Hz. The highest–frequency Lorentzian describing the broad–band noise in the BHCs might also be constant in frequency at about 30 Hz, but there is currently not enough data available for the BHCs to confirm this. The factor of difference in frequency might then be caused by a scaling with the mass of the compact object which is about a factor of 5 lower for the neutron stars.
The power spectra of the low–luminosity bursters and BHCs studied in Nowak (2000) and BPK01 showed four Lorentzian components three of which in practice are zero–centered. The atoll sources 4U 1728–34 and 4U 0614+09 also show four Lorentzian components at low inferred mass accretion rates (intervals 1–8 of 4U 1728–34 and 1–4 of 4U 0614+09). So can we identify all four peaks in these intervals of 4U 1728–34 and 4U 0614+09 with the four peaks in the BHCs and the low–luminosity bursters? The first two Lorentzian components in the low–luminosity bursters, BHCs and the atoll sources 4U 1728–34 and 4U 0614+09 may have the same physical origin as they also show a similar relation between their respective characteristic frequencies (the WK99 relation, see Fig. 8, bottom panel). Interval 1 of 4U 0614+09 is almost identical to that of the low–luminosity bursters. However, because interval 1 of 4U 0614+09 is an extreme point in the current dataset available for 4U 0614+09, its two highest–frequency Lorentzians cannot be linked directly with the two highest frequency Lorentzians of intervals 2–4. More observations of 4U 0614+09 with a between 0.3 and 1.4 Hz are needed to connect these points.
The third Lorentzian of the BHCs and low–luminosity bursters however, behaves completely differently from the third Lorentzian in 4U 1728–34 and 4U 0614+09 (except for interval 1). Where the characteristic frequency of the third Lorentzian in 4U 1728–34 and 4U 0614+09 (i.e. the hectohertz Lorentzian) is almost constant at about 150 Hz, the third Lorentzian in the BHCs and low–luminosity bursters varies over several orders of magnitude (Fig. 8, middle panel). Instead, the PBK99 relation as well as the relation between the characteristic frequency of the third Lorentzian in the BHCs and low–luminosity bursters with suggest the identification of this Lorentzian with the lower kilohertz QPO that is present in intervals 10–17 of 4U 1728–34 and intervals 6–8 of 4U 0614+09. In the middle panel of Fig. 8 we have illustrated this with a dotted line that indicates a power law fit to the characteristic frequencies of the lower kilohertz QPO of 4U 1728–34/4U 0614+09 and the third Lorentzian of the low–luminosity bursters to .
Based on the similarity between the relation between the characteristic frequencies of the third and the fourth Lorentzians in the BHCs GX 339–4 and Cyg X–1 and the relation between the characteristic frequencies of the lower and upper kilohertz QPOs, Nowak (2000) suggested the identification of the fourth Lorentzian with the upper kilohertz QPO. Indeed the upper kilohertz QPO is also the fourth peak in the intervals at lower inferred mass accretion rates, where 4U 1728–34 and 4U 0614+09 mimic the BHCs most. However, the relation between the characteristic frequency of the fourth Lorentzian and does not confirm this identification (see §4). For the low–luminosity bursters 1E 1724–3045 and GS 1826–24 studied in BPK01 the identification of the fourth peak with the upper kilohertz QPO is even harder (see §4). But keep in mind that due to the extensive data sets available for our two sources we are able to keep track of through the transformation from zero–centered Lorentzian to very low–frequency Lorentzian. With less data, confusion might occur.
5.4 Summary
-
•
The use of exactly the same fit function for 4U 0614+09 and 4U 1728–34 shows that these two atoll sources show a remarkably similar timing behaviour at luminosities that differ by a factor of 5.
-
•
Interval 1 of 4U 0614+09 shows a remarkably similar power spectrum to that of the low–luminosity bursters. Unfortunately, this is an extreme point in the current dataset available for 4U 0614+09 and therefore the two highest frequency Lorentzians cannot be linked directly with the high frequency Lorentzians of the other intervals. More observations of 4U 0614+09 with a between 0.3 and 1.4 Hz are needed to complete the picture.
-
•
When the two kilohertz QPOs are clearly present, the low–frequency part of the power spectrum is too complicated to draw immediate conclusions from the nature of the components detected in any one power spectrum. The relation of characteristic frequency of respectively the two high–frequency Lorentzians with the characteristic frequency of the band–limited noise () hints towards the identification of the second–highest frequency Lorentzian in the BHCs with the lower kilohertz QPO (as suggested by PBK99) but can not confirm the identification of the highest frequency Lorentzian with the upper kilohertz QPO (as suggested by Nowak 2000).
-
•
When using instead of the centroid frequency, the recently discovered hectohertz Lorentzians are almost stable in frequency.
-
•
All Lorentzian components in 4U 0614+09 and 4U 1728–34 become broader as their frequency decreases. This might explain why many Lorentzians in other sources are zero–centered when present at low frequencies.
-
•
For 4U 0614+09 the use of the multi–Lorentzian fit function clearly shows the presence of the band–limited noise QPO, where in the broken power law description, the very low–frequency Lorentzian is usually not statistically required. The similarity between the very low–frequency Lorentzian in 4U 0614+09 and 4U 1728–34, where the very low–frequency Lorentzian is statistically required in both descriptions, confirms the identification of the very low–frequency Lorentzian in 4U 0614+09.
6 Acknowledgements
This work was supported by NWO SPINOZA grant 08–0 to E.P.J. van den Heuvel, by the Netherlands Organization for Scientific Research (NWO), and by the Netherlands Research School for Astronomy (NOVA). This research has made use of data obtained through the High Energy Astrophysics Science Archive Research Center Online Service, provided by the NASA/Goddard Space Flight Center. We would like to thank Bob Shirey for providing us with a table of the Cir X–1 data.
References
- Bardeen & Petterson (1975) Bardeen, J. M., & Petterson, J. A., 1975, ApJ, 195, L65
- Belloni et al. (1997) Belloni, T., van der Klis, M., Lewin, W.H.G. van Paradijs, J., Dotani, T., Mitsuda, K., Miyamoto, S., 1997, A&A, 322, 857
- Belloni, Psaltis & van der Klis (2001) Belloni, T., Psaltis, D., van der Klis, M., 2001, ApJ, submitted (BPK01)
- Brandt et al. (1992) Brandt, S., Castro–Tirado, A. J., Lund, N., Dremin, V., Lapshov, I., Sunyaev, R., 1992, A&A, 262, L15
- Cui, Chen & Zhang (2000) Cui, W., Chen, W., Zhang, S. N., in Proc. Meeting on the Lense–Thirring effect, ed. L. Z. Fang & R. Ruffini (singapore: World Scientific), in press (astro-ph/9811023)
- Di Salvo et al. (2001) Di Salvo, T., Méndez, M., van der Klis, M., Ford, E., Robba, N.R., 2001, ApJ, 546, 1107 (DS01)
- Ford et al. (2000) Ford, E. C., van der Klis, M., Méndez, M., Wijnands, R., Homan, J., Jonker, P. G., van Paradijs, J., 2000, ApJ, 537, 368
- Foster et al. (1986) Foster, A.J., Fabian, A.C., Ross, R.R. 1986, MNRAS, 221, 409
- Fragile, Mathews & Wilson (2001) Fragile, P. C., Mathews, G. J., Wilson, J. R., 2001, ApJ, 553, 955
- Franco (2001) Franco, L. M., 2001, ApJ, 554, 340
- Hasinger & van der Klis (1989) Hasinger, G., & van der Klis, M., 1989, A&A, 225, 79
- Homan et al. (2001) Homan, J., van der Klis, M., Jonker, P. G., Wijnands, R., Kuulkers, E., Méndez, M., Lewin, W. H. G., 2001, ApJ, submitted (astro-ph/0104323)
- Leahy et al. (1983) Leahy, D. A., Darbro, W., Elsner, R. F., Weisskopf, M. C., Kahn, S., Sutherland, P. G., Grindlay, J. E., 1983, ApJ, 266, 160
- Lewin et al. (1993) Lewin, W.H.G., van Paradijs, J., Taam, R.E. 1993, Sp. Sc. Rev. 62, 223
- Morgan, Remillard & Greiner (1997) Morgan, E.H., Remillard, R.A., Greiner, J., 1997, ApJ, 482, 993
- Nowak (2000) Nowak, M.A., 2000, MNRAS, 318, 361
- Psaltis, Belloni & van der Klis (1999) Psaltis, D., Belloni, T., van der Klis, M., 1999, ApJ, 520, 262 (PBK99)
- Remillard et al. (1999) Remillard, R.A., Morgan, E.H., McClintock, J.E., Bailyn, C.D., Orosz, J.A., 1999, ApJ, 522, 397
- Schultz (1999) Schultz, N. S., 1999, ApJ, 511, 304
- Shirey (1998) Shirey, R. E., 1998, Ph. D. thesis, MIT (astro-ph/9806346)
- Sunyaev & Revnivtsev (2000) Sunyaev, R., & Revnivtsev, M., 2000, A&A, 358, 617
- Swank et al. (1978) Swank, J.H., Becker, R.H., Boldt, E.A., Holt, S.S., Serlemitsos, P.J., 1978, MNRAS, 182, 349
- (23) van der Klis, M., 1994a, A&A, 283, 469
- (24) van der Klis, M., 1994b, ApJSuppl., 92, 511
- van der Klis (1995) van der Klis, M., 1995, in “X-ray binaries”, eds. Lewin, W.H.G., Van Paradijs, J., & Van den Heuvel, E.P.J., Cambridge Univ. Press., Cambridge, p252.
- van der Klis (2000) van der Klis, M. 2000, ARA&A, 38, 717
- van Straaten et al. (2000) van Straaten, S., Ford, E.C., van der Klis, M., Méndez, M., Kaaret, P. 2000, ApJ, 540, 1049 (vS00)
- van Straaten et al. (2001) van Straaten, S., van der Klis, M., Kuulkers, E., Méndez, M., 2001, ApJ, 551, 907
- Wijnands & van der Klis (1998) Wijnands, R., van der Klis, M., 1998, ApJ, 507, L63
- Wijnands & van der Klis (1999) Wijnands, R., van der Klis, M., 1999, ApJ, 514, 939 (WK99)
- Zhang et al. (1993) Zhang, W., Giles, A.B., Jahoda, K., Soong, Y., Swank, J.H., Morgan, E.H., 1993, SPIE, 2006, 324
| Interval | zc Lorentzian | VLF Lorentzian | LF Lorentzian | hHz Lorentzian | Lower kHz QPO | Upper kHz QPO |
|---|---|---|---|---|---|---|
| Number | (Hz) | (Hz) | (Hz) | (Hz) | (Hz) | (Hz) |
| 4U 1728–34 | ||||||
| 1 | 1.9760.057 | – | 11.470.16 | 17835 | – | 39913 |
| 2 | 2.0770.046 | – | 11.750.13 | 17322 | – | 41612 |
| 3 | 2.9830.083 | – | 16.190.25 | 20328 | – | 49714 |
| 4 | 3.9760.060 | – | 19.720.17 | 175.05.3 | – | 519.15.1 |
| 5 | 4.1840.059 | – | 20.120.16 | 175.36.1 | – | 521.45.2 |
| 6 | 4.560.12 | – | 21.560.33 | 19813 | – | 531.78.0 |
| 7 | 12.30.9 | – | 27.51.0 | 17514 | – | 705.78.1 |
| 8 | 16.630.60 | – | 31.290.63 | 152.36.5 | – | 732.63.1 |
| 9 | 14.24.5 | 16.200.46 | 36.260.47 | 130.75.9 | – | 791.12.2 |
| 10 | 19.52.3 | 19.390.31 | 42.140.77 | 136.94.5 | 51318 | 849.52.0 |
| 11 | 21.22.2 | 20.960.23 | 45.520.66 | 127.33.2 | 56111 | 875.71.6 |
| 12 | 18.82.6 | 23.080.29 | 46.700.91 | 129.73.6 | 60414 | 907.62.5 |
| 13 | 11.61.2 | 30.610.53 | – | 130.92.9 | 68010 | 951.03.7 |
| 14 | 16.91.8 | 40.640.47 | – | 147.15.3 | 754.03.7 | 1056.28.2 |
| 15 | 13.31.0 | 42.210.29 | – | 164.35.3 | 775.31.7 | 1107.57.2 |
| 16 | 14.51.5 | 43.390.32 | – | 151.67.8 | 819.94.1 | 113412 |
| 17 | 12.9 | 43.210.98 | – | 22427 | 879.23.0 | 116116 |
| 18 | – | 33.43.61 | – | – | – | – |
| 19 | – | 20.93.51 | – | – | – | – |
| 4U 0614+09 | ||||||
| 1 | 0.30540.0046 | – | 2.0570.014 | – | 19.970.461 | 233.48.61 |
| 2 | 1.4340.020 | – | 9.5580.076 | 15712 | – | 369.77.5 |
| 3 | 3.470.14 | – | 16.390.43 | 15312 | – | 48115 |
| 4 | 10.740.71 | – | 25.380.76 | 153.67.7 | – | 629.64.3 |
| 5 | 7.0 | 17.540.46 | 37.700.63 | 121.85.3 | – | 755.84.1 |
| 6 | 9.11.7 | 21.110.37 | 44.4 | 121.03.3 | 51712 | 833.24.2 |
| 7 | 11.4 | 26.170.42 | – | 132.34.7 | 607.91.7 | 925.93.5 |
| 8 | 21.05.0 | 31.170.41 | – | 148.95.0 | 754.82.4 | 1137.17.0 |
| 9 | – | 23.770.921 | – | 117.51.5 | – | 1273.69.5 |
Note. — Listed are the characteristic frequencies () of the different Lorentzians described in §3. The quoted errors in use = 1.0.
1 The identification of this Lorentzian is not clear, see §3.
| Interval | VLF Lorentzian | LF Lorentzian | hHz Lorentzian | Lower kHz QPO | Upper kHz QPO |
|---|---|---|---|---|---|
| Number | |||||
| 4U 1728–34 | |||||
| 1 | – | 0.5890.037 | 0.030.15 | – | 1.66 |
| 2 | – | 0.5780.030 | 0.090.11 | – | 1.460.26 |
| 3 | – | 0.4370.029 | 0.510.14 | – | 1.770.42 |
| 4 | – | 0.5940.021 | 0.7690.073 | – | 1.810.13 |
| 5 | – | 0.6230.020 | 0.6520.061 | – | 1.760.13 |
| 6 | – | 0.6340.039 | 0.580.10 | – | 2.290.30 |
| 7 | – | 2.040.80 | 0.520.17 | – | 4.290.59 |
| 8 | – | 2.170.44 | 0.4450.083 | – | 4.230.21 |
| 9 | 0.90 | 2.640.38 | 0.2560.062 | – | 5.300.22 |
| 10 | 1.600.21 | 2.520.44 | 0.5450.074 | 5.4 | 6.290.29 |
| 11 | 1.64 | 3.8 | 0.6030.058 | 6.5 | 6.620.22 |
| 12 | 1.620.25 | 3.440.88 | 0.7620.086 | 4.290.98 | 6.780.38 |
| 13 | 0.6900.059 | – | 1.120.12 | 3.890.68 | 6.040.45 |
| 14 | 1.780.18 | – | 1.440.22 | 6.210.47 | 6.91.1 |
| 15 | 1.990.11 | – | 1.530.24 | 7.520.37 | 7.91.0 |
| 16 | 2.200.16 | – | 1.370.23 | 4.960.20 | 10.52.0 |
| 17 | 1.670.28 | – | 1.110.46 | 13.21.3 | 10.7 |
| 18 | 0.620.181 | – | – | – | – |
| 19 | 0.680.221 | – | – | – | – |
| 4U 0614+09 | |||||
| 1 | – | 0.5040.017 | – | 0.0570.0391 | 0.5120.0701 |
| 2 | – | 0.4640.0177 | 0.2520.058 | – | 1.520.21 |
| 3 | – | 0.5550.065 | 0.610.14 | – | 1.940.38 |
| 4 | – | 0.980.22 | 0.360.10 | – | 3.660.30 |
| 5 | 0.810.17 | 6.2 | 0.2170.067 | – | 4.340.29 |
| 6 | 1.040.14 | 6 | 0.5760.079 | 5.9 | 5.170.34 |
| 7 | 1.440.19 | – | 0.790.11 | 13 | 11.11.2 |
| 8 | 1.590.15 | – | 1.270.18 | 10.51.2 | 7.020.86 |
| 9 | 0.6350.0591 | – | 2.790.27 | – | 10.92.9 |
Note. — Listed are the values () of the different Lorentzians described in §3. The quoted errors in use = 1.0.
1 The identification of this Lorentzian is not clear, see §3.
| Interval | zc Lorentzian | VLF Lorentzian | LF Lorentzian | hHz Lorentzian | Lower kHz QPO | Upper kHz QPO |
|---|---|---|---|---|---|---|
| Number | rms (%) | rms (%) | rms (%) | rms (%) | rms (%) | rms (%) |
| 4U 1728–34 | ||||||
| 1 | 13.320.17 | – | 14.430.30 | 13.71.2 | – | 9.11.4 |
| 2 | 13.110.14 | – | 14.460.25 | 13.170.80 | – | 9.640.89 |
| 3 | 13.080.19 | – | 14.560.26 | 11.81.3 | – | 10.721.28 |
| 4 | 13.820.10 | – | 13.470.15 | 10.670.34 | – | 12.100.32 |
| 5 | 13.8780.093 | – | 13.170.14 | 11.130.35 | – | 11.820.34 |
| 6 | 13.890.17 | – | 13.000.27 | 11.710.64 | – | 10.900.61 |
| 7 | 15.470.49 | – | 5.8 | 12.470.74 | – | 12.070.56 |
| 8 | 14.930.24 | – | 4.800.51 | 10.740.36 | – | 12.380.21 |
| 9 | 11.22.6 | 6.2 | 4.830.39 | 12.23 | – | 11.950.17 |
| 10 | 11.680.82 | 5.030.75 | 3.990.42 | 10.050.36 | 3.020.52 | 10.810.19 |
| 11 | 11.220.69 | 5.180.59 | 2.870.38 | 9.190.36 | 2.910.34 | 10.430.13 |
| 12 | 9.900.77 | 5.890.67 | 3.090.40 | 8.930.37 | 4.500.37 | 9.960.22 |
| 13 | 6.120.38 | 8.460.33 | – | 6.830.23 | 5.450.38 | 8.200.24 |
| 14 | 5.730.26 | 5.410.25 | – | 4.680.24 | 6.920.21 | 5.330.32 |
| 15 | 4.360.13 | 5.160.12 | – | 3.910.19 | 7.010.12 | 4.500.21 |
| 16 | 3.920.16 | 4.730.13 | – | 3.600.20 | 7.610.13 | 3.150.26 |
| 17 | 2.910.41 | 4.490.29 | – | 3.820.46 | 5.710.22 | 3.410.50 |
| 18 | – | 2.770.181 | – | – | – | – |
| 19 | – | 2.210.201 | – | – | – | – |
| 4U 0614+09 | ||||||
| 1 | 17.950.11 | – | 20.180.23 | – | 21.430.371 | 16.550.521 |
| 2 | 16.540.11 | – | 19.200.18 | 17.690.83 | – | 12.91.0 |
| 3 | 17.450.38 | – | 17.280.64 | 17.61.2 | – | 16.11.2 |
| 4 | 17.450.63 | – | 10.81.3 | 18.840.80 | – | 16.900.53 |
| 5 | 7.8 | 11.21.2 | 3.57 | 19.970.53 | – | 16.340.37 |
| 6 | 8.5 | 10.640.72 | 3.3 | 16.340.48 | 5.550.67 | 14.420.34 |
| 7 | 7.8 | 9.540.62 | – | 12.980.46 | 9.45 | 10.660.42 |
| 8 | 5.500.77 | 8.320.39 | – | 9.070.40 | 9.210.35 | 10.310.43 |
| 9 | – | 6.090.161 | – | 6.330.21 | – | 5.270.46 |
Note. — Listed are the values of the integrated fractional rms (over the full PCA energy band) of the different Lorentzians described in §3. The quoted errors in the rms use = 1.0.
1 The identification of this Lorentzian is not clear, see §3.
 |
 |
|
 |
 |
 |
 |
|
 |
 |
 |
 |
|
 |
 |
 |
 |
|
 |
 |
 |
 |
|
 |
 |
 |
|
 |
 |
 |
 |
|
 |
 |
 |