Simulated Radio Images and Light Curves of Young Supernovae
Abstract
We present calculations of the radio emission from supernovae based on high-resolution simulations of the hydrodynamics and radiation transfer, using simple energy density relations which link the properties of the radiating electrons and the magnetic field to the hydrodynamics. As a specific example we model the emission from SN1993J, which cannot be adequately fitted with the often-used analytic mini-shell model, and present a good fit to the radio evolution at a single frequency. Both free-free absorption and synchrotron self-absorption are needed to fit the light curve at early times and a circumstellar density profile of provides the best fit to the later data. We show that the interaction of density structures in the ejecta with the reverse supernova shock may produce features in the radio light curves such as have been observed. We discuss the use of high-resolution radio images of supernovae to distinguish between different absorption mechanisms and determine the origin of specific light curve features. Comparisons of VLBI images of SN1993J with synthetic model images suggest that internal free-free absorption completely obscures emission at 8.4 GHz passing through the center of the supernova for the first few tens of years after explosion. We predict that at 8.4 GHz the internal free-free absorption is currently declining, and that over the next years the surface brightness of the center of the source should increase relative to the bright ring of emission seen in VLBI images. Similar absorption in a nearby supernova would make the detection of a radio pulsar at 1 GHz impossible for years after explosion.
1 Introduction
Although supernovae (SNe) have been observed over many centuries, it is only in the past few decades that it has been possible to detect them at radio wavelengths soon after outburst. Since the first radio SN (RSN) detection by Gottesman et al. (1972), many more RSNe have been observed, and a few have been discovered by virtue of their radio emission alone (e.g. SN1981K and SN1986J). One of the earliest RSNe to be discovered, SN1979C, has been extensively monitored at radio wavelengths for almost two decades. Many others, such as SN1986J, SN1980K, SN1993J and the well-known SN1987A, have also been the subject of extended studies.
Weiler et al. (1986) and Weiler, Sramek & Pangia (1996) identified several common characteristics of most RSNe: a) the emission is non-thermal with very high brightness temperatures; b) they appear first at high frequencies and then progressively at lower frequencies; c) at each frequency there is an initial rapid increase and then, after reaching a maximum, the radio flux density declines as a power-law in time; d) the spectral index (where the flux density ) between any two frequencies is initially negative, increases rapidly, and ultimately approaches a constant positive value. It is generally accepted that the radio emission from SNe is synchrotron radiation from ultra-relativistic electrons accelerated at the expanding supernova shock (or shocks). The declining power-law frequency spectrum seen after the SN radio emission peaks is consistent with optically-thin synchrotron emission from a power-law energy distribution of ultrarelativistic electrons. The observed characteristics (a)–(d) are thus often loosely summarized by the statement that radio SNe exhibit an optically-thick rise followed by an optically-thin power-law decline. Recent observations of deviations of RSNe light curves from long-term trends have been attributed to changes in the ambient density (Montes et al., 1998, 2000; Panagia et al., 1999).
The radio emission from supernovae is thought to arise in the hydrodynamically unstable interaction region between the SN ejecta and a circumstellar medium (CSM) formed by mass loss from the progenitor star. This region contains both shocked supernova ejecta and shocked swept-up material, separated by a contact discontinuity, and is bounded on the outside by a forward shock and on the inside by a reverse shock that travels back into the ejecta with respect to the contact discontinuity. The recent observation of a hard X-ray tail in the spectrum of SN1006 has shown that electrons can be accelerated up to TeV energies at a supernova shock (Koyama et al., 1995). The electrons may be subject to a magnetic field which is essentially that of the progenitor star wind, or which is amplified as a result of turbulence behind the supernova shock. However, there are as yet no detailed models that satisfactorily treat the hydrodynamics of the supernova expansion, the electron acceleration, and the origin and evolution of the magnetic field, that together conspire to give the observed radio properties.
An analytic treatment of the evolution of an idealized RSN by Chevalier (1982a, 1984) is often referred to as the “mini-shell model”. This model assumes that the expanding supernova is self-similar, with the shock radius expanding as a power-law in time, , where is a constant (Chevalier, 1982a). The energy distribution of the relativistic electrons is assumed to be a power law of constant spectral index, and the energy density of the relativistic electrons and that of the magnetic field are assumed to each be a constant fraction of the thermal energy density behind the expanding supernova shock. Free-free absorption in the ionized CSM (Chevalier, 1982b), which decreases as the SN shock expands through the overlying CSM, can produce an initial optically-thick increase in flux density. Decreasing synchrotron self-absorption (SSA) in the expanding radio source may also be important (Chevalier & Dwarkadas, 1995; Chevalier, 1998).
The mini-shell model, and a range of empirical variants of it (cf. Van Dyk et al. 1994a; Weiler et al. 1996), have been used to parameterize the radio emission from a number of young supernovae. The mini-shell model works well within its limitations (Chevalier, 1986) and can successfully reproduce the evolution of some RSNe. However, some of the empirical extensions of the mini-shell model which have been used to fit recent RSNe no longer reflect the physical basis of the original model. Furthermore, the mini-shell model assumes self-similarity and is therefore not applicable to RSNe whose ejecta are not represented by a power-law density profile, or whose expansion is not self-similar for other reasons.
Attempts to compute RSN models that incorporate a more detailed treatment of the physical processes involved have generally focused on trying to describe in more detail the acceleration of electrons to relativistic energies. Duffy, Ball, & Kirk (1995) considered a time-dependent treatment of diffusive shock acceleration in their study of SN1987A. They used a 2-fluid model in which the accelerated ions provided an additional component to the total pressure. Fransson & Björnsson (1998) adopted a different approach in their study of SN1993J, opting to fit the individual radio spectra at the various observed dates, rather than concentrating on the light curves at different wavelengths. Their calculated light curves are consistent with observations up to an age of about 4 years. Jun & Jones (1999) have included relativistic electron transport in their magnetohydrodynamic simulations of a young supernova remnant interacting with an interstellar cloud.
We have developed a robust and general method to relate the hydrodynamics of a supernova explosion to the evolving radio emission from these sources. We first compute the evolution of the SNe using spherically-symmetric, high-resolution numerical hydrodynamic simulations. Our method allows for the use of arbitrary profiles for the SN ejecta and circumstellar medium, a significant generalization from analytic models which are restricted to the self-similar expansion which results from power-law ejecta and CSM profiles. The light curves are produced by a detailed radiative transfer calculation using ray tracing methods. Synchrotron self-absorption is implicitly included in the calculation, free-free absorption in the surrounding medium is explicitly calculated, and in one case we include internal free-free absorption. The relativistic particle energy density and the magnetic energy density can be independently specified, and in general are a function of radius. In the simplest implementation, used for the results presented in this paper, these are taken to be a fixed fraction of the local thermal energy density, similar to the assumptions used in the mini-shell model. A further generalization of the method, computing the local relativistic particle distribution using advanced particle acceleration codes, is already underway.
The results of calculations for a model for SN1980K with power-law ejecta and CSM density profiles – giving a self-similar expansion – are presented as a test of our method. We then model the emission from a model of SN1993J with a complicated ejecta profile which is motivated by detailed modeling of the optical and x-ray emission, and which results in an expansion that is far from self similar.
In this paper we first describe our method, give the results of calculations of the radio emission from model RSNe, and compare the model emission with the observational data for SN1980K and SN1993J. The radiation transfer calculation and the manner of computation are outlined in §2. In §3 we describe the process of calculating the model radio emission, including the hydrodynamic simulations that are used as an input to the radiative transfer code. As a test of the method and the code we calculate the radio evolution from a hydrodynamical simulation of a self-similar shock expansion, and compare the results with the behavior expected from an analytic treatment of this special case. In §4 we discuss the process of fitting observed radio data, and present the results of model calculations for SN1980K, which can be fitted using the minishell model, and SN1993J which cannot. Finally, in §5 we evaluate the results, discuss the implications of this work, and outline future prospects.
2 Radiation Transfer
The basic radiation transfer equation (e.g. Rybicki & Lightman 1979) is
| (1) |
where is the flux density, is the emissivity and is the opacity, all at position . The optical depth between position and is defined as
| (2) |
The solution to Equation (1) between and can then be written as
| (3) |
We assume that there is no background radiation (i.e., ), and denote the diameter of the SN by so that the equation we use for our radiation transfer calculations is:
| (4) |
where is the angle between the line of sight and the radial line to the intersection of the line of sight and the shock.
The hydrodynamical simulations discussed here are 1-dimensional. The code converts these data into a 3-dimensional sphere embedded in a Cartesian grid. The hydrodynamical quantities at each grid point are used to calculate and (as described in the next two sections). These are then integrated along each line of sight to calculate and finally the flux density, for that line of sight. The integration is performed using the trapezoidal rule. The numerical grid is sufficiently fine that the method is adequate, and the trapezoidal rule is very robust. A 2-dimensional array of surface brightness (as a function of position across the source) is built, and this array can be used to produce a synthetic image or summed to obtain a point on a light curve.
2.1 Synchrotron Emission & Absorption
The synchrotron emissivity () and opacity () depend on the distribution of the radiating electrons, the magnetic field (), and the frequency (). We assume that the energy distribution of ultra-relativistic electrons is a power law where is the particle energy, and are constants, and the total number density is . The hydrodynamical simulations do not provide direct information on the magnetic field or the high energy particle distribution. Here we follow Chevalier (1982b) and assume that the magnetic energy density, , and the relativistic particle energy density, , are proportional to the thermal particle internal energy density, , such that
| (5) | |||||
| (6) |
where and are constants. In the Chevalier (1982b) mini-shell model these constants are set to around 1%. The common assumption of energy equipartition corresponds to . There is some justification for such a relation between the energy densities: is high between the forward and reverse shock, which is where the magnetic field is likely enhanced and the particles accelerated to relativistic speeds. However such arguments are weak and ultimately need to be replaced by physical processes, such as particle acceleration.
The thermal particle energy density is related to the thermal pressure (), which is output by the hydrodynamic simulations, through the adiabatic index ():
| (7) |
Following Mioduszewski, Hughes, & Duncan (1997) equations (5), (6) and (7) can be used to write the synchrotron emissivity and opacity as
| (8) | |||
| (9) |
where , , , and are input parameters, , and is obtained from the hydrodynamic simulations.
2.2 Free-Free Absorption
In contrast to the synchrotron emission, free-free absorption (FFA) depends upon the thermal density and temperature of the plasma and therefore can be calculated with a minimum of assumptions. The opacity () goes as
| (10) |
where is the refractive index and is a constant (Lang, 1980). For most of the models for RSNe considered here the free-free absorption arises from the overlying circumstellar medium (CSM) and . In the hydrodynamical simulations the CSM density is assumed to fall off as a power law, where is the radial distance from the progenitor and is a constant. We also assume that a constant fraction of is ionized. The temperature () of the CSM is assumed to be constant with radius and is an input parameter. The free-free optical depth, is obtained by integrating from the outer edge of the SN, determined by the radius of the forward shock (), to infinity, whence:
| (11) |
where is independent of .
Although the external temperature is a parameter in the hydrodynamical simulations, it does not have a strong effect on the pressure between the forward and reverse shocks (because the pressure of the CSM is much less than the pressure in the post-shocked region), where most of the radiation is produced. It is therefore reasonable to use a single hydrodynamical simulation to calculate the resulting synchrotron emission for a range of assumed CSM temperatures.
3 Computing Light Curves
We calculate light curves in two steps. First, a hydrodynamical simulation is run for a given SN ejecta profile and a given CSM profile. The results of a simulation comprise the spatial profile of hydrodynamical quantities at different epochs in the evolution of the SN. The particular outputs we require are the pressure profiles at each epoch, which are used as inputs to the radiation transfer code to calculate the radio flux densities of the SN at each epoch.
3.1 Hydrodynamic Simulations
We model the hydrodynamics of the interaction of the expanding supernova ejecta with the circumstellar medium using high-resolution simulations. All the simulations described here were carried out with the VH-1 code, a 3D finite-difference code (here used as 1D) based on the Piecewise Parabolic Method of Colella & Woodward (1984). The calculations are carried out in Lagrangian co-ordinates and re-mapped onto an Eulerian grid.
The VH-1 code uses an expanding grid which is essential for simulations where the dimensions change by orders of magnitude over a single run. The grid tracks the outer shock and the outer grid radius increases accordingly. The rate of expansion of the grid is adjusted such that most of the grid is taken up by the interaction region, bounded by the inner (or reverse) shock, and the outer (or forward) shock. Resolving this high-pressure region in detail is the highest priority since it is the source of most of the radio emission. Over a large part of the evolution almost a half to two-thirds of the grid is occupied by the interaction region, ensuring that it is sufficiently well sampled.
Setting up the initial conditions for a simulation requires a model for the SN ejecta and a model for the CSM that the ejecta are to expand into. For Type II supernovae the most commonly used ejecta models have a density profile which is uniform inside some reference radius and decreases as a power law with radius in the outer parts. The interaction of power-law ejecta with a power-law circumstellar medium can be described analytically by the self-similar solutions of Chevalier (1982a) and Nadyozhin (1985).
If the CSM is formed via a constant wind from the progenitor star before it exploded as a SN, then the wind density of this medium would vary as where is the radial distance from the star. Ultimately, as the wind merges with the interstellar medium, the density profile must approach a uniform value. Many factors, such as evolution of the wind or structure in the pre-existing ambient medium, can lead to different density distributions at smaller radii.
3.2 Testing the code: Self-Similar Solutions
We first test the code by computing the emission from a self-similarly evolving SN which can be compared with analytic results. We consider SN ejecta with a power-law density profile where is the density, is the velocity of the freely-expanding ejecta at radius , and is a constant. When such ejecta expand into a circumstellar medium with density , the radius of the contact discontinuity () evolves as (Chevalier, 1982a). The intrinsic (unabsorbed) flux density, given the assumed scalings of the magnetic field and relativistic electrons, then scales with frequency and time as where (Chevalier, 1982b) and .
| analytic | measured | |
|---|---|---|
| no absorption | 1.05 | 1.05 |
| synchrotron-self absorption | 2.30 | 2.32 |
| free-free absorption | 2.70 | 2.71 |
Note. — The index quoted for the free-free absorption case is for , rather than for the flux density itself.
Most observed SN light curves are characterized by a rapid, optically-thick rise and a more gradual optically-thin decline (for examples see Weiler, Sramek & Pangia (1996)). The optically-thick rise in these models is caused by decreasing absorption as the SN expands. This absorption can be due to free-free absorption and/or synchrotron self-absorption. Since the free-free absorption is directly related to the density of the overlying CSM, the decreasing CSM density with radius causes the free-free absorption to decline. Less directly, the synchrotron self-absorption decreases because the declining density in the CSM causes the the pressure between the forward and reverse shocks to decrease and thus the magnetic field and density of relativistic particles decrease. We consider three limits in which the time dependence of the radio flux density can be expressed analytically (Chevalier, 1982a, 1984):
-
1.
optically thick due to internal synchrotron self-absorption
(12) -
2.
optically thin (i.e. with negligible optical depth due to either synchrotron self-absorption or free-free absorption)
(13) -
3.
optically thick due to external free-free absorption.
(14) where is the flux density in the absence of absorption.
For the specific self-similar case we consider, and and we set . Thus . Table 1 shows the analytic values of the time indices for these three cases together with the values obtained from fitting the light curves produced by the radiation transfer code for the corresponding hydrodynamical simulation. The agreement is remarkably good.

4 Fitting Light Curves
Given the results of a numerical hydrodynamical simulation, 4 further parameters must be specified to calculate the evolving radio emission: the spectral index ( or ), the temperature of the CSM (), and the energy density constants, and . The different effects that these 4 parameters have on the light curves, and their implications for fits to observed data, can be summarized as follows:
-
influences only the external free-free absorption. Most importantly, this parameter determines the time when the optical depth is small enough that the source can first be observed (i.e. when the SN turns on in the radio) if free-free absorption is the dominant absorption mechanism at that time. Increasing the ionization fraction of the CSM can mimic decreasing the temperature (see equation 10). A model in which the CSM temperature decreases with radius could also produce a low optical depth early in the SN evolution. The fitted model parameter therefore does not necessarily reflect the true temperature of the CSM.
- (or equivalently, )
-
determines the frequency dependence and the slope of the optically-thin decline, as can be seen from inspection of equation (13). Its other effects can be balanced by the constants, and .
- and
-
affect the relative levels of the optically-thin and thick parts of the light curve, but do not change the slope of the rise or fall of the light curve. When the late optically-thick part of the light curve is dominated by synchrotron self-absorption these parameters determine the position of the peak of the light curve.
We calculate the flux density in arbitrary units, and finally scale the light curves to the observed data. The values of and must satisfy the physical restriction ; but cannot be determined independently. When synchrotron self-absorption is unimportant and can be absorbed into the overall scaling parameter and so are not determined by the model fit, and are not quoted. When synchrotron self-absorption is important, any two models with the the same value of produce the same radio emission apart from an arbitrary scale factor.
We follow an iterative procedure to fit the observed evolution of a radio supernova. Having chosen and run an appropriate hydrodynamical simulation, we choose a set of the four additional model parameters and calculate the radiative transfer to obtain the radio evolution. The four parameters are adjusted on the basis of a comparison of the computed radio emission with the observed data, and the radiative transfer calculation is repeated for the same hydrodynamical simulation results.
4.1 SN1980K
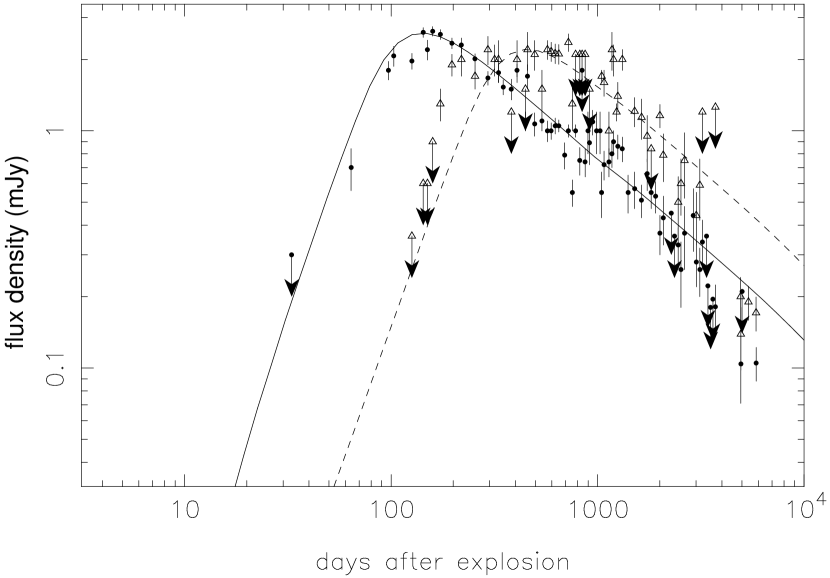
SN1980K is a Type II supernova that was searched for at radio wavelengths soon after optical maximum, but not detected until some 35 days later (Weiler et al., 1986). Weiler et al. (1992) fit a Chevalier mini-shell model, with free-free absorption in an CSM, to the data and obtain a reduced of 2.7. A fit to a more extensive data set by Montes et al. (1998) provides a similar value of reduced , but the model used is not directly comparable to our calculations.
Our method is a generalization of the Chevalier mini-shell model, and it provides a similarly satisfactory fit to the data for a simple power-law ejecta density profile expanding into a CSM with . Figure 1 shows the observed radio evolution of SN1980K at two frequencies together with two such model fits. The left panel shows a model with only free-free absorption in the CSM. The implied is quite high (), but is consistent with the value found by Lundqvist & Fransson (1988) at early times. In any event, may not indicate the true temperature of the CSM, as explained at the beginning of this section. A fit using the same hydrodynamical model when synchrotron self absorption is important, but there is negligible free-free absorption in the CSM, is shown in the right panel of Figure 1. Qualitatively, the two alternative model fits to the 5 GHz light curves are very similar; the free-free absorption model fits the optically thick rise at 1.4 GHz better, but the synchrotron self-absorption model better matches the peak. Quantitatively, the fits give comparable values of and we cannot distinguish between the two absorption mechanisms. The values of both of these fits (calculated using the data up to day 3380) are very similar to that of Weiler et al. (1992).
Chevalier (1998) estimated the minimum radius of the SN at the peak of the light curve if synchrotron self-absorption was the dominant absorption mechanism, and argued synchrotron self-absorption was probably not significant in SN1980K because the implied expansion velocity is much smaller than observed. However, this argument assumes equipartition of energy between the relativistic particle energy density and the magnetic energy density (i.e., ). The model that we fit allows and to take values which are far from equipartition, in which case the arguments of Chevalier (1998) imply an expansion velocity for SN1980K which is similar to the measured velocity and synchrotron self-absorption is not ruled out.
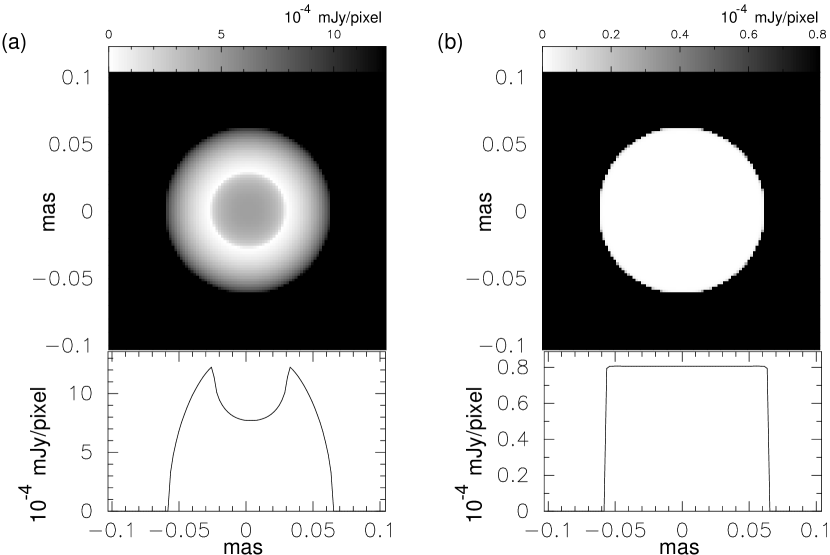
Although neither the fits to the light curves, nor the expansion velocity arguments, determine whether the observed optically-thick rise of SN1980K is dominated by free-free absorption or by synchrotron self-absorption, the spatial distribution of surface brightness in these two cases is quite different. Our method of calculation of the radio emission allows us to generate synthetic images, and two examples are shown in Figure 2. These synthetic radio images and the corresponding radial profiles of the surface brightness shown below them are for the same simulations used to produce the light curves in Figure 1. They show the emission at 1.48 GHz on day 172 after explosion, when the source is still optically thick at this frequency. The free-free absorption dominated image is a distinct ring which is brightest at a radius roughly half the total radius of the source. In contrast, the synchrotron self-absorption dominated image is a uniformly-bright disk. These differences were predicted analytically by Marscher (1985) and would be easily distinguishable (in principle) via high resolution images at epochs very soon after the explosion of a radio supernova. Unfortunately, SN1980K could not have been imaged at sufficient resolution to reveal these differences, and even the two closest supernovae detected to date, SN1993J and SN1987A, were not imaged with sufficient resolution at early times to make this distinction.
4.2 SN1993J
SN1993J, in the nearby galaxy M81 at a distance of 3.6 Mpc (Freedman et al., 1994), is one of the closest SNe to explode in modern history. It is believed to be a Type II SN that may have been a member of a binary system (Höflich, Langer & Duschinger, 1993; Podsiadlowski et al., 1993; Woosley et al., 1994). The radio evolution of SN1993J has been followed in detail throughout most of its lifetime, and thanks to its proximity it has been possible to image the evolving RSN extensively with VLBI (Marcaide et al., 1997; Bartel et al., 2000). Marcaide et al. (1997) found that the expansion of the radio source was consistent with a self-similar dependence. However, Bartel et al. (2000), using careful astrometry on a larger sample of observations obtained over a longer time period, have reported that the expansion is not self-similar. The simple mini-shell model cannot reproduce the rapid turn-on and subsequent relatively slow optically-thick rise of the radio emission from SN1993J (Van Dyk et al., 1994b). Furthermore, since the evolution of the SN1993J radio source is not self-similar, a direct application of the mini-shell model is not appropriate. It is therefore an ideal test case for our method of calculation of the radio emission.
Fransson & Björnsson (1998) assumed a power-law ejecta density profile for SN1993J and produced simulated radio light curves which compare well with the early data. However, Nomoto, Suzuki, Iwamoto and other coworkers have suggested that the optical and X-ray evolution of SN1993J implies that the ejecta distribution is more complicated. Iwamoto et al. (1997) computed the 2D hydrodynamical evolution of SN1993J and calculated the optical light curve. They found a series of ejecta models that gave an acceptable fit to the observed light curve if the extent of the mixing for nickel was assumed to be larger than seen in their 2D simulations. Similar models were used by Suzuki & Nomoto (1995) to fit the X-ray emission with reasonable results.
We use a specific ejecta model supplied by this group – model 4H47 (courtesy of Ken Nomoto, private communication) – and calculate the hydrodynamics and radio emission from the model supernova. The model ejecta mass is 3.12 M⊙, the pre-SN progenitor star has a radius of 350 R⊙ and an envelope mass of 0.47 M⊙. The fraction of helium in the envelope mass was about 0.79. The explosion energy is 1051 ergs.
The density distribution of the CSM surrounding SN1993J is poorly constrained by observations. Many of the models that reproduce the optical, X-ray and radio emission require a density profile that falls off more slowly than (eg. Suzuki & Nomoto 1995; Fransson, Lundqvist & Chevalier 1996; Nomoto and Suzuki 1998; Van Dyk et al. 1998). Fransson & Björnsson (1998) however find the standard distribution to be adequate in their self similar modeling of the radio light curve. We therefore consider three CSM distributions, with density varying as , and .
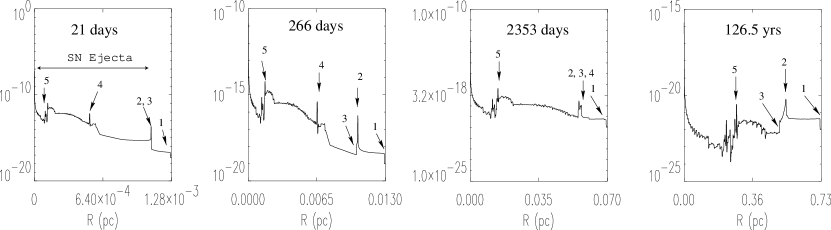
Figure 3 shows the density profiles at four timesteps during the hydrodynamic evolution for a CSM density profile of . The interaction of the ejecta with the CSM leads to the formation of an outer shock which expands through the CSM, and a reverse shock that propagates back into the ejecta, separated by a contact discontinuity. The 4H47 ejecta model contains local maxima, two of which are indicated by arrows in the top left panel of Figure 3. The inclusion of a cooling function in our hydrodynamical simulation means that these peaks remain well defined as the ejecta expand. There is a significant density jump just ahead of the outermost local density maximum (labelled 4). The interactions of this density jump and the local peak with the reverse shock occur at ages of around 1300 days and 2300 days respectively, the latter of which is close to the present epoch. These interactions have a dramatic effect on the pressure profiles, and hence on the expansion of the supernova and the radio emission.
The structure in the ejecta profile leads to a distinctly non-self-similar evolution. We define the expansion parameter so that for self-similar expansion , a constant. Figure 4 shows the variation of the expansion parameter with time during the early stages of the simulation of the interaction of the 4H47 ejecta with the CSM. The decrease of the expansion parameter with time over the first 2300 days, representing an increasing rate of deceleration of the supernova shock, is consistent with the observations of Bartel et al. (2000) who fit an expansion parameter up to 306 days and between 582 and 1893 days (shown as dashed lines in figure 4). At around day 2300 the interaction of the outermost local maximum in the ejecta density profile with the reverse shock leads to a significant increase in the pressure between the reverse and forward shocks. This has the effect of accelerating the forward shock and leads to the rapid increase in the expansion parameter seen in Figure 4 around days 2300–4000.
4.2.1 Radio Supernova 1993J
The radio evolution of SN1993J is most extensively followed at 8.4 GHz. We investigate the radio emission calculated from the hydrodynamical simulation of the 4H47 ejecta model by first trying to fit the observed 8.4 GHz light curve, and then considering the data at other frequencies.

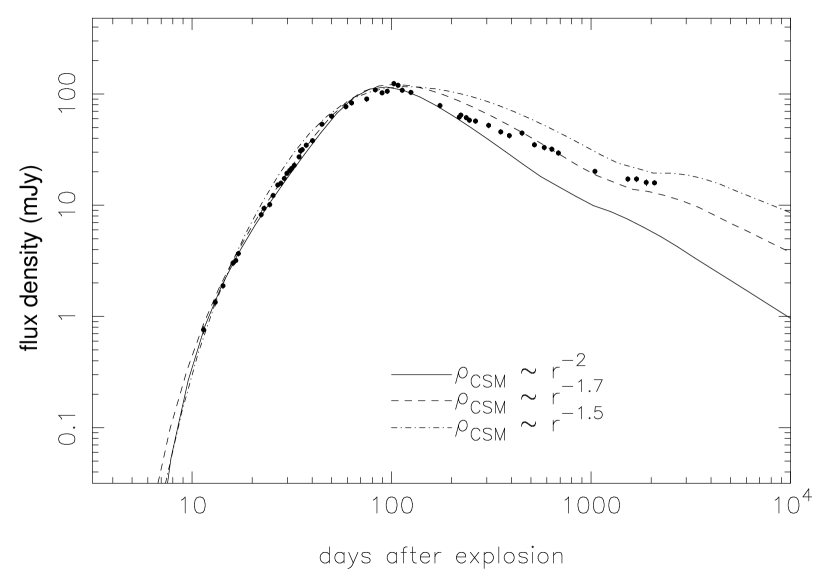
None of the fits obtained using only free-free absorption, or only synchrotron self-absorption, provides a good match to the early data for any of the CSM profiles considered. A much better fit is possible when both free-free absorption and synchrotron self-absorption are included. Figure 5 shows the best fits obtained for (solid line), (dashed line), and (dash-dotted line). All provide an adequate fit to the rising phase, an indication of the flexibility provided by the two different absorption processes. The differences between the models become apparent near the peak of the light curves, and increase as the flux density decreases. In the declining phase neither absorption process is important, and the only model parameters that affect the light curve for a given hydrodynamical simulation are the spectral index (or ), and the overall scaling. The fit for a CSM density profile of is very good at times up to about day 200, soon after the peak flux density, but at later times the model flux density drops off more rapidly than the observations. The CSM density profile of provides the best fit up to the present epoch. The decline of the model for is considerably slower than the observed dependence, and the peak is much broader than is observed.
For our best fit model, , which is smaller than the value quoted by Fransson & Björnsson (1998), and than the values suggested by Fransson et al. (1996) who considered the CSM temperature in detail. For the free-free opacity in our model is too high at early times.
All the model curves exhibit a temporary flattening in the decline, at times varying from day for , to day for . This is directly attributable to the interaction of the outer density jump and local maximum in the 4H47 model ejecta with the reverse supernova shock, which temporarily halts the decline in the pressure between the forward and reverse supernova shocks. The observed 8.4 GHz data show a similar flattening, starting around day 1500 and extending to at least day 2500. Such features in observed RSN light curves have previously been attributed to interactions between the SN shock with density structures in the CSM. Our simulations suggest that light curve features may also arise from interactions between the SN shock and density structures in the ejecta, but it will be difficult to distinguish between these two possibilities solely on the basis of the light curves.
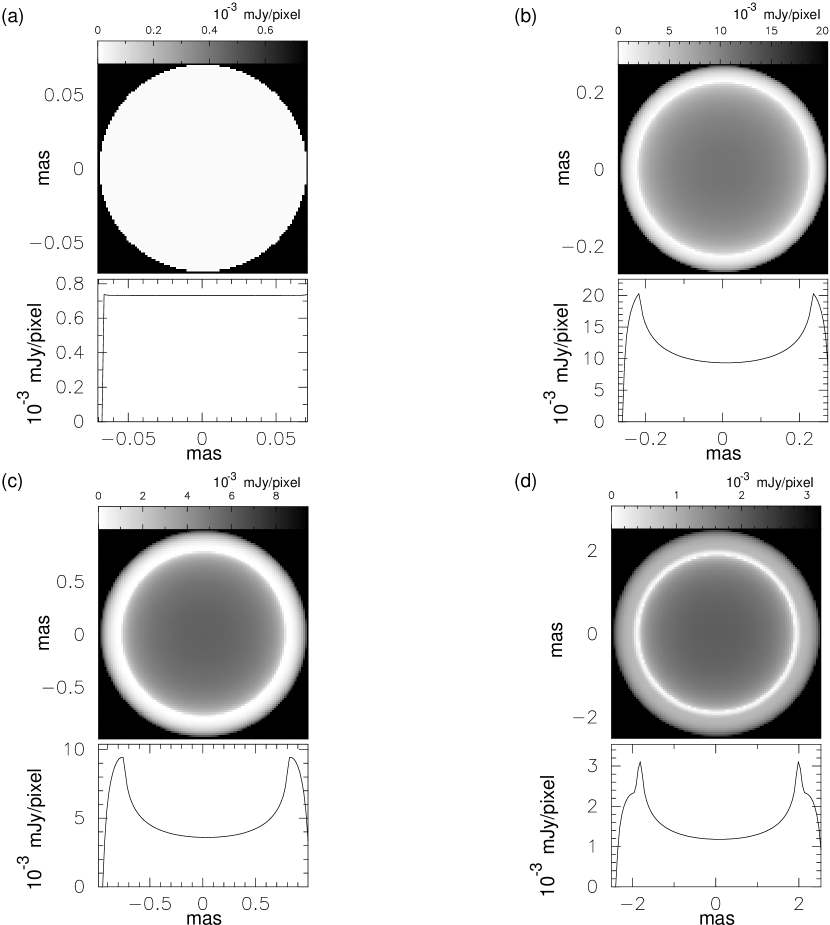
Figure 6 shows synthetic images and surface brightness profiles of SN1993J at 8.4 GHz at 20, 86, 390 and 1301 days after explosion, for the the same simulation as for Figures 4 and 5. On day 20 – panel (a) – the source is optically thick and synchrotron self-absorption dominates. As expected, this image is similar in character to the right panel in Figure 2. On day 86 – panel (b) – SN1993J is becoming optically thin. On day 390 – panel (c) – the source and the CSM are optically thin and the flux density at all frequencies is declining with time. On day 1301 – panel (d) – the model 8.4 GHz light curve has flattened as a result of the interaction of the density jump in the ejecta with the reverse shock. As expected, the ring seen in Figure 6 a, b and c is bound on the inside by the reverse shock, and on the outside by the forward shock. The VLBI images of SN1993J of Bartel et al. (2000) reveal a clumpy ring of emission that when averaged azimuthally is qualitatively similar to the simulated images shown in Figure 6. The radius and thickness of the bright ring of the synthetic images are similar to those of the observed data, but the radial profile of the surface brightness in the synthetic images is quantitatively different from that observed, a point we discuss in more detail in §4.2.2. Panel (d) shows a distinct brightening on the inner edge of the ring as a result of the pressure increase associated with the interaction of a density discontinuity in the ejecta with the reverse SN shock, which also causes the flattening seen in the model light curve. If the observed flattening were due to an interaction between the forward SN shock and a density structure in the CSM, the result would be a brightening on the outer edge of the emission ring. Such differences may ultimately provide a means of distinguishing between SN shock interactions with structures in the ejecta and those in the CSM. However images of SN1993J obtained to date are not of sufficiently high resolution to show these kinds of differences, and the clumpy nature of the images complicates their interpretation.

Although Figure 5 shows the model flux densities for only a single frequency, the model parameters determine the flux density at all frequencies and at all epochs. There are useful observations of the evolving radio flux density from SN1993J at four frequencies, 4.9, 8.4, 15.0 and 22 GHz. Figure 7 shows the observed data and the model flux densities for the parameters determined by the best fit in Figure 5 with . The limitations of the model are immediately apparent. Despite the relatively good fit of the model to the data at 8.4 GHz, the fits at the other frequencies are relatively poor at all times after the flux density has increased to a significant fraction of the maximum. This may be attributed to the model itself, not the particular choice of parameters used. The fundamental model assumptions that the magnetic energy density is proportional to the thermal energy density, and that the relativistic electron energy distribution is a (fixed) power law with an energy density which is also proportional to the thermal energy density, provide an unbreakable link between the frequency and time dependence of the model flux density. At late times when the source and the CSM are optically thin both the frequency and the time dependence of the model flux density are completely determined by the model parameter (or ) for a given hydrodynamical simulation. The other model parameters, , , and the overall scaling, have no effect on the frequency or temporal dependence at late times. In particular, the model fit to the 8.4 GHz data requires the choice to fit the observed temporal evolution. This value of implies , which determines the frequency dependence of the model. If the simulation was self similar the model flux density in the optically-thin regime would therefore have a frequency dependence of . A simple fit to the observed spectra at times after about 150 days indicates , a difference which is much too large to be adequately fitted by the simulation.

4.2.2 Internal Free-Free Absorption
Figure 8 shows the azimuthally averaged profile of the observed 8.4 GHz emission from SN1993J (solid line) plotted with the profile of the best fit model simulation at approximately the same age (dashed line). The diameter and width of the bright ring of emission in the observed and synthetic images are very similar. However the ratio of the surface brightness at the center of the image and at the brightest point on the ring is significantly smaller in the observed data than in the simulated images. The most likely reason for this difference is that internal free-free absorption, i.e. free-free absorption occurring within the SN, has not been included in our simulations. For the first tens of years the temperatures and densities internal to the reverse shock are such that most, if not all, the emission that passes through the interior is absorbed, significantly decreasing the surface brightness seen from the center of the SN. The dotted line in Figure 8 shows the surface brightness profile of the simulated image when internal free-free absorption is included. It matches the observed profile well, lying within the RMS scatter at all radii, and we conclude that internal free-free absorption is important in SN1993J. Figure 9 shows the comparison of the simulated 8.4 GHz light curves for SN1993J with and without internal free-free absorption. For the the first 8 or so years the light curves have a similar shape, not changing our conclusions in the previous sections of this paper. After year 8 there is a slight flattening in the light curve until year 55 as the internal free-free absorption becomes unimportant due to the decrease in the density inside the reverse shock as the SN expands. During this time (starting at around the present epoch) the ratio of the surface brightness at the center of the SN to that at the peak of the bright ring of the simulated SN increases steadily, and we therefore expect the same to occur in the VLBI images of SN1993J. At higher frequencies the internal free-free absorption becomes unimportant at earlier epochs. These conclusions and predictions regarding the internal free-free absorption are independent of the assumptions used to calculate the synchrotron radiation. If the surface brightness ratio does not increase as predicted, this has implications for the internal density and temperature of the SN.

If other RSNe have a similar level of internal free-free absorption to that implied for SN1993J, radio emission from an embedded pulsar would be completely absorbed until the SN ejecta have expanded sufficiently for the internal free-free optical depth to become negligible. Our model for SN1993J suggests that the optical depth at 1 GHz falls to unity around 150 years (50 years for 8.4 GHz) after the explosion. Detection of a radio pulsar embedded in a similar nearby SN would be impossible before that time. For most extragalactic SN this is a moot point since radio pulsars at extragalactic distances are unlikely to be detectable even if not absorbed. Modeling the radio plerion created by the pulsar, Reynolds & Chevalier (1984) also predict that one could not observe a pulsar for 200 years at radio frequencies due to internal free-free absorption.
5 Discussion and conclusions
Our results indicate the viability of the calculation of supernova radio emission from high-resolution hydrodynamical simulations. The calculations presented in this paper retain much of the essential physics of the mini-shell model, particularly the connection between the model parameters and physical parameters describing the shock, the magnetic field, and the radiating electron distribution. When the ejecta and the CSM have simple power-law density profiles our generalized treatment reproduces the results of the analytic self-similar model. The advantage of our new method is that it provides a means to calculate the radio emission in cases where the expansion in not self-similar, which we demonstrate with calculations for an ejecta model for SN1993J which has a complicated profile motivated by detailed modeling of the optical and x-ray emission.
Attempts to fit the observed time and frequency dependence of the radio emission from SN1993J, which is not well modeled by the analytic mini-shell, are encouraging but not yet completely successful. Fits to the evolving radio flux density of SN1993J at a single frequency indicate that neither synchrotron self-absorption nor free-free absorption alone can produce the observed increase, but that when both effects are included the rise in the flux density can be well modeled for a range of parameters. This conclusion reinforces the results of Fransson & Björnsson (1998) and Chevalier (1998) who argued that both synchrotron self-absorption and free-free absorption were important for SN1993J. Most other RSNe first become detectable at much later epochs than did SN1993J, and their subsequent radio evolution can be fitted adequately using only free-free absorption. This may be because in other SNe the conditions are such that the optical depth due to synchrotron self-absorption is negligible by the time the free-free optical depth through the CSM becomes small enough for the SN to be observed. An alternative is that the sparse sampling of the optically-thick increase of most RSNe simply precludes a determination of the relative importance of synchrotron self-absorption and free-free absorption, as shown in the SN1980K model fits of §4.1.
Our simulations show that the different absorption mechanisms produce quite different spatial surface brightness distributions at very early epochs. They also show that features in the radio light curves of SNe may result from the interaction of density structures in the supernova ejecta with the reverse supernova shock. Such interactions may be detectable through visible signatures in the simulated images, such as a brightening at one edge of the ring of radio emission. VLBI imaging to date does not have sufficient resolution to reveal such effects, but they may prove fruitful goals for future studies. However comparison of the profiles of VLBI images of SN1993J at 8.4 GHz (Bartel et al., 2000) with our simulated images implies that internal free-free absorption is important now and will remain so for a few tens of years. We predict that the ratio of the surface brightness at the center of the SN to that at the bright ring should increase, starting at about the present epoch, due to the gradual decrease of the internal free-free absorption as the SN expands. A similar level of internal free-free absorption in a nearby SN would absorb the emission from an embedded radio pulsar, rendering it undetectable at 1 GHz until around 150 years after explosion.
The relatively slow decline of the SN1993J flux density at a given frequency may indicate that the magnetic field in the emitting region declines more slowly than the scaling with thermal energy density implies (e.g. Chevalier 1998), or that the density of the CSM encountered by the expanding supernova shock to date declines more slowly than the dependence expected for a constant wind. We find a good fit for the latter case with . A density distribution less steep than has also been proposed by a number of other researchers (Suzuki & Nomoto, 1995; Fransson et al., 1996; Van Dyk et al., 1998). Such a dependence could result from a time variation in the mass-loss rate of the wind emitted by the pre-SN progenitor star, or a variation in the wind velocity, or both. If the wind was steady during an earlier phase of evolution of the progenitor, then at some distance further away from the star one would expect the CSM density distribution to revert to an profile. Suzuki & Nomoto (1995) and Fransson et al. (1996) suggest that, in order to match the X-ray and optical light curves and spectra, the density distribution must change close to the star, within a radius of about 1016 cm. However, there is no break in the radio light curves at an early stage that would indicate a sudden change in the density distribution, and in our simulations we assume that the initial CSM density distribution persists throughout the evolution.
Finally, we find that the generalization of the mini-shell model which results from a realistic treatment of the hydrodynamics is insufficient to account for the observed evolution and flux density dependence of SN1993J. The link between the frequency and time dependencies of the model flux density due to the assumed energy density scalings remains implicit in the implementation of the generalized model used here, which therefore doesn’t have sufficient flexibility to fit the data. The inclusion of any one of a number of aspects of the physics which is not addressed by the model as presented here may break this nexus. An obvious next step is to investigate alternative scalings for the magnetic field and/or the relativistic electron distribution (see for example Chevalier 1996 and Chevalier 1998). An alternative we are presently pursuing is to include a physically-justifiable calculation of the time-dependent acceleration of the radiating electrons resulting from the calculated evolution of the expanding supernova shock, along the lines of the treatment by Duffy, Ball, & Kirk (1995).
References
- Bartel et al. (2000) Bartel, N., et al. 2000, Sci, 287, 112
- Chevalier (1982a) Chevalier, R. A. 1982a, ApJ, 258, 790
- Chevalier (1982b) Chevalier, R. A. 1982b, ApJ, 259, 302
- Chevalier (1984) Chevalier, R. A. 1984, Ann. NY. Acad. Sci., 422, 215
- Chevalier (1986) Chevalier, R. A. 1996, in Radio Emission from the Stars & the Sun, ASP Conf. Series Vol 93, eds. A. R. Taylor & J. M. Parades, (San Francisco, ASP), 125
- Chevalier (1998) Chevalier, R. A. 1998, ApJ, 499, 810
- Chevalier & Dwarkadas (1995) Chevalier, R. A., & Dwarkadas, V. V., 1995, ApJ, 452, L45
- Colella & Woodward (1984) Colella, P., & Woodward, P. R. 1984, J. Comp. Phy., 59, 264
- Duffy, Ball, & Kirk (1995) Duffy, P., Ball, L., & Kirk, J. G. 1995, ApJ, 447, 364
- Fransson et al. (1996) Fransson, C., Lundqvist, P., & Chevalier, R. A. 1996, ApJ, 461, 993
- Fransson & Björnsson (1998) Fransson, C., & Björnsson, C-I. 1998, ApJ, 509, 861
- Freedman et al. (1994) Freedman, W. L., et al. 1994, ApJ, 427, 628
- Gottesman et al. (1972) Gottesman, S. T., Broderick, J. J., Brown, R. L., Balick, B., & Palmer, P. 1972, ApJ, 174, 383
- Höflich, Langer & Duschinger (1993) Höflich, P., Langer, N., & Duschinger, M. 1993, A&A, 275, L29
- Iwamoto et al. (1997) Iwamoto, K., Young, T. R., Nakasato, N., Shigeyama, T., Nomoto, K., Hachisu, I., & Saio, H. 1997, ApJ, 477, 865
- Jun & Jones (1999) Jun, B.-I., & Jones, T. W. 1999, ApJ, 511, 774
- Koyama et al. (1995) Koyama, K., Petre, R., Gotthelf, E. V., Hwang, U., Matsura, M., Ozaki, M., & Holt, S. S. 1995, Nature, 378, 255
- Lang (1980) Lang, K. R. 1980, Astrophysical Formulae (Berlin: Springer-Verlag)
- Lundqvist & Fransson (1988) Lundqvist, P., & Fransson, C. 1988, A&A, 192, 221
- Marcaide et al. (1997) Marcaide, J. M., et al. 1997, ApJ, 486, 31
- Marscher (1985) Marscher, A. P., 1985, in Supernovae as Distance Indicators, ed. N. Bartel (Berlin:Springer), 130
- Mioduszewski, Hughes, & Duncan (1997) Mioduszewski, A. J., Hughes, P. A., & Duncan, G. C. 1997, ApJ, 476, 649
- Montes et al. (1998) Montes, M. J., Van Dyk, S. D., Weiler, K. W., Sramek, R. A., & Panagia, N. 1998, ApJ, 506, 874
- Montes et al. (2000) Montes, M. J., Weiler, K. W., Van Dyk, S. D., Panagia, N., Lacey, C. K., Sramek, R. A., & Park, R. 2000, ApJ, 532, 1124
- Nadyozhin (1985) Nadyozhin, D. K. 1985, Ap&SS, 112, 225
- Nomoto et al. (1998) Nomoto, K., & Suzuki, T. 1998, IAU Symp. 188: The Hot Universe, eds. K. Koyama, S. Kitamoto & M. Itoh (Dordrecht: Kluwer), 27
- Panagia et al. (1999) Panagia, N., Weiler, K. W., Montes, M. J., Van Dyk, S. D., & Sramek, R. A. 1999, STScI Symp. Ser.12: Unsolved Problems in Stellar Evolution, ed. M. Livio, (Baltimore: STScI), 57
- Podsiadlowski et al. (1993) Podsiadlowski, P., Hsu, J. J. L., Joss, P. C., & Ross, R. R. 1993, Nature, 364, 509
- Reynolds & Chevalier (1984) Reynolds, S. P. & Chevalier, R. A. 1984, ApJ, 278, 630
- Rybicki & Lightman (1979) Rybicki, G. B., & Lightman, A. P. 1979, Radiative processes in astrophysics (New York: Wiley)
- Suzuki & Nomoto (1995) Suzuki, T., & Nomoto, K. 1995, ApJ, 455, 658 Univ., 11, 51
- Van Dyk et al. (1994a) Van Dyk, S., et al. 1994a, in Circumstellar Media in the Late Stages of Stellar Evolution, eds R. E. S. Clegg, I. R. Stevens & W. P. S. Meikle, (Cambridge: CUP), 112
- Van Dyk et al. (1994b) Van Dyk, S., Weiler, K. W., Sramek, R. A., Rupen, M. P., & Panagia, N. 1994b, ApJ, 432, L115
- Van Dyk et al. (1998) Van Dyk, S., Sramek, R. A., Weiler, K. W., Montes, M. J., & Panagia, N. 1998, ASP Conf. Ser. 144: IAU Colloquium 164: Radio Emission from Galactic and Extragalactic Compact Sources, eds. J. A. Zensus, G. B. Taylor & J. M. Wrobel, (San Francisco: ASP), 357
- Weiler et al. (1986) Weiler, K. W., Sramek, R. A., Panagia, N., van der Hulst, J. M., & Salvati, M. 1986, ApJ, 301, 790
- Weiler et al. (1992) Weiler, K. W., Van Dyk, S. D., Panagia, N., & Sramek, R. A. 1992, ApJ, 398, 248
- Weiler, Sramek & Pangia (1996) Weiler, K. W, Sramek, R. A., & Panagia, N. 1996, IAU Colloq. 145: Supernovae and Supernova Remnants, eds. D. McCray & Z. Wang, (Cambridge: CUP), 283
- Woosley et al. (1994) Woosley, S. E., Eastman, R. G., Weaver, T. A., & Pinto, P. A. 1994, ApJ, 429, 300