The Afterglow and the Host Galaxy of the Dark Burst GRB 970828 111Partially based on the observations obtained at the W. M. Keck Observatory which is operated by the California Association for Research in Astronomy, a scientific partnership among California Institute of Technology, the University of California and the National Aeronautics and Space Administration.
Abstract
GRB 970828 was the first well-localized -ray burst (GRB) X-ray afterglow for which no optical afterglow was found despite a prompt, deep search down to mag. We report the discovery of a short-lived radio flare within the X-ray localization error circle of this burst. Such radio flares are seen in about 25% of GRB afterglows and their origin is not well understood. The precise radio position enabled us to identify the likely host galaxy of this burst, and to measure its redshift, . The host appears to be an interacting/merging system. Under the assumption that the X-ray afterglow is mainly due to synchrotron mechanism we infer the optical afterglow flux. The observed upper limits to the optical flux are easily explained by invoking an intervening dusty cloud within the host galaxy. These observations support the idea that GRBs with no detectable optical afterglows or “dark GRBs” can be due to dust extinction within the host galaxies. The census of dark GRBs can then be used to constrain the fraction of the obscured star formation in the universe. We argue that the existing data already indicate that the obscured star-formation rate is no more than 1/2 of that seen at UV and optical wavelengths.
1 Introduction
Studies of -ray bursts (GRBs) are now one of the most active areas of research in astronomy. After many years of speculation based on a limited observational evidence, the field has been revolutionized by the discovery of long-lived and precisely located afterglows at longer wavelengths, in the X-rays (Costa et al. 1997), optical (van Paradijs et al. (1997)), and radio (Frail et al. 1997), and the resulting determination of the cosmological distance scale to the bursts (Metzger et al. 1997). The arcminute localizations that are so essential to further progress have been provided by the BeppoSAX satellite (Piro (2000)) and the Rossi X-ray Timing Explorer (RXTE) satellite (Smith et al. (1999)). Recently the Interplanetary Network (IPN) has started contributing a significant number of precise and rapid localizations (Hurley et al. (2000)). New space missions and observational advances from the ground promise to extend this exciting track of discovery. For a recent review of observational results, see, e.g., van Paradijs, Kouveliotou & Wijers (2000) and Kulkarni et al. (2000).
Given the importance of afterglows for our growing understanding of the GRB phenomenon, nearly every reported X-ray transient (XT) position has been intensively followed up by ground-based facilities. In some cases bad weather or other such factors prevented adequate optical observations of the XT error boxes. However, by our accounting, in about one third of all well-localized XT cases, no optical transient (OT) was discovered despite prompt and substantial efforts. The non-detection of optical afterglows for well-localized events could be reasonably attributed to any of the following reasons: () a slow response (delay of many days), perhaps coupled with a steeply declining light curve; () a relatively shallow follow-up (e.g., GRB 960720, GRB 970111, GRB 970616); () location in the obscured and/or crowded direction of the Galactic plane (e.g., GRB 970402); or () a relatively large error box (e.g., GRB 970616). If none of these explanations for a non-detection of an optical afterglow is viable, some physical reason must be responsible. We will refer to GRBs without an optical afterglow brighter than about mag found within at most 2 days of the event as “dark GRBs”. While this definition is somewhat arbitrary, it is practical, based on our experience and that of the community involved in the identification and follow-up of GRB optical afterglows.
One possible explanation for such dark bursts is obscuration by dust along the line of sight, most likely in its host galaxy (Groot et al. (1998)). This would suppress the detection of an optical/UV afterglow, but would not significantly diminish the X-ray afterglow, and certainly not affect the detectability of a radio afterglow. This idea received some observational support with the discovery of a bright radio afterglow (Taylor et al. (1998)) from GRB 980329 from which subsequently a highly reddened optical/IR afterglow was identified (e.g., Palazzi et al. 1998). If GRBs are related to the endpoints evolution of massive stars, as envisioned in the currently popular models, then at least some of them are expected to originate from within dusty star-forming regions. Thus, dark GRBs are expected to occur, and their fraction provides an indirect, but valuable clue to the nature of their progenitors.
GRB 970828 was the first clear example of a dark GRB. The GRB was detected and well localized by the All-Sky Monitor aboard XTE (Remillard et al. (1997)). Prompt and deep searches failed to identify the optical afterglow (Odewahn et al. (1997), Groot et al. (1998)). Further progress in understanding of GRB 970828 was stymied by the lack of an afterglow at either optical or radio wavelengths.
In fact, we detected a weak radio flare from GRB 970828 but had failed to appreciate its significance at the time. A significant subsequent development was the discovery of a radio flare from GRB 990123 (Kulkarni et al. (1999)). Sari & Piran (1999) attributed this emission to the ejecta re-heated by the short-lived reverse shock. Similar short-lived (duration of less than a few days) radio flares, distinct from the long-lived (weeks to months) radio afterglows, have been seen in several GRBs.
The Japanese X-ray satellite ASCA carried out rapid observations of GRB 970828 and found a prominent flare about 1.4 d after the burst (Yoshida et al. (1999)). The flare appeared to exhibit a feature in its spectrum at about 5 keV. GRB 970508 also underwent a flare during which a similar feature was identified, and Piro et al. (1999) interpreted it as the Fe line at the redshift of the host galaxy (Bloom et al. (1998)). If the feature seen in the X-ray spectrum of GRB 970828 is interpreted similarly, its redshift would be (Yoshida et al. (1999)).
In this paper we present the radio observations of GRB 970828 and argue that the short-lived transient in the tight ROSAT localization (Greiner et al. (1997)) of GRB 970828 was a radio flare from GRB 970828. Its sub-arcsecond localization enabled us to identify a host galaxy and obtain its redshift, , which forces us to reevaluate the interpretation of the X-ray feature detected by ASCA. The optical observations support the suggestion that GRB 970828 was optically dark, most likely due to dust extinction within the host galaxy.
The organization of this paper as follows. The radio and optical observations are presented in §2. The morphology and the physical properties of the host galaxy are discussed in §3. In §4 we investigate the physical parameters of the region causing optical extinction along the line of sight to the GRB. The ramifications of our findings to the understanding of the X-ray observations (flare, spectroscopic feature) are discussed in §5. We conclude in §6.
2 Observations and Results
GRB 970828 was discovered by the All Sky Monitor (ASM) aboard RXTE on 1997 August 28.74 UT, with a duration of approximately 160 sec in the 2–12 keV energy band (Remillard et al. (1997)). Thanks to the prompt dissemination of the initial localization, a number of missions were able to carry out rapid follow up observations. The afterglow position was further constrained by ASCA observations (Yoshida et al. (1999)) to an error circle with a diameter of 1 arcminute, and then finally reduced by High Resolution Imager (HRI) observations on the ROSAT satellite (Greiner et al. (1997)) to a circle with 10′′ radius and centered on = and = (J2000).
We observed the burst position at radio wavelengths with the Very Large Array (VLA) starting 3.5 hours after the initial -ray burst. All observations were made with full Stokes parameters, using the entire 100 MHz bandwidth which is available. The interferometer phase was calibrated using the nearby point source J1756+578 or J1810+567 and the flux scale was tied to either one of the sources J0137+331, J0542+498, or J1331+305. A log of the VLA observations and a summary of the results can be found in Table 1.
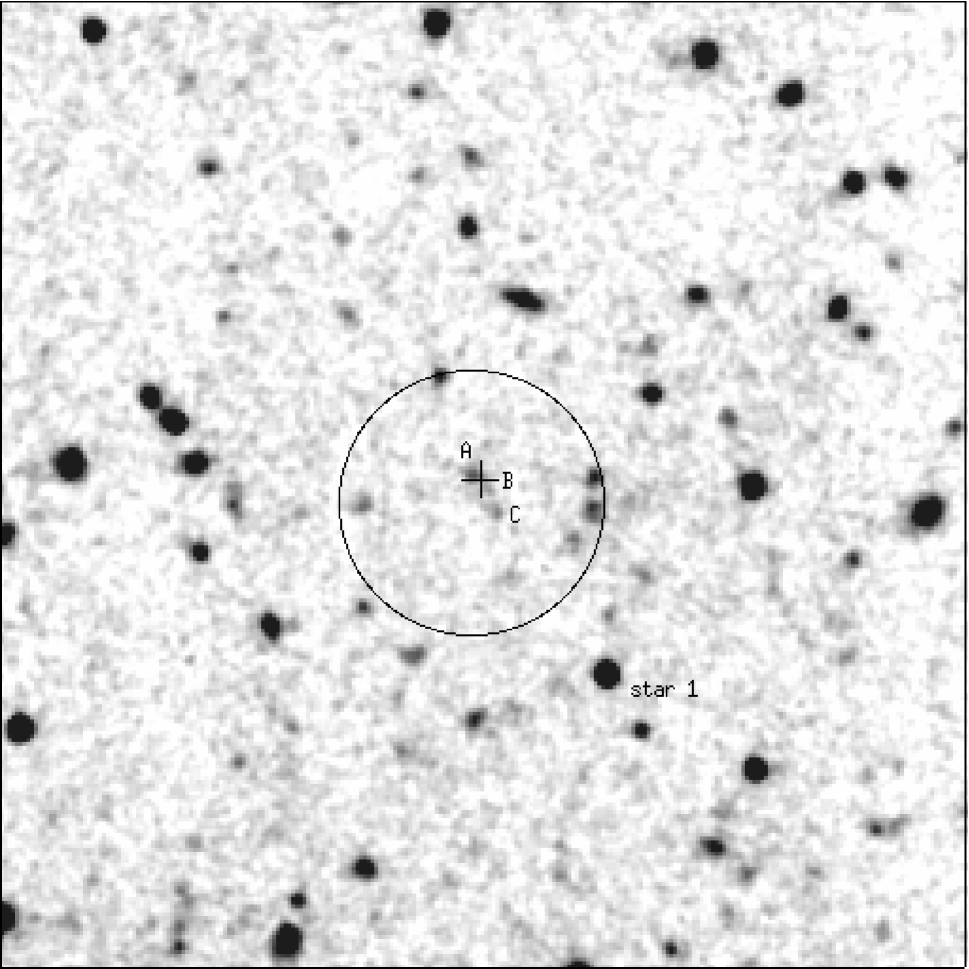
On 1997 September 1 UT a radio source at a significance of 4.5- level was detected at 8.46 GHz within the 10′′ radius ROSAT error circle, as shown in Figure 1. The coordinates of this radio source, hereafter VLA J180831.6591851 are: = , = (J2000; 1- errors).
To verify that this source is real and not a noise fluctuation we carried out a number of tests. We subdivided the datasets by time intervals, by hands of circular polarization and by the two Intermediate Frequency (IF) channels. The source persists in each of these sub-divided datasets. So we conclude that VLA J180831.6591851 is a real source. The transient nature of VLA J180831.6591851 is readily apparent (see Table 1), since it is not detected prior to this time nor in subsequent observations. Possible exceptions to this are the 2.2 fluctuations at 8.46 GHz on 1997 September 3 and 1997 November 3 UT.
As discussed in §1 a similar transient emission was observed from the position of GRB 990123 (Kulkarni et al. (1999)). By our accounting, such radio flares (with or without the subsequent longer lived radio afterglow) are seen in about 25% of well studied GRBs. Given this and the fact that the transient radio source lies within the compact (10-arcsecond) ROSAT error circle give us confidence to suggest that the transient radio emission is from GRB 970828. If so, we have localized this GRB to the sub-arcsecond position.
Our initial deep optical imaging of the RXTE error-box was done on 1997 August 29 UT, by T. Herter, O. Pevunova, F. Fang, and K. Xu, and on 1997 August 30, 31, and September 1 UT, by C. Steidel, K. Adelberger, and M. Kellog, at the Palomar 200-inch Hale telescope, in excellent conditions. Our first observation was conducted 10 hours after the burst and subsequent three observations were conducted at epochs 34, 58 and 82 hours. Multiple CCD images were obtained every night in the band, using the COSMIC (Kells et al. (1998)) prime-focus imager, with limiting magnitudes reaching mag. Figure 2 shows a portion of the field, with the positions of VLA and ROSAT sources indicated.
No significant variable sources changing by more than 0.2 mag/day were found at either the VLA position or over the entire ROSAT error circle down to the effective limiting magnitude mag in these images (Odewahn et al. (1997)). Other groups, in particular Groot et al. (1998), reported limits on variable objects from less deep observations in this time interval, which are consistent with the deeper Palomar measurements. This placed a strong limit on any optical transient associated with GRB 970828, giving it one of the highest -ray or X-ray to optical apparent flux ratios to date.
Preliminary astrometric solutions were obtained using positions of 12 to 15 USNO-A1.0 stars. We found that the RT was located roughly between what appeared as a close pair of faint galaxies (subsequently found to be a triplet in superior Keck images; see below).
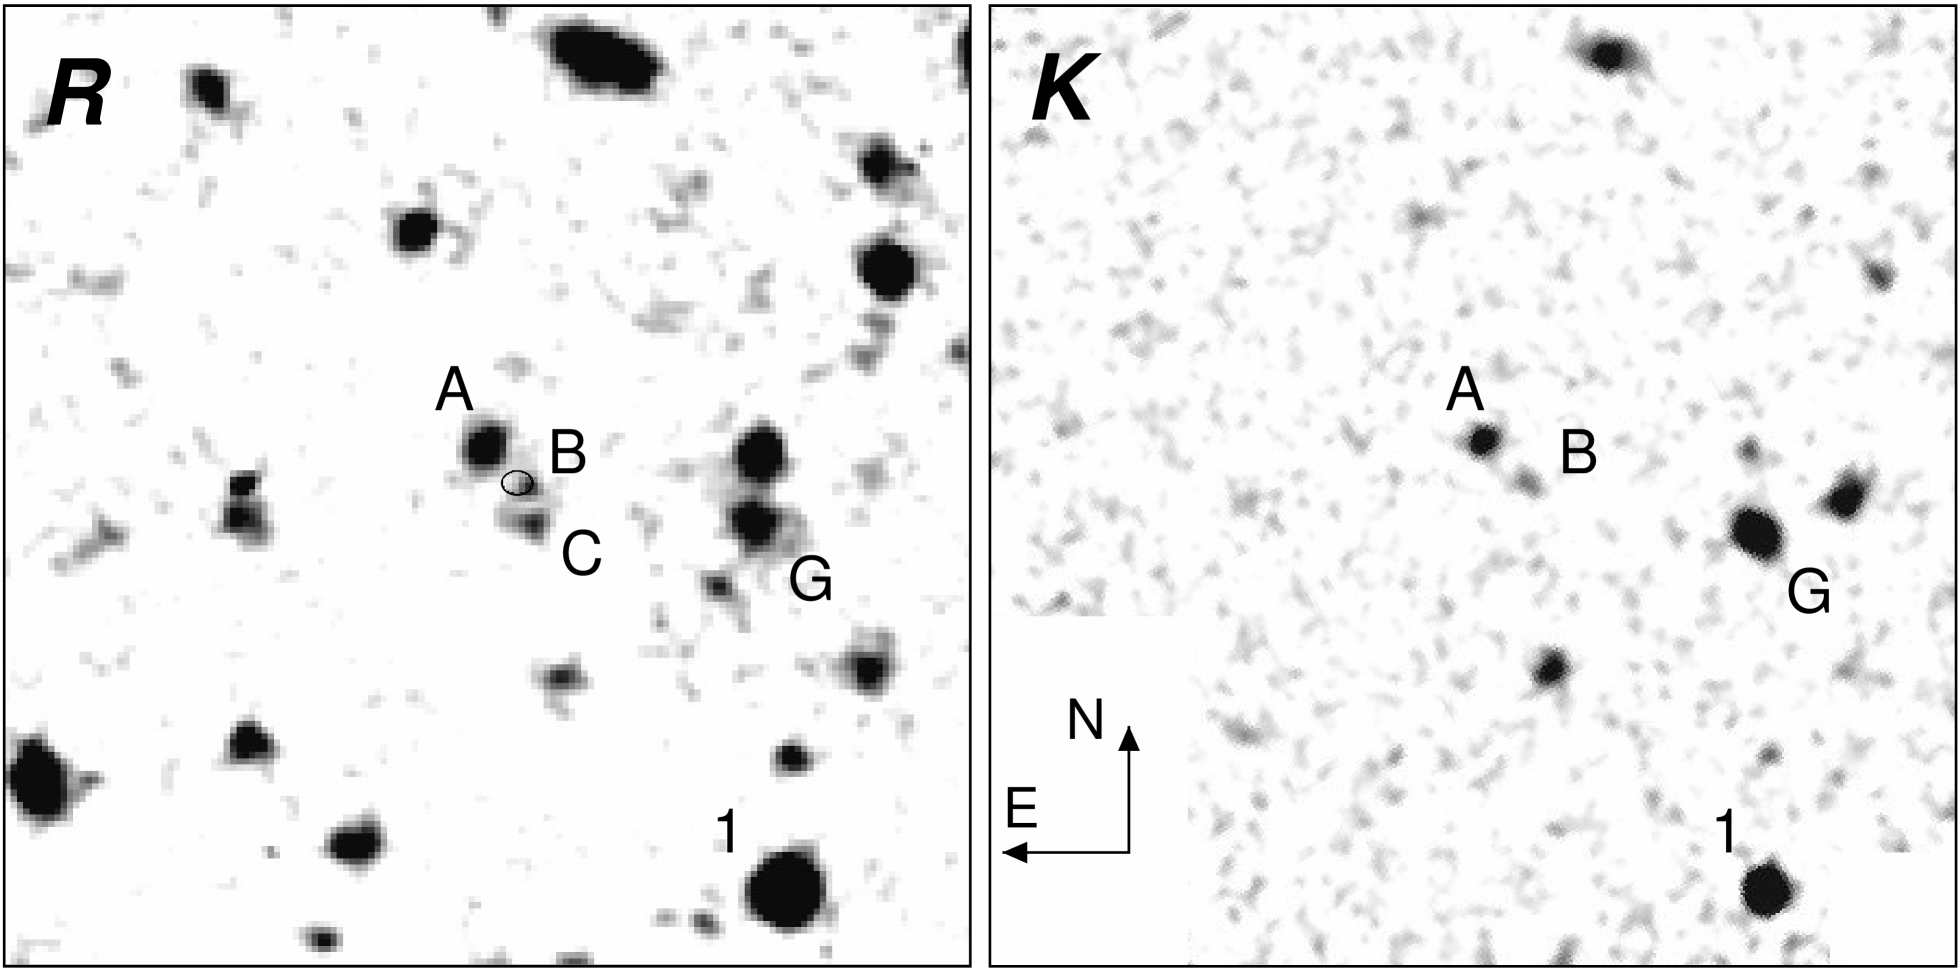
Subsequent deep images of the field were obtained using the LRIS instrument (Oke et al. (1995)) at the W. M. Keck 10-m telescope on Mauna Kea, Hawaii, on 1997 November 1, 1998 July 18, and 1999 April 12 and 14 UT. Multiple CCD exposures ranging from 300 sec to 600 sec were obtained in the band, most of them in good photometric conditions. Exposures of Landolt (1992) standard fields were used for magnitude zero-point calibrations. A portion of the field is shown in Figure 3. The proposed optical counterpart is now clearly resolved into three components, which we designate A, B, and C, with the brightest component (A) corresponding to the original Palomar ID.
An astrometric plate solution of the Keck image was performed using 22 USNO-A2.0 stars (Monet et al. (2000)). Many of the USNO astrometric stars were saturated in our shortest Keck exposures but the centroiding is not grossly affected. The r.m.s. errors of the solution are and arcsec. The J2000 positions of the three galaxy components are:
with an additional centering uncertainty of arcsec in both coordinates.
The band magnitudes of the three components measured in a 1.2 arcsec aperture are mag (A), mag (B), and (C), with the errors dominated by an unknown color term correction and aperture correction uncertainties.
To find the total uncertainty of radio source position on the optical image, we added in quadrature the statistical uncertainties from our astrometric solution, the statistical uncertainty of the radio position (see above), and the 0.25 arcsec statistical uncertainty of the USNO-A2.0 to the International Coordinate Reference Frame (ICRF; Deutsch (1999)). The net total uncertainty is arcsec and arcsec. The offset of the RT from the closest galaxy component (B) is then: arcsec and arcsec, corresponding to a radial offset of arcsec. The probability distribution of radial offset is approximately characterized by a Rice distribution with arcsec (see Bloom, Kulkarni & Djorgovski 2001).
The central galaxy component (B) now appears as the more likely host of the RT. However, it is intriguing that the VLA source may be located the two optical peaks. We are inclined to believe that the gap separating A and B is actually a dust lane intersecting a single galaxy, which would then naturally account for the non-detection of an OT form this burst. However, as pointed by the referee, several GRB host galaxies (e.g. 990506, 991216) which exhibited irregular/complicated morphology have been resolved by HST into distinct galaxies. Thus we cannot exclude the possibility that the GRB is located between a pair of closely interacting galaxies. We eagerly await Hubble Space Telescope imaging data to resolve this morphological ambiguity.
We observed the field of GRB 970828 with NIRC (Matthews & Soifer (1994)) on the Keck I 10-m Telescope on 1998 September 6 UT. A total of 3200 seconds of -band integration was obtained in arcsec seeing and in photometric conditions. We observed the IR standard star SJ9101 (Persson et al. (1998)) about 2.5 hours after the GRB observations in order to find a photometric zero-point. In the final reduced image (Fig. 3) galaxies A and B are well detected, but galaxy C is not. We placed a 0.64 arcsec radius aperture about the centroid of galaxies A and B and star 1, and applied suitable aperture corrections. This yields measurements of mag for galaxy A, mag for galaxy B, and mag for star 1, with the errors dominated by the estimated uncertainty of the aperture correction. The mag color for galaxies A and B is moderately red in comparison to a general field galaxy population at comparable magnitudes, consistent with some intrinsic reddening.
The initial spectroscopic observations of galaxy component A were obtained using LRIS on 1998 July 19 UT (exposure sec), using a low-resolution grating with 300 lines/mm and a 1.5-arcsec wide slit, giving the spectroscopic resolution Å. The slit PA was , and thus did not include components B and C. Subsequent spectroscopic observations were obtained with LRIS on 1998 August 23 ( sec), 1999 March 24 ( sec), and 1999 August 13 UT ( sec). On these three dates, a grating with 600 lines/mm was used, giving the spectroscopic resolution Å, and the slit PA was , thus including all three galaxy components (A,B,C).
In all observations, the galaxy was dithered on the spectrograph slit by several arcseconds between the exposures, in order to improve the sky subtraction. Exposures of arc lamps were used for wavelength calibrations, and the residual instrument flexure was corrected using measurements of the night sky lines. The typical net resulting r.m.s. uncertainty is Å for the UT 1998 July 19 data, and Å for the rest. Most exposures were obtained with the slit PA very close to the parallactic angle. Exposures of standard stars from Oke & Gunn (1983) and Massey et al. (1998) were obtained and used for flux calibration. All data were processed using standard techniques.
The observing conditions were mediocre for the 1998 August 23 UT data which resulted in a very weak detection; thus, the data from this night were not used in our analysis. The remaining data were taken in good to excellent conditions, and have been averaged using statistically appropriate S/N-based weighting, after rebinning to a common wavelength grid.
Figure 4 shows the final spectrum of the component A. A strong emission line is seen at Å, which we interpret as the [O II] 3727 doublet, and a weaker emission line at Å, which we interpret as the [Ne III] 3869 line, with a weighted mean redshift . The continuum shape also shows the presence of the 4000 Å break and the Balmer break at this redshift.
The component B is detected only weakly in our 600 lines/mm grating spectra, consistent with the magnitude difference from our direct images. However, the [O II] 3727 line is detected at nearly the same redshift, as shown in Figure 5. A small, but detectable velocity shift is present, corresponding to km s-1 in the restframe, which is consistent with either a velocity field amplitude within a single galaxy, or a velocity difference in a merging pair of galaxies.
The spectrophotometric magnitudes of the component A are: , , and mag, uncertain by mag. For the component B we obtain mag. These numbers are in an excellent agreement with the magnitudes measured in our direct images.
We do not have a significant detection of the component C in our spectroscopic data, consistent with its measured magnitude. It can thus be an unrelated background galaxy, but its proximity makes it more likely to be a part of the same system as the components A and B.
3 Physical Properties of the Host
In what follows we will assume a cosmology with H∘=65 km s-1 Mpc-1, , and . At , the luminosity distance is cm, and 1 arcsec corresponds to 8.53 proper kpc in projection.
The -ray fluence as measured by the Burst and Transient experiment (BATSE) on board the Compton Gamma Ray Observatory was 7 erg cm-2 (Groot et al. (1998)). For our adopted cosmology, this implies an isotropic -ray energy release E erg.
We assume for the foreground Galactic reddening in this direction mag (Finkbeiner, Davis & Schlegel (1999)) corresponding to mag and mag. All fluxes and luminosity-dependent quantities given below have been corrected accordingly. For the spectroscopically determined fluxes, we give only the random errors; we estimate an additional, systematic flux zero-point uncertainty of %.
For the galaxy component A, the [O II] 3727 line flux is erg cm-2 s-1, and the observed line equivalent width is Å. This is fairly typical for the field galaxies in this magnitude and redshift range (Hogg et al. (1998)). The corresponding line luminosity is erg s-1. Using the star formation rate (SFR) estimator from Kennicutt (1998), we derive the SFR yr-1, with a net uncertainty of %.
For the component B, the [O II] 3727 line flux is erg cm-2 s-1, and the observed line equivalent width is Å, consistent with the magnitude difference relative to the component A. The estimated SFR is yr-1.
An alternative way to estimate the SFR is from the UV continuum power at Å (Madau, Pozzetti & Dickinson (1998)). For the component A, the observed flux at the corresponding wavelength Å is Jy, the restframe continuum power is then erg s-1 Hz-1, and the corresponding SFR yr-1, remarkably close to the estimate from the [O II] 3727 line.
We are completely insensitive to any fully obscured components of the SFR, so these relatively modest SFR’s are only lower limits to the true star formation rate.
The shape of a galaxy’s spectrum spectrum contains some information about its (unobscured) star formation history. Figure 6 shows a median-binned spectrum of the component A, along with several dust-free population synthesis model spectra (Bruzual & Charlot (1993)). The models shown illustrate two extreme cases, a constant SFR, and a model where all of the star formation is accomplished in an instantaneous burst. No attempt is made here to fit any models to the data, since there are far too many parameters which can be adjusted; the comparison is meant to be simply illustrative. The constant SFR models which fit the Balmer break overproduce the UV continuum, as does a post-starburst model with the age of 100 Myr after the burst. However, this can probably be fixed with a very modest amount of reddening, and the built-in no extinction assumption of the model is unrealistic in any case. On the other hand, post-starburst model with larger ages does not reproduce the shape of the UV continuum just blueward of the Balmer break. Thus, the observed spectrum is consistent with an actively star forming galaxy or a relatively young post-starburst galaxy with a modest amount of reddening.
Another interesting hint is provided by the presence of the unusually strong [Ne III] 3869 emission line, with a total flux of about one third of the [O II] 3727 line. This points to an unusually hot H II region, ionized by very massive stars. The absence of other prominent emission lines allow us to exclude the presence of a significant hidden AGN. The [Ne III] line has been detected in some other GRB hosts (Bloom et al. (1998); Bloom, Djorgovski & Kulkarni (2000); Djorgovski, Bloom & Kulkarni (2000)) and it provides an indirect clue that GRBs may be connected to massive star formation. Further discussion of this issue will be reported elsewhere.
From the observed continuum flux in the restframe band ( Å, Jy, we derive the restframe absolute magnitude mag for the galaxy component A. This corresponds to a galaxy today.
Perhaps the most intriguing aspect of the host is the overall morphology of the system. It can be interpreted either as an interacting/merging system of two or more galaxies (similar, perhaps, to the host of GRB 980613; see Djorgovski, Bloom & Kulkarni (2000)). Alternatively, it can be interpreted as an advanced merger, with the apparent division between the components A and B being due to a dust lane which may be hiding the true nucleus of the system. In either case, a galaxy interaction is implied, which is not uncommon for this redshift range (see, e.g., Le Fèvre et al. (2000)). Galaxy mergers are known to lead to bursts of star formation, often with highly obscured components. It is then very intriguing that the RT position is consistent with the region between the two brightest visible components of the overall system.
4 The Physical Parameters of the Obscuration, and the Evidence for a Jet
GRB 970828 was a prototypical dark GRB. The detection of a prompt radio flare positionally coincident with its X-ray afterglow enabled us to identify its host galaxy and obtain its redshift. The simplest explanation for the non-detection of an optical afterglow is that it was suppressed due to extinction within the host galaxy. Here we attempt to estimate the physical parameters of this extinction.
We first compute the expected optical flux in the framework of the fireball model. In particular, we assume that the afterglow radiation arises primarily from synchrotron mechanism. We note, other than that for GRB 000926 Harrison et al. (2001), all other afterglows have been well explained within the framework of synchrtoron emission (e.g., Panaitescu & Kumar 2000). Comparing the expected value of the optical flux to the measured upper limits then yield an estimate of the internal extinction.
The basic input to the afterglow model are the X-ray afterglow observations. Following the detection by XTE (Remillard et al. (1997)), the X-ray afterglow was observed by the PCA aboard XTE (Marshall, Cannizzo & Corbet (1997)), ASCA (Yoshida et al. (1999)) and ROSAT (Greiner et al. (1997)). The X-ray fluxes and epochs are respectively, erg cm-2 s-1, 0.16 d; erg cm-2 s-1, 1.97 d; and erg cm-2 s-1, d. The fluxes refer to the 2–10 keV band for the PCA and ASCA but the 0.1–2.4 keV band for ROSAT. However, given the flat spectrum of the afterglow (photon index ; see Yoshida et al. (1999)) distinctions in the band are not critical.
The decay index of the X-ray power-law decay, , is best measured with the ASCA observations which began 1.17 d after the burst. Yoshida et al. (1999) report (excluding the flare at s; see §1 and below). The decay index derived from PCA and ASCA fluxes is , in excellent agreement with the derived from ASCA data analysis. The excellent agreement of the two decay indicies provide strong confirmation of the reality of the flare noted by Yoshida et al. (1999). The decay index appears to steepen by the time ROSAT observations were conducted (epoch, 5–7 d; Greiner et al. 1997) since from ASCA and ROSAT fluxes is . However, over the epoch of greatest interest to optical afterglow observations, 4 hours to 2 days, the relevant is that measured by the PCA and ASCA. We adopt for the duration relevant to optical observations, 4 hours to 4 days.
The fireball model allows us to estimate the optical flux given the X-ray light curve. We assume that the fireball is expanding in constant density medium. This assumption is justified given that all well studied afterglows are better explained by constant ambient density (e.g., Panaitescu & Kumar (2000)). With this assumption, we can safely assume that over the time interval of interest to us (4 hours and longer) the X-ray band lies above the cooling break. In this regime, the X-ray flux is expected to undergo a power-law decay with index (spherical fireball) or (a jet fireball); see Sari, Piran & Halpern (1999). Here, is the power law index of the shocked electrons in the forward shock region. We thus obtain (sphere) and (jet). For all well-studied GRBs to date, appears to be tightly clustered around about 2.4 (e.g., Panaitescu & Kumar (2000)). Thus we conclude that on the timescale of interest (the first 2 days) the afterglow emission was essentially isotropic and that .
The expected optical spectral density at frequency is where is the X-ray spectral density at frequency . From Yoshida et al. (1999) we find Jy (Hz) at d; in deriving we assumed that the photon index of the X-ray afterglow is 2 (see above). Thus the expected optical spectral density is mJy where is the time in days since the GRB event. This translates to 13.5, 14.8, 16.7 and 17.5 mag, respectively at 4 hours, 10 hour, 34 hour and 58 hour after the burst. These predicted optical magnitudes are much brighter than the upper limits of 24.5 mag and require significant local extinction.
However, the extrapolation from the X-ray afterglow to the optical afterglow has two major caveats. We have assumed that the optical density follows the X-ray spectrum and thus with . However, this assumption is true as long as . If then the optical spectral flux density , resulting in a decrease on the estimates with a local minimum for . Second, the optical spectral flux density can only rise to , the maximum flux density – a fundamental parameter of an afterglow in the constant-density model.
Except for the peculiar case of GRB 970508, we know of no firm detection of the afterglow rising to a maximum value at any wavelength other than the radio. In all afterglows studied to date, the optical emission is found to decay in a power law manner starting from the earliest detection. Optical observations of GRB 990123 were carried out within 4 hours of the burst (one of the earliest) and even at that time the optical flux had started declining. The typical for the radio afterglow is days to weeks and this would imply s – in agreement with the observations. If we accept that the epoch at which the optical emission, is well below a day then mJy.
A Jet? So far, we have assumed the fireball emission is isotropic. We justified this assumption by noting that a jet model yields too small a value for . However, there is now a growing evidence that many GRB afterglows have a jet-like geometry. In this respect, we note the gradual steepening of from (epoch 4 hours to 2 days) to (based on flux measurements between 2 d and 6 d after the burst). Thus the afterglow appears to be gradually developing evidence of a jet. A fit to the X-ray light curve was made employing the functional form in Harrison et al. (1999), keeping and , and we derived a jet break time days, similar to other jet breaks (e.g. 990510; Harrison et al. 1999).
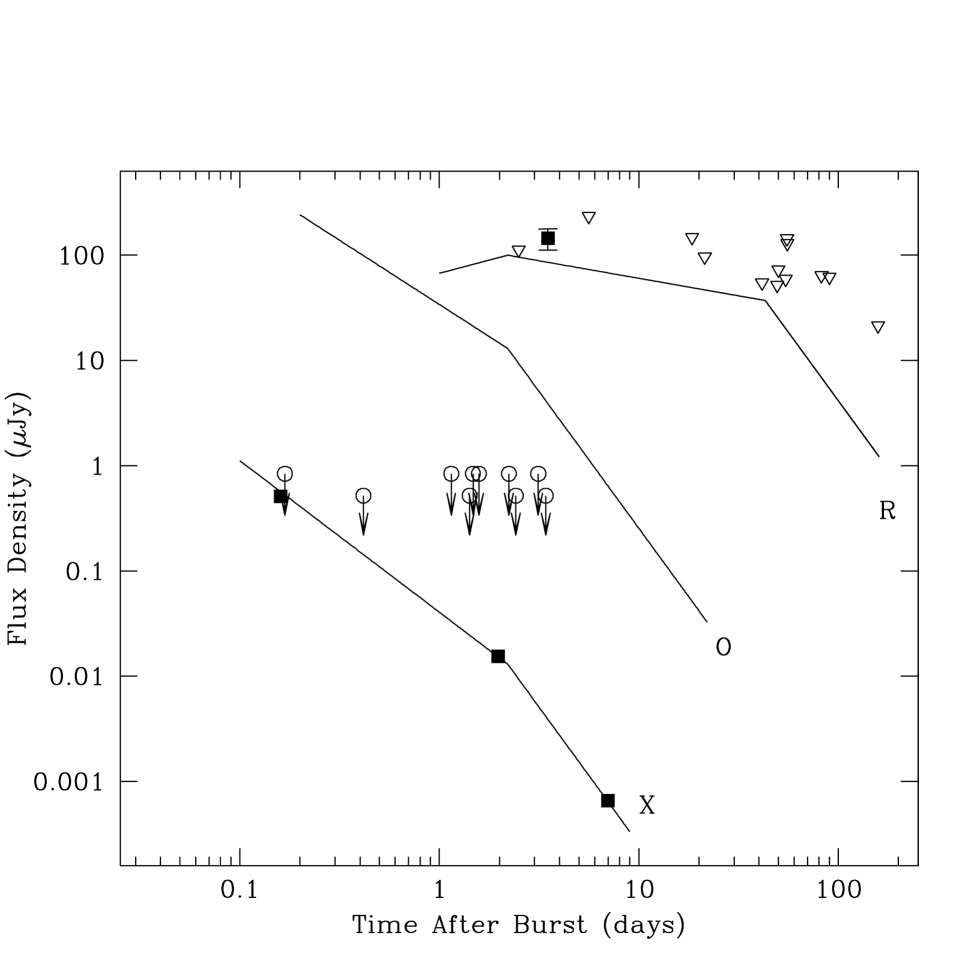
The development of the jet explains why we did not see a bright radio afterglow. In the constant-density fireball model, is independent of frequency and we would expect to see the radio afterglow peak to on a timescale of days to weeks. As the fireball expands laterally the afterglow emission is weakened and the radio emission (relative to a spherical model) suppressed. As can be seen from Table 1 and Figure 7 there is no sign of radio afterglow. The afterglow of GRB 970828 bears a considerable similarity to that of GRB 990123: a strong radio flare, a weak radio afterglow, an afterglow emission whose decay index gradually steepened on the timescale of a few days. It is this similarity which gives some confidence in our simple afterglow model for GRB 970828.
Expected Optical Emission. We now have sufficient information to make predictions for the minimum expected optical flux given the X-ray detection, and the radio upper limits. The afterglow model in Figure 7 adopts a jet break time at 2.2 days, p=2.6, and at the time of the first X-ray measurement. This predicts 17.5, 18.7, 20.3 and 21.2 mag, respectively at 4 hour, 10 hour, 34 hour and 58 hour after the burst. Thus even adopting this conservative set of assumptions, we require significant intervening extinction, mag. We specifically note the conservative assumption of ; if the cooling frequency were below the optical band then the predicted optical fluxes would be higher. In other well studied bursts, the cooling frequency is below the optical band at such late times. Also, for the purpose of the discussion here, i.e., the absence of the optical afterglow, the geometry of the fireball is not critical: at the epochs of interest, within the first day, spherical fireball approximation and are excellent assumptions.
In summary, there is no optical afterglow detected down to about mag (or fainter) between 4 hours and 4 nights from GRB 970828. During this period, based on X-ray and radio observations, we expect a minimum of mJy or about mag. The deficit would require mag. At the redshift of the host, central wavelength of the band corresponds to Å. Assuming an extinction curve similar to the standard Milky Way curve, we deduct the restframe extinction mag, and from that the column density of cm-2 in the rest frame of the host galaxy; here we use the symbol “” to indicate that the column density in question was derived from dust extinction. This is a lower limit because our derived is a lower limit. This should be compared to cm-2, the typical column density through Giant Molecular Clouds (GMCs) found in the Milky Way (Solomon et al. (1987)). Thus a single intervening GMC could easily provide the necessary extinction.
5 Interpretation of the X-ray Spectrum of the Afterglow
The X-ray afterglow of GRB 970828 was peculiar in two regards and here we investigate how our measurements can help explain the X-ray observations.
X-ray Line Feature. Yoshida et al. (1999) found that the X-ray afterglow of GRB 970828 exhibited a strong flare at 1.25 d lasting only 2 hours. During this period the flux doubled up and the spectrum exhibited a feature at keV. Yoshida et al. (1999) identified this with Fe Kα line at .
Given our unambiguous measurement of the redshift, , this identification is no longer tenable. Spurred by our measurement of the redshift of the host galaxy, several authors (e.g., Weth et al. (2000), Yoshida et al.Yoshida et al. (2001)) have suggested that this feature is instead the Fe edge (restframe energy 9.28 keV) which would appear at 4.74 keV at a redshift of 0.9578 – consistent with the centroid of the feature as measured in the ASCA spectrum. However, as has also been noted, this identification is not without problems since the Fe K-edge apparently is not accompanied by Fe Kα line feature (at about 3.3–3.55 keV in the observer’s frame).
X-ray Extinction. Extinction can also be measured via absorption of low energy X-rays. At moderate to high column densities under discussion, the X-ray absorption arises from K- and L-shell edges of oxygen and carbon. This absorption is essentially independent on whether the heavy elements are in gaseous form or locked up in dust. We will refer to the column density inferred through X-ray absorption as . Dust extinction is due to grains whose formation is complicated and certainly involves the refractory elements in a substantial way. More importantly, the size distribution of the extinction curve is sensitive to the size distribution of grains. Since both and depend on the heavy elements, it is usually assumed that the ratio is independent of metallicity.
Thus in principle the ASCA observations should be able to independently demonstrate the existence of a column of gas which has been invoked to explain the lack of optical afterglow. As measured in the observer’s frame, the expected X-ray column density is (Morrison & McCammon (1983)). Thus we expect to find cm-2.
Is there any evidence for an observed column density of about cm-2 in the X-ray data? Unfortunately, the data show a complicated behaviour. Yoshida et al. (1999, 2001) noted that immediately following the flare, the inferred column density, shot up to cm-2 (here, we use the values from the 2001 paper). The inferred column density prior to the flare is less than cm-2 (90% confidence limit) which is consistent with the optically derived value.
However, the fact that is not constant with time means that the post-flare that the X-ray absorption does not occur in large intervening structures such as clouds or GMCs and thus it is potentially dangerous to compare and the dust-derived .
Parenthetically, we note that such variable extinction has also been seen in the X-ray afterglow of GRB 970508 (Piro et al. 1999). We suggest that these large and time-variable column densities must arise very close to the GRB i.e. within the exploding object itself and not in the circum-burst or inter-stellar medium.
6 Conclusions
We have detected a short-lived radio source within the tight localization of the X-ray afterglow of GRB 970828. We propose that this radio flare is similar to the flare detected from GRB 990123 and interpreted as arising from a reverse shock. At the position of the radio flare we identify a galaxy with a redshift . Its optical properties (redshift, luminosity, morphology) are broadly similar to the other GRB host galaxies studied to date. Its morphology is suggestive of a merging system, and the GRB may be coincident with a large dust lane intersecting the host.
No optical afterglow associated with this burst was found despite prompt searches and deep limiting magnitudes. In the framework of the simple afterglow theory we are able to compute the expected optical afterglow emission using the X-ray light curve. The failure to detect optical emission is naturally explained as due to intervening dust. An extinction of at least 7.5 mag is necessary in the observed band. We show that a single intervening giant molecular cloud (GMC) would provide the necessary minimum extinction. The GRB’s possible location in a dust lane corroborates the extinction hypothesis.
Using the derived jet break time in §4 we can compute the opening angle of the jet as 0.12(n/1 cm radian (Sari et al. 1999). For a two-sided jet this reduces the isotropic gamma-ray energy of E erg (see §3) by a factor of 140 to 1.4 erg.
The X-ray afterglow from GRB 970828 was quite strong and exhibited a strong flare during which a spectral feature was identified (Yoshida et al. (1999)). A similar flare and line feature phenomenon was seen in the X-ray afterglow of GRB 970508 (Piro et al. (1999)) and the feature was identified with Feα at the redshift of the host galaxy. In the absence of any redshift information, Yoshida et al. had identified the line feature in the afterglow of GRB 970828 with the Fe Kα. However, with our redshift the rest energy of this feature is about keV – consistent with the feature being Fe K-edge, but the absence of an accompanying strong Fe Kα feature is puzzling.
The features seen in these GRBs provided considerable impetus of X-ray spectroscopy of other afterglows. However, we draw attention to the phenomenon of variable in both these afterglows. The increased after the flare is perhaps the most secure evidence to date of the presence of dense material in the vicinity of the GRB.
GRB 970828 may be the best case to date of a “dark” GRB, and our observations and analysis demonstrate that it was highly extincted. About one third of all well-localized GRBs to date are dark, and we suggest that most or all of them are dust-extincted GRBs. This is not surprising, given other evidence linking GRBs to the locations of massive stars (Bloom, Kulkarni & Djorgovski (2000)), which are predominantly found in dusty regions. This opens a possibility of using the GRB afterglow detection statistics to probe the history and the relative fraction of the obscured star formation in the universe.
Gamma-rays can probe the densest molecular clouds and thus GRBs suffer virtually no selection effect unlike the traditional approaches: optical/UV (severely affected by dust) and sub-mm (sensitivity limited). The fraction of dark bursts (1/3) already informs us that the obscured star-formation rate is no more than of that seen at UV and optical wavelengths. This result is entirely independently from the constraints obtained from sub-mm observations and diffuse cosmic backgrounds. Further discussion of this issue will be presented elsewhere.
The main concern in using dark bursts to probe extincted and obscured star formation is the issue of whether GRBs or their afterglows can significantly affect their surroundings. Galama & Wijers (2000) noted that a number of bursts seemingly exhibit large column density as inferred from their X-ray afterglow (i.e., large ) but with little or no optical extinction (as inferred from their optical afterglow, i.e., low ), and following Waxman & Draine (2000) suggest that the GRB destroy grains along the line of sight, thereby making it possible to see optical afterglow. If this picture were correct, then the fraction of dark GRBs could be higher and the dark burst fraction would not provide a stringent constrain on the obscured star-formation fraction.
However, the variable clearly seen in the X-ray afterglow of GRB 970828 (Yoshida et al. 2001) and hinted at for GRB 970508 (Piro et al. 1999) cannot be reconciled with a model in which the X-ray absorption arises out of intervening material such as diffuse clouds or GMCs. Indeed, the rapid variability requires that the X-ray absorption arises very close to the GRB itself i.e. the exploding star itself. If so, does not measure the true intervening column density, unlike . This would then explain why there is no relation between and ; further details of this hypothesis will be discussed elsewhere.
If our argument is correct then the fraction of dark GRBs has already posed the strongest constraint on the total fraction of obscured star formation in the Universe.
References
- Bloom, Djorgovski & Kulkarni (2000) Bloom, J. S., Djorgovski, S. G., and Kulkarni, S. R. 2000, astro-ph/0007244.
- Bloom et al. (1998) Bloom, J. S., Djorgovski, S. G., Kulkarni, S. R., and Frail, D. A. 1998, ApJ, 507, L25.
- Bloom, Kulkarni & Djorgovski (2000) Bloom, J. S., Kulkarni, S. R., and Djorgovski, S. G. 2000, submitted to AJ. astro-ph/0010176.
- Bruzual & Charlot (1993) Bruzual, G. and Charlot, S. 1993, ApJ, 405, 538.
- Costa et al. (1997) Costa, E. et al. 1997, Nature, 387, 783.
- Deutsch (1999) Deutsch, E. W. 1999, AJ, 118, 1882.
- Djorgovski, Bloom & Kulkarni (2000) Djorgovski, S. G., Bloom, J. S., and Kulkarni, S. R. 2000, astro-ph/0008029.
- Finkbeiner, Davis & Schlegel (1999) Finkbeiner, D. P., Davis, M., and Schlegel, D. J. 1999, ApJ, 524, 867.
- (9) Frail, D. A., Kulkarni, S. R., Djorgovski, S. G., Odewahn, S. C., Steidel, C. C., Adelberger, K. L., and Kellog, M. 1997a, IAU Circ, 6730, 1.
- (10) Frail, D. A., Kulkarni, S. R., Nicastro, S. R., Feroci, M., and Taylor, G. B. 1997b, Nature, 389, 261.
- Galama & Wijers (2000) Galama, T. J. and Wijers, R. A. M. J. 2000, submitted to ApJ. astro-ph/0009367.
- Greiner et al. (1997) Greiner, J., Schwarz, R., Englhauser, J., Groot, P. J., and Galama, T. J. 1997, IAU Circ., 6757.
- Groot et al. (1998) Groot, P. J. et al. 1998, ApJ, 493, L27.
- Harrison et al. (1999) Harrison, F. A. et al. 1999, ApJ, 523, L121.
- Harrison et al. (2001) Harrison, F. A. et al. 1999, ApJ (in press).
- Hogg et al. (1998) Hogg, D. W., Cohen, J. G., Blandford, R., and Pahre, M. A. 1998, ApJ, 504, 622.
- Hurley et al. (2000) Hurley, K. et al. 2000, ApJ, 534, L23.
- Kells et al. (1998) Kells, W., Dressler, A., Sivaramakrishnan, A., Carr, D., Koch, E., Epps, H., Hilyard, D., and Pardeilhan, G. 1998, PASP, 110, 1487.
- Kennicut (1998) Kennicut, R. C. 1998, Ann. Rev. Astr. Ap., 36, 131.
- Klose, Eisloeffel & Stecklum (1997) Klose, S., Eisloeffel, J., and Stecklum, B. 1997, IAU Circ, 6756, 2.
- Kulkarni et al. (2000) Kulkarni, S. R. et al. 2000, Proc. SPIE, 4005, 9.
- Kulkarni et al. (1999) Kulkarni, S. R. et al. 1999, ApJ, 522, L97.
- Landolt (1992) Landolt, A. U. 1992, AJ, 104, 372.
- Le Fèvre et al. (2000) Le Fèvre, O. et al. 2000, MNRAS, 311, 565.
- Madau, Pozzetti & Dickinson (1998) Madau, P., Pozzetti, L., and Dickinson, M. 1998, ApJ, 498, 106.
- Marshall, Cannizzo & Corbet (1997) Marshall, F. E., Cannizzo, J. K., and Corbet, R. H. D. 1997, IAU Circ, 6727.
- Massey et al. (1988) Massey, P., Strobel, K., Barnes, J. V., and Anderson, E. 1988, ApJ, 328, 315.
- Matthews & Soifer (1994) Matthews, K. and Soifer, B. T. 1994, Experimental Astronomy, 3, 77.
- Metzger et al. (1997) Metzger, M. R., Djorgovski, S. G., Kulkarni, S. R., Steidel, C. C., Adelberger, K. L., Frail, D. A., Costa, E., and Fronterra, F. 1997, Nature, 387, 879.
- Monet et al. (2000) Monet, D. et al. 2000, USNO-SA2.0, (U.S. Naval Observatory, Washington DC).
- Morrison & McCammon (1983) Morrison, R. and McCammon, D. 1983, ApJ, 270, 119.
- Odewahn et al. (1997) Odewahn, S. C. et al. 1997, IAU Circ, 6735.
- Oke et al. (1995) Oke, J. B. et al. 1995, PASP, 107, 375.
- Oke & Gunn (1983) Oke, J. B. and Gunn, J. E. 1983, ApJ, 266, 713.
- Palazzi et al. (1998) Palazzi, E. et al. 1998, A&A, 336, L95.
- Panaitescu & Kumar (2000) Panaitescu, A. and Kumar, P. 2000, ApJ, 554, 667.
- Persson et al. (1998) Persson, S. E., Murphy, D. C., Krzeminski, W., Roth, M., and Rieke, M. J. 1998, AJ, 116, 2475.
- Piro (2000) Piro, L. 2000, In press, astro-ph/0001436,Proc.s. of X-Ray Astronomy ’99:Stellar Endpoints, AGN and the Diffuse X-ray Background, September 6-10, 1999, CNR Bologna.
- Piro et al. (1999) Piro, L. et al. 1999, ApJ, 514, L73.
- Remillard et al. (1997) Remillard, R., Wood, A., Smith, D., and Levine, A. 1997, IAU Circ, 6726.
- Sari & Piran (1999) Sari, R. and Piran, T. 1999, ApJ, 517, L109.
- Sari, Piran & Halpern (1999) Sari, R., Piran, T., and Halpern, J. P. 1999, ApJ, 519, L17.
- Smith et al. (1999) Smith, D. A. et al. 1999, ApJ, 526, 683.
- Solomon et al. (1987) Solomon, P. M., Rivolo, A. R., Barrett, J., and Yahil, A. 1987, ApJ, 319, 730.
- Taylor et al. (1998) Taylor, G. B., Frail, D. A., Kulkarni, S. R., Shepherd, D. S., Feroci, M., and Frontera, F. 1998, ApJ, 502, L115.
- van Paradijs et al. (1997) van Paradijs, J. et al. 1997, Nature, 386, 686.
- van Paradijs, Kouveliotou & Wijers (2000) van Paradijs, J., Kouveliotou, C., and Wijers, R. 2000, ARA&A in press.
- Waxman & Draine (2000) Waxman, E. & Draine, B. T. 2000, ApJ, 537, 796.
- Weth et al. (2000) Weth, C., Mészáros, P., Kallman, T., and Rees, M. J. 2000, ApJ, 534, 581.
- Yoshida et al. (1999) Yoshida, A., Namiki, M., Otani, C., Kawai, N., Murakami, T., Ueda, Y., Shibata, R., and Uno, S. 1999, A&A 138, 433.
- Yoshida et al. (2001) Yoshida, A. et al. 2001, ApJ (in press).
| Epoch | Freq. | S | ||
|---|---|---|---|---|
| (UT) | (days) | (GHz) | (min) | (Jy/ba) |
| 1997 Aug. 28.88 | 0.1 | 4.86 | 15 | 3 46 |
| 1997 Aug. 31.19 | 2.5 | 4.86 | 46 | 23 27 |
| 1997 Aug. 31.19 | 2.5 | 8.46 | 31 | 37 30 |
| 1997 Sep. 01.27 | 3.5 | 4.86 | 21 | 60 38 |
| 1997 Sep. 01.27 | 3.5 | 8.46 | 21 | 147 33 |
| 1997 Sep. 01.27 | 3.5 | 1.43 | 26 | 28 73 |
| 1997 Sep. 03.36 | 5.6 | 4.86 | 31 | 99 50 |
| 1997 Sep. 03.36 | 5.6 | 8.46 | 22 | 110 50 |
| 1997 Sep. 16.19 | 18.5 | 8.46 | 22 | 65 33 |
| 1997 Sep. 19.11 | 21.4 | 8.46 | 30 | 22 30 |
| 1997 Sep. 23.89 | 26.4 | 4.86 | 23 | 18 40 |
| 1997 Oct. 09.13 | 41.4 | 8.46 | 137 | 20 14 |
| 1997 Oct. 17.06 | 49.3 | 8.46 | 118 | 7 18 |
| 1997 Oct. 17.73 | 50.0 | 8.46 | 76 | 20 21 |
| 1997 Oct. 22.24 | 54.5 | 8.46 | 80 | 7 21 |
| 1997 Oct. 23.00 | 55.3 | 8.46 | 44 | 19 50 |
| 1997 Oct. 23.24 | 55.5 | 8.46 | 54 | 40 36 |
| 1997 Nov. 18.99 | 82.3 | 8.46 | 127 | 32 13 |
| 1997 Nov. 26.99 | 90.3 | 8.46 | 142 | 27 14 |
| 1998 Feb. 02.73 | 158.0 | 8.46 | 100 | 21 17 |
| 1998 Mar. 05.74 | 189.0 | 1.43 | 90 | 35 27 |
| 1998 Mar. 24.79 | 208.1 | 1.43 | 40 | 57 51 |
| 1998 Mar. 29.68 | 212.9 | 1.43 | 138 | 5 22 |
| 1998 Apr. 27.58 | 241.8 | 1.43 | 90 | 14 22 |
Note. — The columns are (left to right), (1) UT date of the start of each observation, (2) Time elapsed since the GRB 970828 event, (3) The observing frequency, (4) the total time on source, and (5) The peak flux density at the position of the radio transient on 1997 September 1, with the error given as the root mean square flux density.