Discovery of depressions in the X-ray emission of the distant galaxy cluster RBS797 in a CHANDRA observation
We present CHANDRA observations of the X-ray luminous, distant galaxy cluster RBS797 at . In the central region the X-ray emission shows two pronounced X-ray minima, which are located opposite to each other with respect to the cluster centre. These depressions suggest an interaction between the central radio galaxy and the intra-cluster medium, which would be the first detection in such a distant cluster. The minima are symmetric relative to the cluster centre and very deep compared to similar features found in a few other nearby clusters. A spectral and morphological analysis of the overall cluster emission shows that RBS797 is a hot cluster (keV) with a total mass of .
Key Words.:
Galaxies: clusters: general – intergalactic medium – Cosmology: observations – Cosmology: theory – dark matter – X-rays: galaxies1 Introduction
Interaction between the intra-cluster gas and radio sources in the centre of galaxy clusters has been found in several nearby clusters with an anticorrelation of X-ray emission and radio emission, e.g. in the Perseus cluster Fabian et al. (2000), in Hydra-A McNamara et al. (2000), and in Abell clusters A4059 Huang and Sarazin (1998), A2597 McNamara (2001), A2052 Sarazin (2001), A2199 Fabian (2001), and A2634 Schindler (1996). Such an interaction of two different components is particularly interesting because one can infer physical conditions and processes in the cluster centre, e.g. heating and cooling effects, magnetic fields or energies of relativistic particles, from the pressure balance. The observations suggest that the cavities in the X-ray gas rise outwards by buoyancy McNamara et al. (2000); Churazov et al. (2000) while a model by Heinz et al. (1998) predicts shocked gas around the cavities which is not observed. Models by Reynolds et al. (2001) and David et al. (2000) suggest a weak shock regime with radio lobes moving at the local sound speed.
We present here recent CHANDRA observations of the galaxy cluster RBS797. They reveal clear X-ray minima in the cluster centre. We hypothesise that these minima are caused by interaction between the radio source embedded in the central cluster galaxy and the intra-cluster medium. RBS797 would be the first distant cluster in which evidence for such interaction has been found. Only the high spatial resolution of CHANDRA makes it possible to observe such details in distant clusters. This X-ray observation is part of a broader programme to search for strong gravitational lensing in X-ray selected, X-ray luminous clusters. The goal is to take both deep optical images of these clusters and high resolution X-ray exposures. In this way we can use the clusters for arc statistics as well as for the determination and comparison of cluster masses estimated by X-ray observations and by gravitational lensing. Throughout this paper we use km/s/Mpc and .
2 Cluster identification
The X-ray source RXS J094713.2+762317 (or RBS797), found in the ROSAT All-Sky Survey (RASS), was observed optically in the course of the ROSAT Bright Survey (RBS), aiming at optical identification of all bright (count rate cts s-1), high-galactic latitude () X-ray sources detected in the RASS Fischer et al. (1998); Schwope et al. (2000). A spectrum of the central cluster galaxy at RA(2000) = 09 47 12.5, DEC(2000) = +76 23 14, taken with the SAO 6m telescope shows a strong O[II]3727 emission line, and weak, narrow H and O[III]4959/5007 emission lines at a redshift of . The emission lines can be due to a cooling flow or due to nuclear activity of the central cluster galaxy.
3 X-ray observation of RBS797 with CHANDRA
RBS797 was observed on October 20th, 2000 with the CHANDRA Advanced CCD Imaging Spectrometer (ACIS) I detector for a total exposure time of 13.3 ksec. No time was lost due to flares. For the data analysis we used the standard set of event grades and applied no a priori filtering. The energy range used for the images is 0.5-7 keV, for the spectra it is given in Table 1. The response matrices from the CHANDRA Calibration Database package (CALDB) version 2.0 are used.
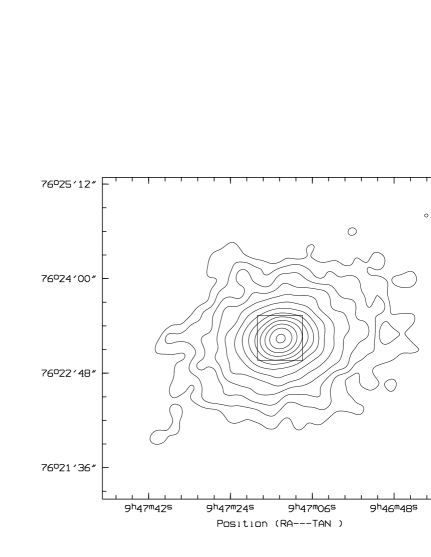
Figure 1 shows the X-ray image of the cluster RBS797 on a scale of 4.7 arcmin ( Mpc). The cluster emission is elliptical with axis ratios of major to minor axis varying slightly from 1.3 at a radius of 0.26 arcmin to 1.4 at a radius of 1.7 arcmin. The centre and the position angle (, N over E) of the ellipses are almost the same over the entire radius range.
The innermost (32 arcsec)2 region of the galaxy cluster RBS797 is shown in Figure 2. Two emission minima are obvious in ENE and WSW direction at distances of about 3-5 arcseconds from the cluster centre. The minima are opposite to each other with respect to the cluster centre. In perpendicular directions excess X-ray emission is visible. At radii of 4 arcsec there is a factor of 3-4 between the X-ray emissions from the different regions (see Fig. 3). The sizes of the X-ray depressions are about 20 - 30 kpc. It is likely – but largely a hypothesis up to now – that the gas has been pushed from the low X-ray emission regions to the high X-ray emission regions by the pressure of relativistic particles in radio lobes, as has been observed in a number of nearby clusters. Although a good hardness ratio map cannot be derived from the data due to the limited number of photons, we find that the hardness ratio in the depressions is not harder than than the overall cluster emission, which excludes absorption or hot gas bubbles as explanations for the minima. The depressions are very significant and deep, and also very symmetric compared to other clusters. Therefore this cluster appears to be an ideal object to investigate the interaction of jets and the intra-cluster medium. We will study the interaction in detail with radio follow-up observations.

4 Spectral analysis, luminosity and mass determination
The CHANDRA data can be used to derive the temperature, metallicity, luminosity and mass of RBS797. For the spectral fits the energy range is restricted to keV and keV, respectively, because the calibration of the low energy channels is still uncertain. We treat the central point-like source (radius arcseconds) separately, because this source is probably an AGN, which would distort the thermal spectrum of the intra-cluster gas.
The results of the spectral analysis are summarised in Table 1. The overall emission is well fit by a thermal bremsstrahlung model with a temperature of 7.7 keV and a metallicity around 0.26 in solar units when the hydrogen column density is fixed to the Galactic value Dickey and Lockman (1990). We find somewhat higher temperatures for fits in the 0.5-10 keV band, compared to the results of the 2-10 keV band, probably indicating problems with the calibration of the low energy channels. Attempting to see radial variations in the fit parameters, we extract photons from three different annuli. There is a trend of increasing temperature and decreasing metallicity with radius, which, however, is not statistically significant due to the limited number of photons in this pointing.
The best-fit value for the redshift () is slightly higher than the optically determined redshift (), but they still agree with each other within . If we fix the redshift to the optical value, the resulting metallicity is lower because the location of the Fe lines does not correspond well with the bump in the observed X-ray spectrum.
Although the “arms” – the regions of higher emission surrounding the minima – contain only 1387 source counts, we attempt a spectral fit, because the temperature measurement is important for distinguishing different models. We find a slightly lower temperature (4.4 keV, see Table 1) than for the rest of the cluster, suggesting that the “arms” are probably not shocked regions. This would rule out the model by Heinz et al. (1998). Similar results have been found in other clusters Fabian et al. (2000); McNamara et al. (2000).
| 1 | 2 | 3 | 4 | 5 | 6 | 7 | 8 | 9 |
| radius | model | energy | in | temp. | metallicity Z | redshift | d.o.f. | /d.o.f. |
| in arcsec | range in keV | 1020 cm-2 | kT in keV | in solar units | z | |||
| MeKaL | 2.22(fixed) | 272 | 1.2 | |||||
| MeKaL | 271 | 1.1 | ||||||
| MeKaL | 2.22(fixed) | 109 | 0.9 | |||||
| MeKaL | 2.22(fixed) | 0.354(fixed) | 91 | 1.0 | ||||
| MeKaL | 2.22(fixed) | 0.39(fixed) | 117 | 1.6 | ||||
| MeKaL | 2.22(fixed) | 0.39(fixed) | 139 | 1.0 | ||||
| MeKaL | 2.22(fixed) | 0.39(fixed) | 95 | 1.2 | ||||
| arms | MeKaL | 2.22(fixed) | 0.26(fixed) | 0.39(fixed) | 52 | 1.2 | ||
| PL | 2.22(fixed) | - | 0.39(fixed) | 20 | 0.9 | |||
| 0.59MeKal | 2.22(fixed) | (fixed) | 0.26(fixed) | 0.39(fixed) | 19 | 0.9 | ||
| + 0.41PL |
In the centre of the cluster is a point-like source, which has a source count rate of about 0.026 cts/s and a flux (2-10keV) erg/s/cm2. The spectrum of this source is very flat and cannot be fitted with a thermal spectrum of reasonable temperature. A power law spectrum, which is an indication for an AGN, (and also a sum of a power law and a thermal spectrum) yields a good fit with a very low index of .
The NRAO VLA Sky Survey (NVSS) lists a radio source at the central cluster position with a peak flux of 0.02 Jy/beam Condon et al. (1998) which is another indication for an active galaxy in the centre of the cluster. A complementary explanation for the central X-ray peak would be a cooling flow as the central cooling time is yr.
The X-ray emission of the cluster can be traced out to a radius of 4.1 arcmin ( Mpc). Within this radius there are 11000 source counts. For the above mentioned parameters, this corresponds to a flux of (0.5-7.0 keV)erg/s/cm2 and erg/s/cm2 and for a redshift of to a luminosity of (0.5-7.0 keV)erg/s and erg/s. Only 3% of the total emission comes from the central source.
The X-ray surface brightness profile of RBS797 (centred on the central galaxy) can be fitted well by a model Cavaliere and Fusco-Femiano (1976) when ignoring the central region. A fit excluding the central 6 arcsec radius yields a slope , a core radius arcsec [or kpc] and a central surface brightness cts/s/arcmin2. With the assumption of spherical symmetry this corresponds to a gas mass of (1Mpc) and with Mpc. Assuming hydrostatic equilibrium, the total mass of the cluster can be estimated. For an isothermal cluster of keV the total mass is (1Mpc) and (see Fig. 4). This corresponds to a gas mass fraction which is in good agreement with the gas mass fractions found in samples of nearby and distant clusters Ettori and Fabian (1999); Mohr et al. (1999); Schindler (1999). Taking into account the temperature gradient changes the results slightly (see Fig. 4).

5 Summary
The X-ray luminous cluster RBS797 reveals remarkable depressions in the X-ray emission of the central region. The depressions are roughly circular and arranged symmetrically with respect to the cluster centre. They have diameters of 20 - 30 kpc and are very deep: a factor of 3-4 less emission than in the other directions. The discovery of these minima shows the ability of CHANDRA to investigate physical effects even in clusters as distant as RBS797 (z=0.35).
The spectral and morphological analysis of RBS797 shows that the cluster has a high temperature of keV, a metallicity , and a high luminosity erg/s. The total mass within is with a gas mass fraction . In follow-up radio observations the interaction between the radio lobes and the intra-cluster gas will be studied in detail.
Acknowledgements.
We thank Doug Burke and Valeri Hambaryan for help with the data analysis and Phil James for carefully reading the manuscript.References
- Cavaliere and Fusco-Femiano (1976) Cavaliere, A. and Fusco-Femiano, R., 1976, A&A 49, 137
- Churazov et al. (2000) Churazov, E., Brüggen, M., Kaiser, C. R., Böhringer, H., and Forman, W., 2000, astro-ph/0008215
- Condon et al. (1998) Condon, J. J., Cotton, W. D., Greisen, E. W., Yin, Q. F., Perley, R. A., Taylor, G. B., and Broderick, J. J., 1998, AJ 115, 1693
- David et al. (2000) David, L. P., Nulsen, P. E. J., McNamara, B. R., and et al., 2000, astro-ph/0010224
- Dickey and Lockman (1990) Dickey, J. M. and Lockman, F. J., 1990, ARA&A 28, 215
- Ettori and Fabian (1999) Ettori, S. and Fabian, A. C., 1999, MNRAS 305, 834
- Fabian (2001) Fabian, A. C., 2001, Proc. of the XXI Moriond Conf: Galaxy Clusters and the High Redshift Universe Observed in X-rays, Neumann D.M. (ed.), in press
- Fabian et al. (2000) Fabian, A. C., Sanders, J. S., Ettori, S., Taylor, G. B., Allen, S. W., Crawford, C. S., Iwasawa, K., Johnstone, R. M., and Ogle, P. M., 2000, MNRAS 318, L65
- Fischer et al. (1998) Fischer, J., Hasinger, G., Schwope, A. D., Brunner, H., Boller, T., Trümper, J., Voges, W., and Neizvestny, S., 1998, Astronomische Nachrichten 319, 347
- Heinz et al. (1998) Heinz, S., Reynolds, C. S., and Begelman, M. C., 1998, ApJ 501, 126
- Huang and Sarazin (1998) Huang, Z. and Sarazin, C. L., 1998, ApJ 496, 728
- Kaastra and Mewe (1993) Kaastra, J. S. and Mewe, R., 1993, A&AS 97, 443
- Liedahl et al. (1995) Liedahl, D. A., Osterheld, A. L., and Goldstein, W. H., 1995, ApJ 438, L115
- McNamara (2001) McNamara, B. R., 2001, Proc. of the IAP 2000 conference “Constructing the Universe with Clusters of Galaxies”, Durret F. and Gerbal D. (eds.),astro-ph/0012331
- McNamara et al. (2000) McNamara, B. R., Wise, M., Nulsen, P. E. J., David, L. P., Sarazin, C. L., Bautz, M., Markevitch, M., Vikhlinin, A., Forman, W. R., Jones, C., and Harris, D. E., 2000, ApJ 534, L135
- Mohr et al. (1999) Mohr, J. J., Mathiesen, B., and Evrard, A. E., 1999, ApJ 517, 627
- Reynolds et al. (2001) Reynolds, C. S., Heinz, S., and Begelman, M. C., 2001, ApJ 549, L179
- Sarazin (2001) Sarazin, C. L., 2001, Proc. of the XXI Moriond Conf: Galaxy Clusters and the High Redshift Universe Observed in X-rays, Neumann D.M. (ed.), in press
- Schindler (1996) Schindler, S., 1996, MNRAS 280, 309
- Schindler (1999) Schindler, S., 1999, A&A 349, 435
- Schwope et al. (2000) Schwope, A., Hasinger, G., Lehmann, I., Schwarz, R., Brunner, H., Neizvestny, S., Ugryumov, A., Balega, Y., Trümper, J., and Voges, W., 2000, Astronomische Nachrichten 321, 1