The nature of the progenitor of the Type II-P supernova 1999em††thanks: Based on observations at the William Herschel Telescope on La Palma and the Canada-France-Hawaii Telescope
Abstract
The masses and the evolutionary states of the progenitors of core-collapse supernovae are not well constrained by direct observations. Stellar evolution theory generally predicts that massive stars with initial masses less than about 30M⊙ should undergo core-collapse when they are cool M-type supergiants. However the only two detections of a SN progenitor before explosion are SN1987A and SN1993J, and neither of these was an M-type supergiant. Recently we have set an upper mass-limit to the progenitor of Type II-P SN1999gi of 9M⊙ (Smartt et al. 2001a) from pre-explosion Hubble Space Telescope images. In this paper we present high quality ground-based images of the site of the Type II-P SN1999em (in NGC1637) taken before explosion, which were extracted from the CFHT archive. We determine a precise position of the SN on these images to an accuracy of . The host galaxy is close enough ( Mpc) that the bright supergiants are resolved as individual objects, however we show that there is no detection of an object at the SN position before explosion that could be interpreted as the progenitor star. By determining the sensitivity limits of the data, and assuming the reddening toward the progenitor is similar to that toward the SN itself, we derive bolometric luminosity limits for the progenitor. Comparing these to standard stellar evolutionary tracks which trace evolution up to the point of core carbon ignition, we initially derive an upper mass limit of approximately 12M⊙. However we present evolutionary calculations that follow 7-12M⊙ stars throughout their C-burning lifetime and show that we can restrict the mass of the progenitor even further. Our calculations indicate that progenitors initially of 8-10M⊙, undergoing expected mass loss, can also be excluded because a second dredge up sends them to somewhat higher luminosities than a star of initially . These results limit the progenitor’s initial main-sequence mass to a very narrow range of 12M⊙. We discuss the similarities between the Type II-P SNe 1999em and 1999gi and their progenitor mass limits, and also consider all the direct evidence currently available on progenitors of core-collapse SNe. We suggest that SN Type II-P originate only in intermediate mass stars of 8-12M⊙, which are in the red supergiant region and that higher mass stars produce the other Type II sub-types. Finally we present a discussion on the future possibilities of determining masses, or mass-limits, and evolutionary status of core-collapse events on a statistically larger sample, using virtual observatory initiatives such as astrovirtel.
1 Introduction
Supernovae are the evolutionary end points of all stars more massive than about 8M⊙. Predictions of the pre-explosion evolutionary status of these stars is a key test of stellar evolutionary theory. Supernovae explosions additionally drive the chemical evolution of the Universe and play a major role in shaping the dynamics of the interstellar medium of gas rich galaxies. They are of crucial importance in the fundamental studies of the evolution of galaxies and the origins of the chemical elements in the Universe.
The spectra of supernovae come in many different varieties with the classifications based on the lines observed and the temporal evolution of these features. The presence of broad H i optical lines indicates a SN Type II classification, while those that do not show hydrogen are classed Type I. The SNe Ia are thought to arise through thermonuclear explosions in white dwarf binary systems, hence the progenitors are low-intermediate mass stars. All other supernovae including the Type Ib/Ic and all flavours of Type II are thought to be due to core-collapse during the deaths of massive stars. SNe II show prominent, broad H i lines in their optical spectra, indicating that the progenitor retained a substantial hydrogen envelope prior to explosion. SNe Ib/Ic do not show any significant signs of hydrogen in their spectra, although SNe Ib display pronounced He i absorption. There is very strong evidence that the SNe II and Ib/Ic are associated with the deaths of massive stars as they are never seen in elliptical galaxies, only rarely in S0 types and they often appear to be associated with sites of recent starformation such as H ii regions and OB associations in spiral and irregular galaxies (Van Dyk et al., 1996; Filippenko, 1997). The Type II events are further seen to be split into subtypes (IIb, IIn, II-L and II-P). Leonard et al. (2001) discuss the widely held belief that core-collapse events can be ranked in order of their increasing hydrogen envelope mass at the time of explosion, which is - Ic, Ib, IIb, IIn, II-L, II-P.
This overwhelming, but still indirect, evidence implies that SNe II arise from the deaths of single, massive stars with initial masses MM⊙ and which have retained a substantial fraction of their hydrogen envelope. However there has been only one definite and unambiguous detection of a star that has subsequently exploded as a SNe of any type that of Sk, the progenitor to SN1987A in the LMC (White & Malin, 1987). Prior to explosion this star was a blue supergiant of B3 Ia spectral type (Walborn et al., 1989), which would correspond to K (from the temperatures in McErlean et al., 1999) and (from the photometry in Walborn et al., 1989), and an initial mass of 20M⊙. The closest supernova to the Milky Way since then was SN1993J in M81 (3.63 Mpc), which was a Type IIb event and ground based photometry of the SN site before explosion was presented by Aldering et al. (1994). The photometry of the progenitor candidate was best fit with a composite spectral energy distribution of a K0 Ia star and some excess band flux either from unresolved OB association contamination or a hot companion. Neither the progenitor of SN1987A nor that of SN1993J is consistent with the canonical stellar evolution picture, where core carbon burning finishes and core-collapse occurs relatively soon afterwards ( yrs) while the massive star is an M-supergiant.
Other attempts have been made to directly find SNe progenitors on pre-explosion archive images, with little success in directly detecting progenitor stars. An upper mass limit to the progenitor of SN1980K has been estimated to be 18M⊙ (Thompson, 1982), while only an upper limit to the absolute visual magnitude was determined for SN1994I (Barth et al., 1996). Recently Smartt et al. (2001a) studied HST archive images of the site of the Type II-P SN1999gi which were taken before explosion. The SN1999gi occurred in a young OB-association, however the the progenitor was below the detection limit of the two pre-explosion images. By determining the sensitivity of these exposures and comparing the estimated bolometric luminosity with stellar evolutionary theory, an upper limit to the mass of the progenitor was set at 9M⊙.
The SN1999em was discovered on Oct. 29 1999 by the Lick Observatory Supernova Search in NGC1637 (Li, 1999) at an unfiltered CCD magnitude of . It was soon confirmed to be a Type II and being a very bright event it has been studied extensively in the optical since then. It has been firmly established as a normal Type II-P event, having a plateau phase lasting approximately 90 days after discovery (Leonard et al., 2001). There have also been UV, X-ray, radio, and spectropolarimetry observations. Baron et al. (2000) have presented model atmosphere fits to the early-time optical and HST-UV spectra, indicating that an enhanced He abundance is required to fit the data satisfactorily. They further use the very blue continuum of the early spectrum to determine a reddening. The expanding photosphere method (EPM) has been applied to SN1999em by Hamuy et al. (2001) to determine a distance to the host galaxy of Mpc, illustrating the possibility of using SNe II-P as luminous distance indicators. Chandra and radio observations of SN1999em have been used to probe the interaction of the SN ejecta with the circumstellar material, which are consistent with a mass-loss rate of M⊙ yr-1 and a slow moving wind velocity of 10km s-1(Pooley et al., 2001). Given the substantial interest in this bright supernova and the extensive multi-wavelength observations of the event it is of great interest to have direct information on the progenitor star. Further it would be desirable to have more detections of progenitor stars (as in SN1987A) in order to draw a meaningful physical picture of what causes the different varieties of core-collapse events.
By chance there are optical images of this galaxy taken 7 years before SN1999em occurred in the archive of the Canada France Hawaii Telescope, maintained at the Canadian Astronomy Data Centre111http//:cadcwww.dao.nrc.ca/cfht/. These high-resolution images were taken by Sohn & Davidge (1998), who presented photometry of the luminous supergiant members of the galaxy. Amongst other results in this paper, a distance of 7.8 kpc is derived from the magnitudes of the galaxy’s brightest stars. As SNe Type II are thought to have luminous supergiant progenitors, high quality pre-explosion images of nearby galaxies which resolve the brightest stars could allow direct detection of progenitors, or at least limits to be set on luminosity in the event of a non-detection. In this paper we present an accurate astrometric determination of the position of SN1999em on the pre-explosion frames. We show that there is no detection of a point source at this position which could be interpreted as the progenitor. The detection limits of the exposures are determined, allowing bolometric luminosity limits and an upper mass limit to be determined for the progenitor star. We present extended stellar evolutionary calculations which follow 8-12M⊙ stars through C-burning and show that this phase is extremely important in understanding SN progenitors in this mass range. In the rest of this paper we refer to the progenitor star as PSN1999em to distinguish between discussions of it and the actual SN1999em event.
2 Data Analysis
2.1 Astrometry, photometry and sensitivity limits
The galaxy NGC 1637 was observed on 5th January 1992 on the CFHT with the HRCam (MClure et al., 1989), with exposures of 900s, 750s and 600s in . The material is publicly available through the CFHT archive at CADC1. The reduction, analysis and multi-colour photometry of the bright stellar objects in the field was presented by Sohn & Davidge (1998, hereafter SD98). Their limiting magnitudes for detection, defined as the magnitude where DAOPHOT (Stetson, 1987) predicts errors of or greater, are 24.9, 24.8, 23.9 in respectively. These data hence probe stars brighter than M, assuming the distance modulus from SD98, and their estimates for average line of sight extinction of . The image quality of the archive data are FWHM in all three bands. SD98 determined the colours for 435 objects in the frames which are simultaneously detected in all three filters. The CFHT HRCam used a 10241024 pixel Ford-Aerospace CCD mounted at prime focus, with 18m pixels, corresponding to on the sky.
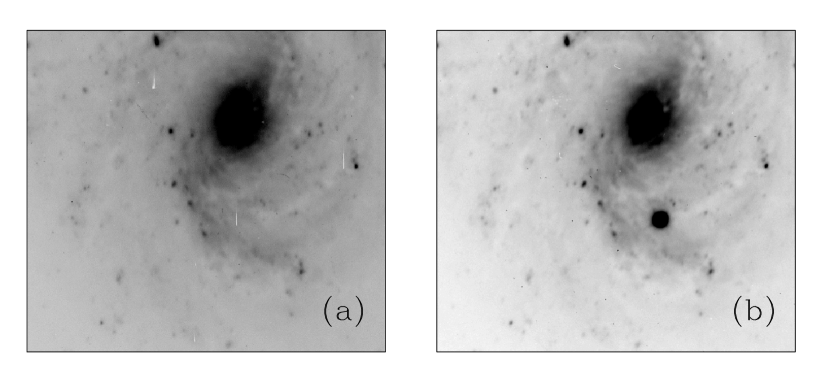
On 28th November 1999, we obtained two band images of NGC1637 on the William Herschel Telescope on La Palma 30 days after discovery of SN1999em. The AUX-port camera at Cassegrain was used, which has a 10242 Tektronix detector (ING CCD TEK2) at a plate scale of pix-1. This was done through the ING service program and two exposures were taken (900s and 10s), during which the seeing was FWHM. The full list of images presented in this paper are given in Table 1. Given the similarities between the cameras, telescope apertures and observing conditions in both cases, the sensitivities of the pre and post-explosion data are very similar (see Fig. 1).
Astrometrically calibrating either of the two frames as they stand onto an absolute reference frame is not possible due to their limited FOV, and the fact that any isolated stars outside the main body of the galaxy which could be used as secondary astrometric standards are saturated in the deep CCD frames. However, given the similarity in the plate scales and the detection limits of the two data sets, we performed a simple geometric transformation of the WHT pixel array onto the CFHT array (similar to the method in Smartt et al. 2001a). First of all we identified ten bright, relatively isolated stars in both the WHT 900s exposure and CFHT frame, and measured the centroids of the stars on the WHT frame by fitting a model point-spread-function (PSF) to each using standard techniques in DAOPHOT within IRAF. We took the pixel coordinates of the 10 stars from the tabulated photometry of SD98. A spatial transformation function was calculated, which fitted a linear shift, a magnification factor and a rotation angle. We also tried using polynomials of various orders to fit the and mapping, but the results were no better than the simple scaling formerly described. The transformation function was applied to the WHT 900s frame, and both were trimmed to the common region of overlap (625560 pixels, as shown in Fig. 1). As a check on the astrometric mapping, we measured the positions of stars which were securely identified in both the CFHT and WHT frames. We carried out PSF-fitting photometry on the WHT frame (again using the IRAF version of DAOPHOT), and picked relatively bright stars () well outside the nuclear region. We matched 106 stars on the WHT and CFHT images, and show the differences in positions in Fig. 2. The mean differences in the stellar positions are and were the errors quoted are standard deviations of the sample; hence there appears to be no residual systematic difference in the pixel astrometry of these two frames. The mean difference in radial positions of the stars in the CFHT and WHT frames is (see Fig. 2).
As the SN1999em was saturated in the WHT 900s frame (being V=13.7m), we used a second short exposure (10s) frame to determine the centroid of the SN. This was taken immediately after readout of the 900s exposure, while the telescope was still guiding smoothly. Simply blinking the short and long exposures appeared to show no gross shifts greater than 0.5 pixel, so we applied the transformation function calculated for the long exposure to the 10s frame. Using the stellar centroid method to check for offsets between the two frames proved problematic due to the low counts in stars in the 10s frame; a significantly longer exposure would have led to saturation of the SN. However we did match 5 detected stars in common to both the 10s and the 900s exposures, and a PSF fitting of their cores indicated mean offsets of (,). As there was reasonable signal in the core region of the galaxy in the short exposure, we cross-correlated a central portion of the transformed 10s frame with the 900s frame. This indicated shifts of (,), and hence we will assume that the centroid of the SN position in the 10s frame can be directly placed on the 900s frame with a error in each axes. We define the position of SN1999em as (0,0), and all coordinates quoted hereafter are with respect to this position (in arcseconds).
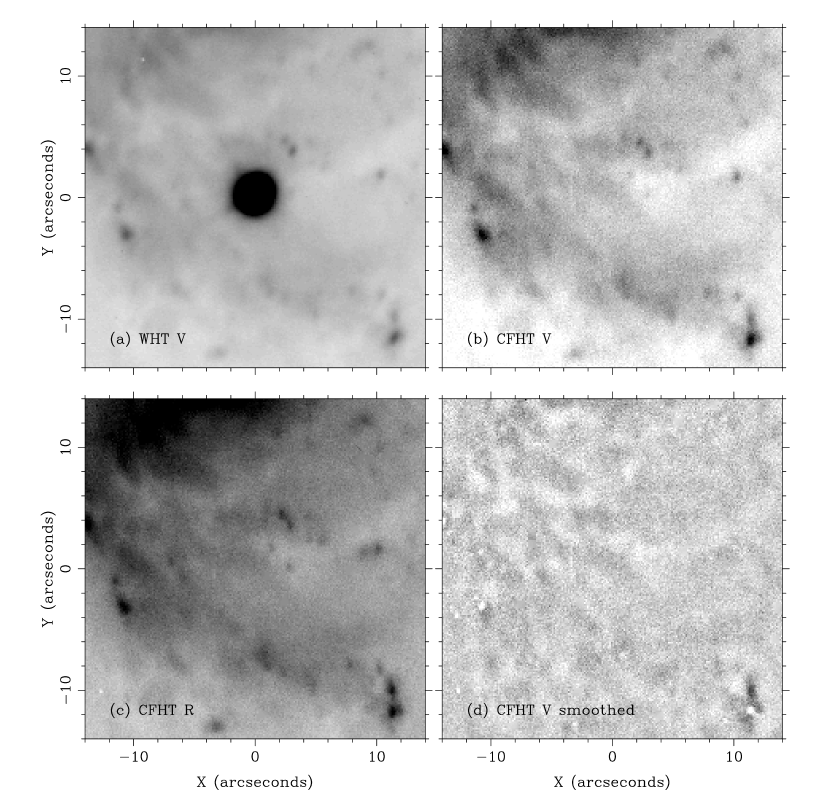
The photometry list of SD98 reports the detection of star #66 (hereafter NGC1637-SD66) at and the nearest other object is away. Star NGC1637-SD66 is the only candidate for the progenitor in the existing photometry of SD98, at a distance of from SN1999em. This does fall within the standard deviation of the differences in positions of the 106 matched stars, and hence is compatible with being coincident with the supernova position (Fig 2). However on closer inspection this does not appear to be a reliable detection of a stellar-like object. In Fig. 3 the region around SN1999em is displayed from the CFHT and bands. There is no obvious resolved luminous object from a visual inspection and star NGC1637-SD66 is not apparently obvious (the results for the -band data are similar). The position of the supernova appears to lie on a faint “ridge” (running diagonally left-right in the figure), and the detection limits of the image are highly position dependent given the variable background. In deriving their final photometric list, SD98 applied a background smoothing technique to recover faint stars against the varying galaxy background. We have repeated this method to determine if any sign of a single point source at the SN1999em position appears after background subtraction, following the steps described in Sohn & Davidge (1996). The daophot package was used to fit model PSFs to the brighter stars in the images. These were subtracted from the data and a boxcar median filter of pixel dimension 2525 (i.e. 5 times the seeing width) was applied to this subtracted image. This is assumed to be indicative of the varying background of the galaxy and was subtracted from the original frame. The PSF fitting routines within daophot were re-run on the resultant frame. The results from this for the band are shown in Fig 3(d), where the point sources subtract off quite cleanly apart from some objects which are not resolved but are broader than a PSF. Again there is no clearly identifiable point-source at the SN1999em position after the smoothing technique is applied, and no object is visible in the and frames either.
We conclude that the progenitor of SN1999em is below the sensitivity limits of the pre-explosion data, and that the star NGC1637-SD66 is an erroneous detection by Sohn & Davidge. Using a method similar to Smartt et al. (2001a) the detection limit of these frames can be determined in order to set constraints on the progenitor luminosity and mass. The PSFs constructed for each of the frames were used as synthetic stars and added into the observed frames. The detection limit is very dependent on position within the galaxy, because the shot noise is background dominated as one approaches the sensitivity limit. Hence we only added in stars very close to the SN position. The SN1999em position is coincident with a bright ridge of material which has a significantly higher background level than surrounding regions. The artificial PSFs were scaled to suitable magnitude levels (in steps of 0.2m) and added in along this ridge. The detection limit was defined as being when all stars were still visible as distinct objects and had signal-levels measured at greater than 7. The values are . These compare well with the completeness limits determined by SD98 on the whole field of view, matching the levels at which greater than 90% of their artificial stars are recovered.
3 Results and discussion
3.1 Bolometric luminosity and mass limits for the progenitor of SN1999em
The detection limits on the CFHT data can be converted to limits on the bolometric magnitude and luminosity of the progenitor object PSN1999em (as for SN1999gi in Smartt et al. 2001). The largest uncertainty is the reddening towards the progenitor. We will assume that the reddening derived towards SN1999em is applicable to the progenitor line of sight.
The reddening towards SN1999em has been estimated by two methods. Baron et al. (2000) have compared the observed early-time spectra at two epochs with model synthetic spectra. The non-LTE line-blanketed model atmosphere fit to the very blue optical continuum allows a “temperature” of the spectrum to be determined simultaneously with a value for . Baron et al. (2000) derived a best fit to the optical spectra of T K and =. One could conceive of increasing the temperature and also increasing the extinction to match the continuum slope, however the Baron et al. models illustrate that this possible degeneracy is well constrained by the early-time blue spectrum. A satisfactory fit to the full spectrum (i.e. continuum, the Ca ii HK, H i, and He i lines) cannot be achieved with and they set this as a robust upper limit on the reddening. They also suggest that a He abundance enhanced by a factor of 2.5 above normal is required to fit the He i 5876 feature. A second method of reddening estimation has been discussed in Hamuy et al. (2001) which is based on the correlation between the equivalent widths of the Na i D ISM lines and line of sight reddening. A calibration of this toward Galactic OB stars has been presented by Munari & Zwitter (1997), and the 2Å equivalent width (of the unresolved Na i D complex) measured by Hamuy et al. (2001) suggests SN1999em was reddened by . This is quite discrepant from the upper limit imposed by the model atmosphere fitting of the blue continuum. A similar disagreement is reported by Hamuy et al. (2001) for the Type Ia SN1986G and both of these examples indicate the problem with applying this Galactic calibration to derive dust extinction towards extragalactic stars. A closer inspection of the Munari & Zwitter (1997) results reveals that this is not unexpected. The relatively good relation that they derive between W(Å) vs. only holds for the sample of stars which are - systems (at their spectral resolution of R16500) and moreover it is based on the Na i D1 line strength only. At the spectral resolution used by Hamuy et al. (2001) the Na i D1 and D2 lines are blended together as are any velocity shifted components of the individual transitions. The Fig. 4 of Munari & Zwitter (1997) indicates that if the multiplicity of the line were unknown then the scatter in derived for a particular W(Å) could be greater than 1.0m. Hence one requires high-resolution observations of the Na i ISM lines towards SNe before one begins trying to apply this relation. Such data is not available at present in the literature, and as one would expect the ISM lines to show multiple velocity components, from the ISM in the Milky Way and NGC1673, use of this method would not seem at all reliable in the particular case of extragalactic objects. We will hence adopt the Baron et al. (2000) measurement of .
The upper limit to the absolute bolometric magnitude of the progenitor can be calculated from the magnitude limit on simply through the relation given in Eqn.1; where the distance to NGC1637 is assumed to be Mpc (from Hamuy et al. 2001), and we assume .
| (1) |
As the spectral type of the progenitor is unknown, the bolometric correction (BC) in Eqn.1 determines the upper limit to the bolometric magnitude, and the values for Mbol are given as a function of spectral type in Table 2. The values for BC are taken from Drilling & Landolt (2000). The other filters can be used in a similar manner to constrain Mbol, and for the equivalent expression is
| (2) | |||||
| (3) |
Where the bolometric correction for the R-band is . An can similarly be derived from the I-band limit assuming . The intrinsic colours and are again taken from the tabulation of Drilling & Landolt (2000). The values for each filter, and the corresponding bolometric luminosities are listed in Table 2 as a function of spectral type (the luminosities are calculated assuming the solar ).
These luminosity limits can be compared with stellar evolutionary tracks to determine an upper mass limit for PSN1999em. The use of solar metallicity tracks is justified from the measurement of nebular abundances in NGC1637. Metallicities of H ii regions have been determined by van Zee et al. (1998) which provide measurements of the galactic abundance gradients of oxygen, nitrogen and sulphur. The central oxygen abundance is determined as and the gradient is dex kpc-1. The SN occurred at a distance from the nucleus, which would suggest an oxygen abundance of 9.1 dex, a factor of 2 above solar metallicity (from the 8.83 dex oxygen abundance in Grevesse & Sauval, 1998). However between distances of and from the centre of NGC1637, there are six H ii regions with measured abundances and the results scatter between 8.949.30 dex. All of these abundance determinations rely on the line ratio calibration and there are no direct measurements of the electron temperatures. By comparing stellar and nebular abundances in the inner regions of M31, Smartt et al. (2001b) have shown that the determination of oxygen abundances from such a method at metallicities slightly higher than solar may yield an overestimate by up to 0.3 dex. Pilyugin (2001) has recently compared the H ii region abundance determinations across the disk of M101 and found that the method produces overestimates of oxygen abundance in the inner regions compared to results derived from temperature sensitive line ratios. Given the scatter observed and the calibration uncertainties, we will assume that a solar metallicity is applicable to the Galactocentric distance at which SN1999em occurred.
3.2 Theoretical Stellar Models
The stellar models come from the most recent version of the Eggleton evolution program (Eggleton 1971, 1972, 1973). The equation of state, which includes molecular hydrogen, pressure ionization and coulomb interactions, is discussed by Pols et al. (1995). The initial composition is taken to be uniform with a hydrogen abundance , helium and metals with the meteoritic mixture determined by Anders and Grevesse (1989). Hydrogen burning is allowed by the pp chain and the CNO cycles. Helium burning is explicitly included in the triple reactions and reactions with 12C, 14N and 16O along with carbon burning via only and the disintegration of 20Ne. Other isotopes and reactions are not explicitly followed. Reaction rates are taken from Caughlan and Fowler (1988). Opacity tables are those calculated by Iglesias, Rogers and Wilson (1992) and Alexander and Ferguson (1994). An Eddington approximation (Woolley and Stibbs 1953) is used for the surface boundary conditions at an optical depth of . This means that low-temperature atmospheres, in which convection extends out as far as (Baraffe et al. 1995), are not modelled perfectly. However the effect of this approximation on observable quantities is not significant in this work (see for example Kroupa and Tout 1997).
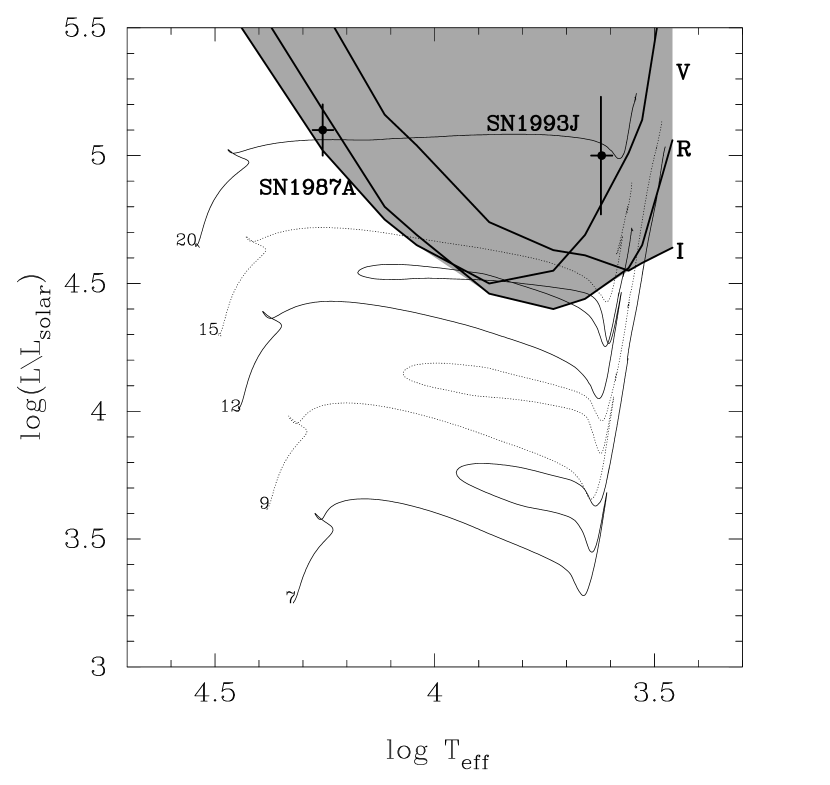
In Fig. 4 the luminosity limits are plotted with these evolutionary tracks. The CFHT pre-explosion images should be sensitive to all objects in the shaded region of the HR diagram. Initially, if we were to assume that the end of core He-burning determines the stars pre-explosion status, we would derive an upper mass limit of approximately 12M⊙. Stars above this mass, and corresponding luminosity, would have -band magnitudes detectable in the CFHT images. The error on our bolometric luminosity is 0.2 dex, which is derived from combining the errors in the Mbol calculation in quadrature i.e. distance (0.5 Mpc), reddening (), sensitivity limits (), BC and intrinsic stellar colours (). We have taken a blue cutoff of B0Ia, which in effect assumes that O-type giants or supergiants are not the precursors to SNe Type II. There are no models to our knowledge that predict such a scenario. However we can go further than this, as the final stages of evolution of stars between 7 and are complex and the C-burning phase plays a crucial role in determining their surface parameters prior to core-collapse. We show below that, somewhat paradoxically, the 7-11M⊙ stars can reach luminosities higher than their more massive counterparts which further constrains the mass of PSN1999em.
Nuclear evolution and mass loss compete to determine the final course of stellar evolution, and dramatic differences are brought about by changes in the order of three key events. These are (i) the helium exhausted core exceeding the Chandrasekhar mass, (ii) the ignition of carbon and (iii) the second dredge-up. A type II supernova explodes when the degenerate core of a star with a hydrogen envelope reaches the Chandrasekhar mass. It is mass loss that determines the fate of the hydrogen but before examining the effects of its removal we shall first consider the nuclear differences in stars of interesting masses.
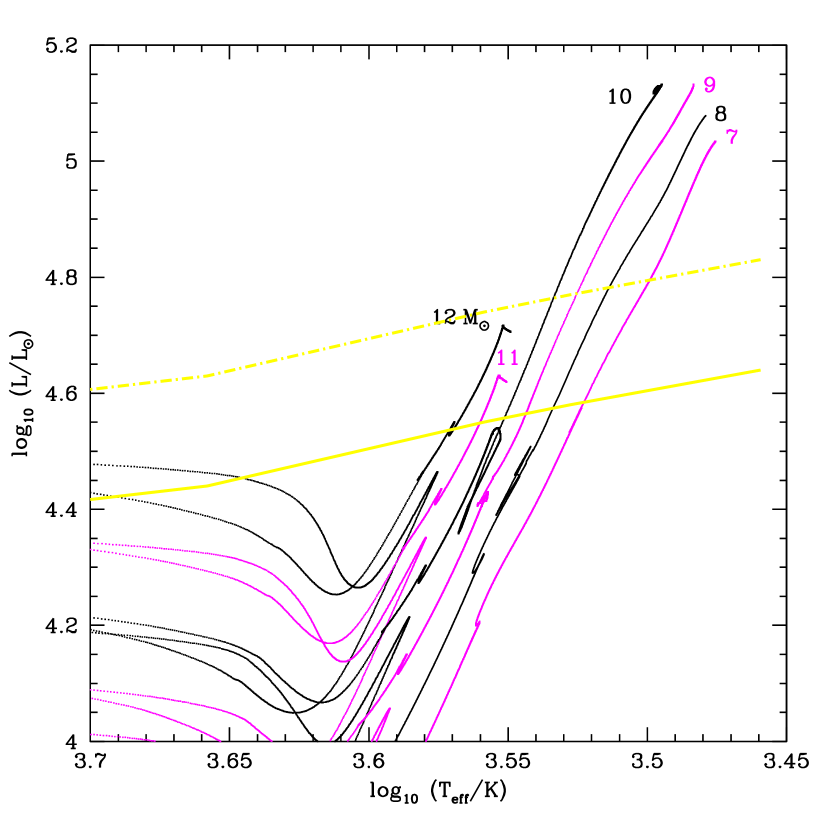
The higher masses are perhaps the simplest. Above the helium burning shell passes the Chandrasekhar mass before carbon ignites. At this point the hydrogen burning shell lies in cooler regions further out in the star and the luminosity is dominated by helium burning. Carbon burning begins non-degenerately in the core and moves without note to shell burning leaving behind an oxygen-neon-magnesium core (hereinafter ONe) that soon reaches . The entire carbon burning phase has very little effect on the star’s position in the H-R diagram. This is essentially the hook at the top of the 11 and tracks in Fig. 4 (more clearly seen in the close-up of this stellar end game in Fig. 5). The supernova explodes when the star is more or less where it was when carbon ignited. For this reason it is efficient and often sufficient to evolve models of such stars only to the point of carbon ignition if we wish to determine the luminosity and effective temperature of the immediate progenitor of the supernova. Up to this point our tracks are very similar to those used by others such as the Geneva Group (Meynet et al., 1994; Schaller et al., 1992). As we shall demonstrate, this is not enough for lower masses.
At the other end of this interesting region, intermediate stars such as a experience a second dredge-up before carbon ignition. The rate of helium burning in its shell rises so that the hydrogen-burning shell expands, cools and goes out on the asymptotic giant branch (hereinafter AGB). Such a star’s convective envelope is then able to pass the extinct H-burning region and carry fresh hydrogen down close to the He-burning shell. A new H-burning shell ignites and once again dominates the luminosity. Because hydrogen is burning at a much greater, hotter depth in the star, it can reach considerably higher total luminosities than its more massive counterparts that do not experience a second dredge-up. This is again apparent in Fig. 5. A star is expected to experience thermal pulses but these are not of interest to us here. Eventually it ignites carbon but while the core mass within the He/H shells is still well below . Carbon burning moves to a shell and, without mass loss, all three burning shells would burn out to followed by a supernova explosion. However stars do not empirically lead to SNe II: in practice stellar winds remove their H-rich envelopes leaving ONe white dwarfs. Our star evolves similarly. It lies close to the boundary between which mass loss and nuclear evolution compete to end its life and may end up as an ONe white dwarf or supernovae respectively.
At intermediate masses carbon ignites before a second dredge-up but also before the He exhausted core has reached . This allows for second dredge-up to take place after core carbon burning and we do indeed find this for our 9 and stars. Because of this, post-carbon-burning evolution cannot be ignored for these stars. As for the lower masses hydrogen once again burns in the deeper hotter regions close to the He-burning shell. The total luminosity again exceeds the maximum attainable by the star. We must now wait until all three burning shells reach before a supernova explosion. Because conditions deep inside are not much affected by envelope mass the maximum luminosity attained by the 9 and stars are similar, the smaller envelope simply making the redder. Similar behaviour was found by García-Berro & Iben (1994). The Geneva group’s models do not show this behaviour because they have a large convective overshoot during core helium burning that ensures that the helium exhausted core exceeds the Chandrasekhar mass before carbon ignition. Our models do not include convective overshooting though they do treat semi-convection in a consistent manner (Eggleton, 1972)
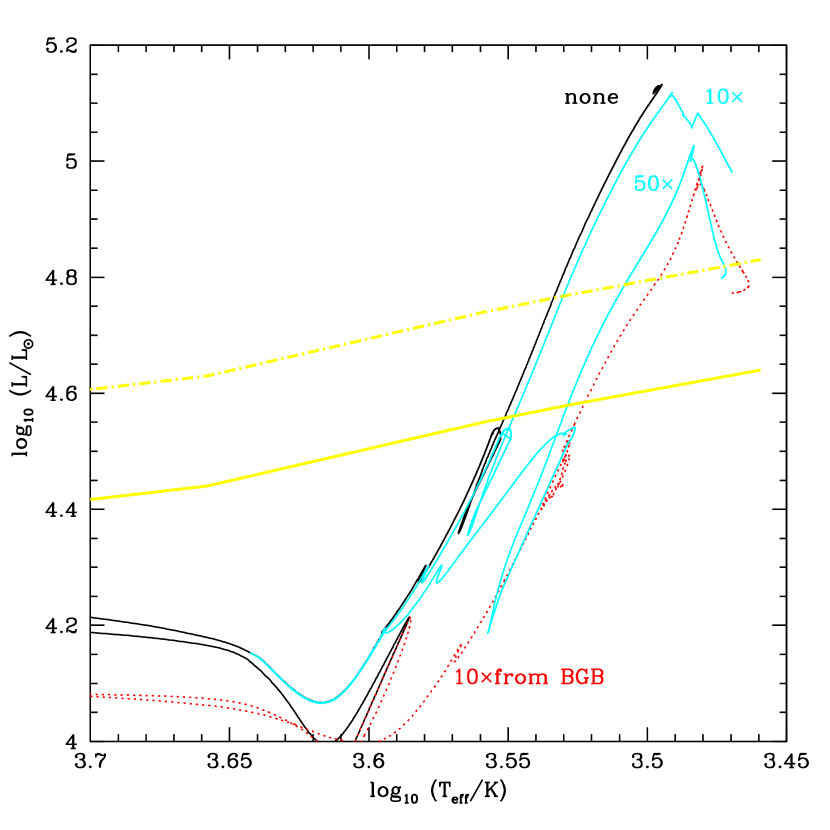
Superimposed on Fig. 5 is our detection limit. Perhaps surprisingly, all the stars lie above the limit when their cores are due to collapse with only the and within our maximum error. But we have yet to consider mass loss. Because the 12 and stars never get quite so luminous nor undergo thermal pulses that prolong the AGB evolution and perhaps drive superwinds (Vassiliadis & Wood, 1993), we do not expect significant mass loss from these stars. Indeed any reasonable mass-loss rates, and we have experimented with (Reimers, 1975) and ten times Reimers, have negligible effect on the point of explosion in the H-R diagram. We have already pointed out that a star is expected to lose its envelope and end up as an ONe white dwarf. Most of this mass loss is thought to take place on the upper AGB after second dredge-up when mass loss dominates over nuclear evolution. We must therefore investigate the possible effects of mass loss on our interestingly intermediate mass stars. Fig. 6 illustrates a variety of cases for a star. As with the 11 and we do not expect significant mass loss before the second dredge-up though we do allow for the possibility. Four cases serve to illustrate the outcomes, (i) a Reimers’ rate applied over the AGB, (ii) ten times Reimers over the AGB, (iii) fifty times Reimers over the AGB and exceptionally (iv) ten times Reimers from the beginning of the red giant branch. Application of the standard Reimers’ rate from the RGB has little effect on the final outcome and typical currently favoured schemes are well represented by less than Reimers before second dredge up rising to ten times Reimers subsequently (e.g. Hurley et al. 2000). When ten times Reimers is applied from the start of the AGB nuclear evolution continues to dominate until second dredge-up is complete and so does not reduce the maximum luminosity achieved. However mass loss and nuclear burning drive the evolution at similar rates. The star moves to the red and its luminosity drops, as its hydrogen envelope is stripped, until the burning shells reach . At this particular rate this happens when the total mass has fallen to about and the star has just passed our detection limit. Empirically stars are not expected to end up as white dwarfs so nuclear evolution must win out somewhere along this part of the track. Recall further that 1999em is a type II-P so a substantial H-envelope must remain at the time of the explosion.
At fifty times the Reimers rate the star will lose its hydrogen envelope before explosion leaving an ONe white dwarf. We follow it until it turns back to the blue at a total mass of while its core is still only . The extreme case of rapid mass loss from the RGB onwards meets a similar end. Second dredge-up still occurs after core carbon burning and high luminosities are still reached. However the lower total mass, which has already fallen to by the start of the AGB and to by the end of the second dredge-up, makes the track much redder and beyond our detection limit. This star inevitably ends its life as a white dwarf and not a supernova. At the even higher rate of one hundred times Reimers (not shown in the figure) the star loses its envelope before second dredge-up to become a naked helium star which is unable to produce a type II-P supernova.
With our incomplete understanding of mass loss our results remain somewhat uncertain, but at present we exclude all progenitors around , even those with very high mass loss. When we do detect a progenitor star we shall have a lot more to say (see 3.4).
3.3 The nature of the progenitors PSN1999em and PSN1999gi
The two supernovae SN1999em and SN1999gi are quite similar in their observed properties and evolution. They had peak absolute visual magnitudes of and respectively and both show classic plateau behaviour (Type II-P). They occurred in regions of similar metallicity in their host galaxies; their progenitors likely had metallicities somewhere between solar and twice solar. The observational limits that we have set also show that their progenitors may have had quite similar masses. Assuming that stars of below 8M⊙ cannot undergo core-collapse, it is likely that the progenitors of these SNe II-P were in the range 8-12M⊙. We can be reasonably confident in ruling out very high mass stars (i.e. 15M⊙) as progenitors, unless the reddening measured towards the SNe was considerably changed by the explosions (for example as suggested for SN1982E by Graham & Meikle, 1986). The atmospheric parameters of the stellar models at the end of core C-burning are broadly consistent with observational parameters derived from spectra and interferometric measurements of mid M-type supergiants (M1-M2 Iab-Ia, see for example White, 1980; de Koter et al., 1988).
The picture of PSN1999gi and PSN1999em both having progenitors in the range M1-M2 Iab-Ia supports the current ideas on the origin of the Type II-P events. These are thought to arise in isolated stars which still have most of their hydrogen atmosphere intact. Woosley & Weaver (1986) discuss the ability of models which treat the explosion as a central point energy source within an extended hydrogen envelope of a red supergiant to reproduce the important features of Type II-P lightcurves. In particular the two-three month long plateau event is explained by the shock propagating through the stars’ envelope, while the photosphere remains at an approximately fixed radius and temperature. Clearly the observational evidence we provide cannot rule out progenitors having higher effective temperatures and lower radii. We can simply say that the limits we set are consistent with stellar evolution and Type II-P explosion theories which predict core-collapse occurring in red (M-type) supergiants.
In Smartt et al. (2001a), in addition to determining direct limits on a late-type progenitor, we discussed the possibility that PSN1999gi was originally a high mass star (in the range M⊙) which evolved into a WR star and was then below the detection limit of the HST WFPC2 pre-explosion images. Such a high mass, and subsequently shorter evolutionary lifetime would have been more compatible with the apparent age of the OB-association within which SN1999gi occurred. However this is an unlikely scenario given the amount of hydrogen present in the spectra of the SN, and the hydrogen poor character of WR stars in general. The range in spanned by the WR stars is large ( to Vacca & Torres-Dogden, 1990), and the least luminous stars are generally the WNE and WCE types. The WCE types have negligible H atmosphere abundances, and the WNE generally have less than 10% H (in mass). There are no explosion models which predict Type II-P behaviour for such hot stars with relatively small radii, and hence WR stars are unlikely to be candidates for PSN1999gi or PSN1999em. As there are also no evolutionary tracks (or explosion models) which predict that supergiants earlier than B-types are direct supernova precursors, there is no reason to suggest we should investigate the region hotter than 28500K in Fig. 4. As SN1987A originated from a B3 Ia progenitor, one could feasibly suggest that a less luminous star () of similar temperature cannot be ruled out by the limits set in Fig. 4. However SN1987A was a peculiar event, and much of this peculiarity was probably due to its relatively small radius, high temperature and significant mass loss in a previous red-supergiant phase. Also such a progenitor is unlikely to be able to explain the higher peak luminosity of SN1999em.
Further indirect evidence for a red-supergiant nature of SN1999em comes from the radio and X-ray observations of Pooley et al. (2001). The SN is detected in X-rays ( keV and keV), and was also detected as a faint radio source several times at 8.435 Ghz. The observations have been modelled by assuming the X-ray and radio fluxes originate as the outgoing SN shock propagates into the circumstellar material formed by the progenitor’s stellar wind. Pooley et al. suggest the observations are consistent with the non-radiative interactions of the supernova ejecta with a pre-supernova wind from a star with a mass-loss rate M⊙ yr-1 and a wind velocity of 10km s-1. The uncertainty quoted for is a factor of two, and in good agreement with typical measured in Galactic M-supergiants; for example Scorpii (M1.5Iab de Koter et al., 1988) has a mass of 15M⊙, R=650R⊙, and M⊙ yr-1. The measured wind parameters of Jura & Kleinmann (1990) of more massive red supergiants (MM⊙), tend to be significantly higher than M⊙ yr-1. The X-ray and radio fluxes are thus not easily reconciled with such a high mass progenitor, supporting the direct observational limits we have presented. Given these estimates of mass-loss, and assuming a mass of approximately 1.6M⊙ forms a neutron star, there is approximalety 10M⊙ ejected in the explosion. This is a large enough mass of ejected material to account for a plateau phase lasting approximately 60-100 days and hence is still consistent with the behaviour of SN1999em e.g. see the plateau phases for various masses calculated in Arnett (Arnett, 1996). SN1999gi has also been observed in X-rays by Schlegel (Schlegel, 2001), with a luminosity very similar to SN1999em. Again this implies M⊙ yr-1, supporting the idea that PSN1999gi was also a moderate luminosity M-supergiant with a relatively weak wind. Applying our extended theoretical models to the bolometric luminosity limits of Smartt et al. (2001a) would suggest that a mass close to 89M⊙would be applicable for SN1999gi, consistent with the limits previously derived of 9M⊙. If we again allow approximately 2M⊙ to be lost by mass-loss and neutron star formation, then the SN ejecta should be around 7M⊙. While the high end of this range is large enough to sit comfortably with models of a long plateau phase, the lower end is discrepant Arnett (1996). It is important then that the lightcurves of these events are presented and analysed within the framework of current explosion models to check if they are consistent with the mass limits we derive.
3.4 Comparison with other SNe and future prospects
As discussed above, the two Type II-P SNe 1999em and 1999gi were very similar in their observed characteristics. The similar progenitor mass limits further suggest that the progenitor stars and the core-collapse explosion were quite similar. It supports the idea that Type II-P have red supergiant progenitors, with large radii and retain a substantial hydrogen envelope before core-collapse. The fact that both PSN1999gi and PSN1999em are at the lower mass range of stars which can undergo core-collapse may also be a suggestion that II-P SNe only occur in such relatively low-mass red supergiants. However the statistics of events with any direct clue to the nature of progenitors are quite sparse. Table 3 lists the only five SNe which have some direct study of the progenitor available (1994I does not have an upper mass estimate; Barth et al., 1996). The two brightest and best studied modern supernovae are SN1987A and SN1993J, and both were peculiar in some way. SN1987A was unusual in many ways, which is generally explained by the hot progenitor star which had a relatively small radius, was probably a red supergiant before undergoing a blue-loop which produced multi-layer circumstellar material (see McCray, 1993). To be consistent in our comparisons, we have recalculated the upper-mass limit for 1980K, using the absolute magnitude limit derived by Thompson (1982) and more modern stellar colours and bolometric corrections as applied to PSN1999em and PSN1999gi. The metallicity of the progenitor of SN1980K is estimated as 0.5Z⊙ from the abundance gradient presented in Dutil & Roy (1999, assuming the galactocentric radius of ), which is interestingly similar to that of the LMC. We have compared the bolometric luminosities with the 0.008Z tracks of the Geneva group, and derive an upper mass limit of 20M⊙ assuming that the star ends its life as a red supergiant. This assumes a distance modulus of 28.7 (Buta, 1982) and an uncertainty of 0.5 as the distance to this galaxy is not particularly well known. However we note that in the early B-type supergiant region the bolometric luminosity limit is . A progenitor similar to that of SN1987A would not have been detectable on Thompson’s pre-explosion plate, and the progenitor mass could have been considerably greater than 20M⊙ if the star was hot.
SN1993J began showing spectra quite typical of a Type II event, but then it evolved dramatically to resemble a Ib event (Matheson et al., 2000, and references therein). It may be that the progenitor was stripped of much of its outer H i envelope by a close companion, consistent with the Aldering et al. (1994) suggestion that an OB companion may be responsible for the excess -band flux from the best fit K0Ia progenitor. The progenitor star was not of particularly high mass, so that its own radiatively driven stellar wind is unlikely to have been capable of stripping of its outer envelope to approximately 0.10.6M⊙. Apart from 1999em and 1999gi, there are no other normal SNe II-P which have information on the progenitor stars. Although the statistics do not allow a reliable connection between progenitor and SNe type to be made as yet, we propose that normal SNe II-P result from fairly low-mass (M⊙) single stars with large radii in the M-supergiant phase which have undergone only moderate mass-loss. The X-ray and radio observations of 1999em and 1999gi support this idea. Higher mass progenitors may have complicating factors such as blue-loop evolution scenarios, much higher mass-loss rates, multi-component circumstellar shells due to slow dense winds from a cool supergiant phase combined with hot fast winds from OB-type evolutionary phases, and all of these may be metallicity dependent. The evolution of high mass stars (greater than about 20M⊙) is still not well understood, and of particular concern is the blue-red supergiant ratio in Local Group galaxies and how this varies with metallicity. There is no stellar evolution theory that can consistently reproduce the observed ratios and the trend of the blue-red ratio increasing with metallicity e.g. see Langer & Maeder (1995), although the introduction of stellar rotation may go some way to addressing this (Maeder & Meynet, 2000, 2001). In a very simple minded approach one would envisage the higher mass stars producing much more heterogeneous types of SNe. The evolutionary tracks of 9-12M⊙ stars are much less dependent on mass-loss rates and metallicity than the higher mass ones. Our prediction that the SNe II-P are from the low mass end of stars which undergo core-collapse is testable with event statistics. A stellar initial mass function with and implies that 50% of all stars with masses above 8M⊙ should have masses in the range M⊙, hence 50% of all core-collapse SNe should be of Type II-P. If one increases the upper mass limit for to 15M⊙ then 66% of all events should be II-P. A complete evaluation of the statistics of all known core-collapse SNe which have sub-types is outside the scope of this paper, given the completion and bias issues that one would have to review and consider in detail. However as the numbers of SNe which have reliable sub-types continue to rise, one should be able to apply this test in the near future.
We require data on more progenitors before we can be confident of the origins of the core-collapse SNe sub-types. Prompt and frequent multi-wavelength observations of SNe provide quite detailed information on the explosion and circumstellar material, and by inference on the mass-loss and envelope properties of the progenitor. However by having high-quality archive images of SNe sites taken prior to explosion we can set much firmer limits on the nature of the progenitor stars. Observations of nearby spiral and irregular galaxies within 20 Mpc of the Milky Way allow the massive stellar content to be resolved. Multi-band images from the Hubble Space Telescope of all the face on spirals would be an excellent archive for future use when SNe are discovered. In the worst case this will allow limits to be set on the progenitor masses, as shown here and in Smartt et al. (2001), and should lead, in some cases, to definite identifications of progenitor stars. Already the HST archive contains approximately 120 Sb-Sd galaxies within 20 Mpc which have observations of useful depth in at least 2 broad-band filters. There are a further 130 Sb-Sd spirals with exposures in 1 broad-band filter. We have a Cycle 10 HST project to supplement the latter 130 galaxies with 2 further filters, and observe 120 more late-type spirals in three filters. This should give a total of 370 Sb-Sd galaxies with HST observations and this number is steadily increasing each year, with data coming from projects with other scientific goals. This is supplemented with high-quality ground-based images from the well maintained archives of the ESO, ING, CFHT (and soon Gemini). There are various initiatives aimed at producing combined virtual observatories which, amongst many other applications, have the unique historical aspect which is essential to SNe progenitor searches. One of the first of these (astrovirtel222http://www.stecf.org/astrovirtel) has already allowed us to search multi-telescope archives (HST + ESO telescopes) and use catalogue data as search criteria (e.g. LEDA). Along with some manual searching of the ING and CFHT archives, this suggests there are a further 100 spirals with ground-based observations of the quality presented here for NGC1637. Assuming a combined SNe II/Ib/Ic rate of (Cappellaro et al., 1999), and that the galaxies in our archive have a mean luminosity , then one would expect core-collapse SNe per year in this sample. As the field-of-view of the WFPC2 on HST will only cover an average of 50% of the area of the optical disk of spirals between 10-20 Mpc, then an estimate of the number of SNe which will have pre-explosion archive material available is per year. Within a period of yrs we would hence expect the statistics presented in Table 4 to improve significantly. This is an example of unique science to be done with future Virtual Observatories.
4 Conclusions
We have presented high-resolution ground-based images of the pre-explosion site of the Type II-P supernova 1999em in NGC1637. The position of the supernova is accurately determined using post-explosion observations with a very similar optical camera. Despite the depth and quality of the pre-explosion observations, and the fact that they detect many bright supergiants in the host galaxy, there is no detection of a progenitor star. The progenitor (PSN1999em) is below the detection limit of the each of the -band exposures. By determining the detection limit of each image, a limit on the apparent magnitude of PSN1999em in each filter can be determined, from which the bolometric luminosity is calculated with some basic assumptions. By comparing this with theoretical stellar evolutionary tracks an upper mass limit for PSN1999em can be determined. We find the following results
-
1.
Assuming that the reddening derived towards SN1999em is equally applicable to the progenitor then we initially dervive an upper mass limit of approximately 12M⊙ for the initial mass of PSN1999em. However we find that extending the evolutionary tracks to the end of core C-burning has a dramatic effect on the final luminosities of 7-10M⊙ stars, pushing them to much higher luminosities than the initially more massive 11-12M⊙ stars. These lower mass, but more luminous objects should be detectable in our CFHT -band pre-explosion frame. Hence this allows us to constrain the initial mass of PSN1999em to the narrow range 121M⊙.
-
2.
Our stellar evolutionary tracks predict that a 12M⊙ star should undergo core-collapse when an M-type supergiant. The limits we have set are consistent with this. Further the X-ray and radio measurements of the interaction of the SN ejecta with circumstellar material allow an estimate of the mass-loss rate and wind velocity of the progenitor star. These results are compatible with typical observational mass-loss rates found in low-moderate luminosity M-type supergiants.
-
3.
SN1999em is observationally very similar to the II-P SN1999gi in terms of its absolute peak magnitude, and spectral characteristics. We have set a similar mass limit on the progenitor of SN1999gi, from HST pre-explosion data, of 9M⊙ (Smartt et al. 2001). The similarity of the progenitor mass limits and the SN events supports the idea that they had similar progenitor masses and spectral types. We suggest that the homogeneous class of Type II-P SN could all be from intermediate mass, single, progenitors in the M-supergiant stage which have retained their hydrogen envelope.
-
4.
We have compared all the information currently available on the 5 SN progenitors which either have a mass limit or spectral type and mass estimation. The three higher mass events have heterogeneous types of SNe, while the two low mass events are quite similar. The sparse statistics prevent any definitive conclusions, but there is a suggestion that the post-explosion evolution of the higher mass events are influenced by pre-explosion variations in mass-loss rates, metallicity, blue loops in the HR diagram, and complex multi-component circumstellar shells. The homogeneous normal SN II-P may come from a lower mass population which is not so readily influenced by these parameters.
References
- Alexander & Ferguson (1994) Alexander D. R., Ferguson J. W., 1994, ApJ, 437, 879
- Anders & Grevesse (1989) Anders E., Grevesse, N., 1989, Geochim. Cosmochim. Acta, 53, 197
- Arnett (1996) Arnett D., 1996, “Supernovae and Nucleosynthesis”, Princeton University Press
- Baraffe et al. (1995) Baraffe I., Chabrier G., Allard F., Hauschildt P. H., 1995, ApJ, 446, L35
- Aldering et al. (1994) Aldering G., Humphreys R.M., Richmond M., 1994, AJ, 107, 662
- Baron et al. (2000) Baron E., et al., 2000, A&A, 545, 444
- Barth et al. (1996) Barth A., Van Dyk S.D., Filippenko A.V., Leibundgut B., Richmond M., 1996, AJ, 111, 2047
- Buta (1982) Buta R.J., 1982, PASP, 94, 578
- Cappellaro et al. (1999) Cappellaro E., Evans R., Turatto M., 1999, A&A, 351, 459
- Caughlan & Fowler (1988) Caughlan G. R., Fowler W. A., 1988, At. Data Nucl. Data Tables, 40, 284
- de Koter et al. (1988) de Koter A., de Jager C., Nieuwenhuijzen H., 1988, A&A, 100, 146
- Drilling & Landolt (2000) Drilling J.S., Landolt A.U., 2000, in Allen’s Astrophysical Quantities, ed. A.N. Cox, AIP Press
- Dutil & Roy (1999) Dutil Y., Roy J.-R., 1999, ApJ, 516, 62
- Eggleton (1971) Eggleton P. P., 1971, MNRAS, 151, 351
- Eggleton (1972) Eggleton P. P., 1972, MNRAS, 156, 361
- Eggleton (1973) Eggleton P. P., 1973, MNRAS, 163, 279
- Filippenko (1997) Filippenko A.V., 1997, ARA&A, 35, 309
- García-Berro & Iben (1994) García-Berro E., Iben I., 1994, ApJ, 434, 306
- Graham & Meikle (1986) Graham J.R., Meikle W.P.S., 1986, MNRAS221, 789
- Grevesse & Sauval (1998) Grevesse N., Sauval A.J., 1998, Space Science Rev., 85, 161
- Hamuy et al. (2001) Hamuy M., et al., 2001, ApJin press, astro-ph/0105006
- Iglesias et al. (1992) Iglesias C. A., Rogers F.J., Wilson B.G., 1992, ApJ, 397, 717
- Jura & Kleinmann (1990) Jura M., Kleinmann S.G., 1990, ApJS, 73, 769
- Kroupa & Tout (1997) Kroupa P., Tout C. A., 1997, MNRAS, 287, 402
- Langer & Maeder (1995) Langer N., Maeder A., 1995, A&A, 295, 685
- Leonard et al. (2001) Leonard D.C., Filippenko A.V., Ardila D.A., Brotherton M.S., 2001, ApJ, in press, astro-ph/0009285
- Li (1999) Li W.D., 1999, IAU Circ. No. 7294
- McErlean et al. (1999) McErlean N.D., Lennon D.J., Dufton P.L., 1999, 349, 553
- MClure et al. (1989) McClure R.D., et al. 1989, PASP101, 1156
- McCray (1993) McCray R., 1993, ARA&A, 31, 175
- Matheson et al. (2000) Matheson T., et al., 2000, AJ, 120, 1487
- Maeder & Meynet (2000) Maeder A., Meynet G., 2000, ARA&A, 38, 143
- Maeder & Meynet (2001) Maeder A., Meynet G., 2001, A&A, in press, astro-ph/0105051
- Meynet et al. (1994) Meynet G., Maeder A., Schaller G. Schaerer D., Charbonnel C., 1994, A&AS, 103, 97
- Munari & Zwitter (1997) Munari U., Zwitter T., 1997, A&A318, 269
- Pilyugin (2001) Pilyugin L.S., 2001, A&A, in press, astro-ph/0105103
- Pols et al. (1995) Pols O.R., Tout C.A., Eggleton P.P., Han Z., 1995, MNRAS 274, 964
- Pooley et al. (2001) Pooley D., et al., 2001, astro-ph/0103196
- Reimers (1975) Reimers D., 1975, Mem. Soc. R. Sci. Leige 6e.Ser., 8, 369
- Schaller et al. (1992) Schaller G., Schaerer D., Meynet G., Maeder A., 1992, A&AS, 96, 269
- Schlegel (2001) Schlegel E.M., 2001, ApJ, 556, L25
- Smartt et al. (2001a) Smartt S.J., Gilmore G.F., Trentham N., Tout C.A., Frayn C.M., 2001a, ApJ, 556, L29
- Smartt et al. (2001b) Smartt S.J., Crowther P.A., Dufton P.L., Lennon D.J., Kudritzki R.P., Herrero A., McCarthy J., Bresolin F., 2001, MNRAS, 325, 257
- Sohn & Davidge (1996) Sohn Young-Jong, Davidge T.J., 1996, AJ111, 2280
- Sohn & Davidge (1998) Sohn Young-Jong, Davidge T.J., 1998, AJ116, 130 (SD98)
- Stetson (1987) Stetson P.B., 1987, PASP99, 191
- Thompson (1982) Thompson L.A., 1982, ApJ, 257, L63
- Vacca & Torres-Dogden (1990) Vacca W.D., Torres-Dogden A.V., 1990, ApJS, 73, 685
- Van Dyk et al. (1996) Van Dyk S.D., Hamuy M., Fillipenko A.V., 1996, AJ, 111, 2017
- van Zee et al. (1998) van Zee L., Salzer J.J., Haynes M.P., O’Donoghue A.A., Balonek T.J., 1998 AJ, 116, 2805
- Vassiliadis & Wood (1993) Vassiliadis E., Wood P. R., 1993, ApJ, 413, 641
- Walborn et al. (1989) Walborn N. et al., 1989, A&A, 219, 229
- White & Malin (1987) White G.L., Malin D.F., 1987, Nature, 327, 36
- White (1980) White N.M, 1980, AJ, 242,646
- Woolley & Stibbs (1953) Woolley R. v. d. R., Stibbs D. W. N., 1953, The Outer Layers of a Star, Clarendon Press, Oxford
- Woosley & Weaver (1986) Woosley S.E, Weaver T.A., 1986, ARA&A, 24, 205
| Date | Telescope | Filter | Exposure | Quality |
|---|---|---|---|---|
| Jan. 5 1992 | CFHT | 900s | ||
| Jan. 5 1992 | CFHT | 750s | ||
| Jan. 5 1992 | CFHT | 600s | ||
| Nov. 28 1999 | WHT | 900s | ||
| Nov. 28 1999 | WHT | 10s |
| Limits from | Limits from | Limits from | ||||||||
|---|---|---|---|---|---|---|---|---|---|---|
| Sp. Type | (K) | BC | ||||||||
| B0 | 28500 | 2.63 | 9.11 | 5.54 | 2.98 | 9.59 | 5.73 | 3.10 | 10.62 | 6.14 |
| B3 | 18000 | 1.31 | 7.79 | 5.02 | 1.59 | 8.20 | 5.18 | 1.69 | 9.21 | 5.58 |
| B8 | 13000 | 0.66 | 7.14 | 4.75 | 0.64 | 7.25 | 4.80 | 0.64 | 8.16 | 5.16 |
| A0 | 11000 | 0.41 | 6.89 | 4.65 | 0.38 | 6.99 | 4.69 | 0.33 | 7.85 | 5.04 |
| F0 | 7500 | 0.01 | 6.50 | 4.50 | 0.20 | 6.41 | 4.46 | 0.40 | 7.12 | 4.74 |
| G0 | 5370 | 0.15 | 6.64 | 4.55 | 0.36 | 6.25 | 4.40 | 0.69 | 6.83 | 4.63 |
| K0 | 4550 | 0.50 | 6.99 | 4.69 | 0.26 | 6.35 | 4.44 | 0.74 | 6.78 | 4.61 |
| M0 | 3620 | 1.29 | 7.78 | 5.01 | 0.06 | 6.67 | 4.56 | 0.88 | 6.64 | 4.55 |
| M2 | 3370 | 1.62 | 8.11 | 5.14 | 0.28 | 6.89 | 4.65 | 0.82 | 6.70 | 4.58 |
| M5 | 2880 | 3.47 | 9.96 | 5.88 | 1.29 | 7.90 | 5.06 | 0.67 | 6.85 | 4.64 |
| SN | Type | Mass | Z | Spec. Type |
|---|---|---|---|---|
| 1987A | II peculiar | 20M⊙ | 0.5Z⊙ | B3Ia |
| 1980K | II-L | M⊙ | 0.5Z⊙ | ? |
| 1993J | IIb | 17M⊙ | 2Z⊙ | K0Ia |
| 1999em | II-P | M⊙ | 12Z⊙ | M-supergiant ? |
| 1999gi | II-P | M⊙ | 2Z⊙ | M-supergiant ? |