Hubble and FUSE Studies of Ly Absorbers at Low
Abstract
Ultraviolet spectrographs aboard the Hubble Space Telescope (HST) and the Far Ultraviolet Spectroscopic Explorer (FUSE) have proved their value as sensitive probes of the low-density intergalactic medium (IGM) at low redshifts (). Recent observations in Ly, Ly, and occasional higher Lyman lines show that warm photoionized gas in the low- IGM may contain 20–25% of the baryons, with a N distribution in column density. Measurements of resonance lines of Si III, C III, C IV, and O VI suggest that the metallicity of these absorbers ranges from 1–10% of solar abundance down to values below . A comparison of Ly/Ly ratios (FUSE and HST) yields a distribution of Doppler parameters with km s-1 and median 28 km s-1, comparable to values at = 2–3. The curve-of-growth (CoG) -values are considerably less than widths derived from Ly profile fitting, , which suggests that low- absorbers contain sizable non-thermal motions or velocity components arising from cosmological expansion and infall. A challenge for future UV spectroscopic missions (HST/COS and SUVO) is to obtain precision measurements of and metallicities for the strong Ly absorbers that dominate the IGM baryon content. This program will require accurate determinations of: (1) curves of growth using higher Lyman series lines; (2) the ionizing radiation field at 1–5 Ryd; and (3) characteristic sizes and shapes of the absorbers.
CASA and JILA, Department of Astrophysical & Planetary Sciences, University of Colorado and NIST, Boulder, CO 80309-0389
1. Introduction
For sheer sensitivity to interstellar or intergalactic H I, no technique compares with absorption lines of Ly (1215.670 Å) and Ly (1025.722 Å). Owing to its large dipole oscillator strength, Ly is sensitive to gas with column density N cm-2, a million times lower than typically detected in 21-cm emission. It is little wonder that astronomers and cosmologists are drawn to Ly studies as probes of the IGM, to investigate processes of galaxy formation, large-scale structure, IGM thermal history, and chemical evolution.
To understand these processes, which characterized the epoch when the first stars, galaxies, and heavy elements were formed, requires large ground-based telescopes and high-resolution spectrographs. At redshifts , sufficient to redshift H I Ly into the visible, astronomers have thoroughly studied the “Ly Forest” with the Keck/HIRES (Hu et al. 1995), VLT/UVES (Kim, Cristiani, & D’Odorico 2001), and other spectrographs. At lower redshifts, , one must use ultraviolet telescopes to measure Ly. To make the important connections between Ly absorbers and signatures of galaxy formation and large-scale structure, it is best to probe the “local Ly forest” at , where galaxy surveys and optical/21-cm imaging can detect galaxies well below the nominal limit. It is this area of low- IGM studies that has interested the Colorado group (Stocke et al. 1995; Shull et al. 1999a).
In its first several years, HST was used with the Faint Object Spectrograph (FOS) to carry out the QSO Absorption Line Key Project (Bahcall et al. 1991, 1993; Jannuzi et al. 1998; Weymann et al. 1998). Among its primary results was a characterization of the Ly forest at at low resolution (230 km s-1) using strong Ly lines (primarily with rest-frame equivalent width mÅ). In this review, I discuss our moderate-resolution (19 km s-1) HST studies of the more numerous, weak Ly lines ( mÅ) using the Goddard High-Resolution Spectrograph (GHRS) and the Space Telescope Imaging Spectrograph (STIS). I also describe studies with the FUSE spectrograph, which has become a powerful probe of the IGM. With similar resolution (15–25 km s-1) at wavelengths shortward of those accessible to HST and with LiF and SiC optics (Moos et al. 2000), FUSE provides access to the spectroscopically rich far-UV band (912–1187 Å) which contains Ly, higher Lyman-series lines, and lines of key heavy elements, C III (977.03 Å) and O VI (1031.93, 1037.62 Å).
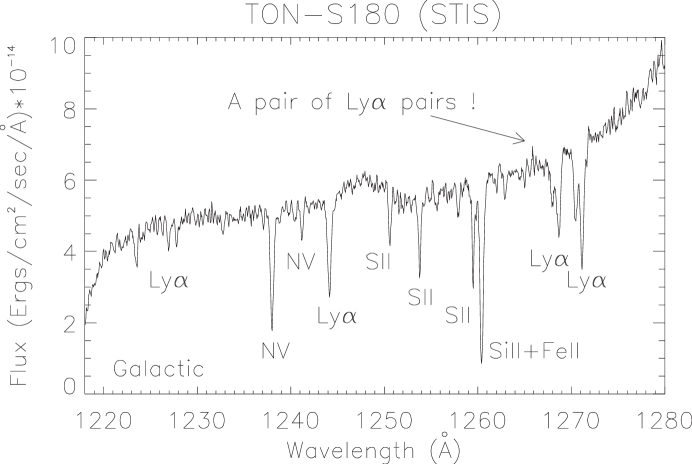
Figure 1 shows a typical moderate-resolution spectrum taken by STIS. The Colorado survey results appear in a series of papers (Penton, Stocke, & Shull 2000; Penton, Shull, & Stocke 2000; Penton, Stocke, & Shull 2001a,b) that describe an analysis of 197 absorbers along sightlines to 31 AGN, over a total redshift pathlength . Preliminary FUSE results on the “Ly forest” (Shull et al. 2000) have been followed by a number of papers on individual IGM sightlines, including PG 0953+415 (Savage et al. 2001), H1821+643 (Tripp et al. 2001), and 3C 273 (Sembach et al. 2001).
The enormous amount of data on high- Ly absorbers has constrained models for the growth of large-scale structure in the IGM. Similar comparisons can be made at low redshift, although the number of sightlines available for Ly studies is far more limited. Among the desired H I statistics are the distribution in absorbers per unit redshift, , and their distribution in column density . We also wish to understand the degree of clustering, the two-point correlation function in velocity, and any associations of absorbers with galaxies. However, the redshift pathlength currently available for moderate-resolution studies () is much smaller than that surveyed at high-. This disparity should change with the installation of the Cosmic Origins Spectrograph (COS) on HST in early 2004. Another QSO Absorption-Line Key Project with COS would be highly desirable.
2. Low-Redshift IGM Studies
2.1. Scientific Goals
It now appears likely that a substantial fraction of low- baryons reside in the IGM, distributed in comparable amounts between hot shocked gas (Cen & Ostriker 1999; Davé et al. 2001) and warm photoionized Ly absorbers (Shull et al. 1996, 1999a). At high redshifts, substantial progress has been made in linking these absorbers with the lowest density fluctuations of the baryon density; the statistics and physical properties of the absorbers are interpreted in terms of global models for the gravitational collapse of structure (Miralda-Escudé et al. 1996; Hernquist et al. 1996; Zhang et al. 1997). In a hierarchical dark matter-dominated cosmological framework, the evolution of the Ly forest depends on the evolution of the dark matter and the thermal history of the IGM (Croft et al. 1999; Hui & Gnedin 1997; Schaye et al. 1999; Ricotti, Gnedin, & Shull 2000). Davé et al. (1999) show that the IGM overdensity–temperature relation (“effective equation of state”) may be extended to low redshift and measured by the quantities and . We and others have pursued this idea theoretically and have used HST data to test it (Ricotti et al. 2000; Davé & Tripp 2001). However, until more observations are taken with the HST/STIS echelle (7 km s-1 resolution), it will be difficult to define the true thermal line widths and perform reliable thermodynamic studies of the temperature evolution of the IGM.
With both FUSE and HST, our long-term goals are to characterize the amount and distribution of baryons in the low- IGM and to define the extent of heavy-element transport in the IGM. Although many groups are continuing their studies of key individual sightlines, some of the most important long-term work involves large-scale surveys of Ly, Ly, and heavy elements. These surveys are intended to “weigh the Ly forest” (measure ) and determine the history of IGM metal production and transport away from their sources.
To perform these measurements accurately, one must detect both Ly and Ly, as well as the accessible UV resonance lines such as Si III , Si IV , C III , C IV , and O VI . Our work (Shull et al. 1999; Penton et al. 2000a,b) suggests that low- Ly absorbers are an important gaseous reservoir, with perhaps 25% of the baryons remaining in the IGM from the epoch of galaxy formation. However, because of the significant photoionization corrections required for this estimate, large uncertainties remain. Any accounting of the present-day distribution of baryons must include an accurate census of these clouds and the mass associated with them. As discussed in greater detail below (§3), precision measurements of the amount of warm (photoionized) IGM will take considerable effort. Not only must we characterize the absorber distribution in H I column density, but we must also apply a large ionization correction for the amount of unseen hydrogen in ionized form. This correction is straightforward, depending on the ratio, , of ionizing background intensity to gas density. Although the gas density, , is loosely related to the column density, NHI, it is more accurately derived from the absorber geometry, including the characteristic scale length for variations in the gas distribution.
We would also like to use the H I line widths and Doppler parameters to understand the thermodynamical properties of the IGM. What is its temperature? When was energy deposited into the IGM from photoionization or bulk outflows? The Ly/Ly curves of growth yield reliable H I column densities of the saturated Ly lines with N cm-2. Present estimates of the distribution in NHI together with the expected photoionization correction (H+/Htot) suggest that the baryon content is dominated by the high end of the H I column-density distribution. In addition, observations of Ly lines corresponding to the Ly absorbers confirms the identification of any Ly systems that may have been confused with metal lines intrinsic to the AGN.
2.2. Results of the HST Survey
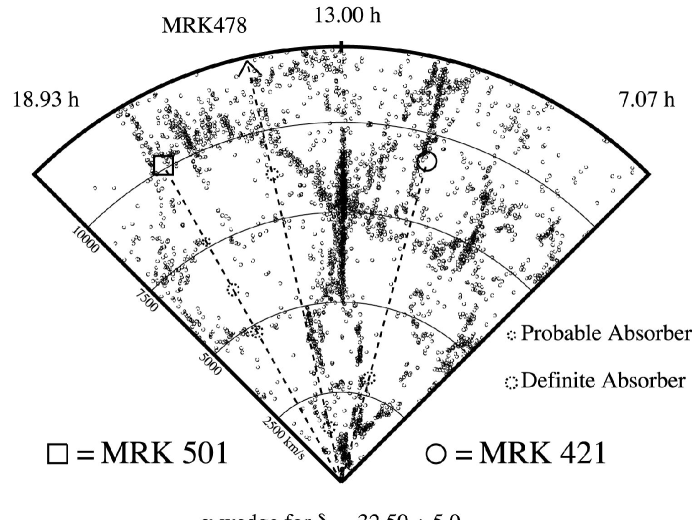
Our HST data were taken toward AGN (quasars, Seyferts, BL Lacs) brighter than mag, corresponding to UV spectral flux ergs cm-2 s-1 Å-1. Most of our targets were chosen to lie behind well-studied galaxy distributions, in order to probe the connection of the Ly absorbers with large-scale distributions of galaxies and voids (see Figure 2 and the paper by Stocke in this volume). Our GHRS survey (Penton et al. 2000a,b) included 81 Ly absorbers with line significance greater than , along 15 sightlines. With STIS, we have added 16 more AGN sightlines, bringing the survey total to 197 Ly absorbers over a cumulative pathlength . Our survey yields a line frequency, for N cm-2 at . The mean distance between such absorbers along the sightline is
| (1) |
for a Hubble constant . This mean distance decreases by approximately a factor of 2, when we include the more numerous weak Ly absorbers (10 – 50 mÅ) with column densities .

In our GHRS/STIS survey of 197 Ly absorbers (Penton et al. 2001b), the Ly rest-frame equivalent widths range from mÅ to just above 1 Å. For unsaturated Ly lines, N. The H I column densities were derived using curves of growth (CoG) with Doppler parameters km s-1. The distribution exhibits a significant break at mÅ, with an increasing number of weak absorbers (10 – 100 mÅ). These weak Ly absorbers provide the most numerous and extensive probes of low-density regions of the IGM. We characterize the distribution in H I column densities (Figure 3) as a power law,
| (2) |
At the low-column end, the slope is somewhat steeper, (), while for the saturated Ly absorbers (). These values are similar to those found in the high-redshift Ly forest (Kim et al. 1997, 2001). Figure 4 shows the evolution of strong and weak Ly absorbers with redshift, over the interval .

2.3. FUSE Studies of the Ly Forest

One of the Early Release Observations of the FUSE program was a moderate-resolution (20-25 km s-1) study of the low-redshift IGM (Shull et al. 2000). Our team carried out studies of 7 extragalactic sightlines and 12 Ly absorbers that correspond to Ly lines detected by HST/GHRS and STIS. In general, we detect Ly absorption for all Ly systems with mÅ. This is not surprising, since for unsaturated lines, the equivalent widths are: and . Even considering line saturation, the Ly line should have equivalent width . Using FUSE data, with 30–40 mÅ (4) Ly detection limits, we employed the equivalent width ratio of Ly/Ly and occasional higher Lyman lines to determine the Doppler parameters, , and column densities, NHI, for moderately saturated lines. The Ly/Ly technique is demonstrated in Figure 5, which shows the CoG concordance for the strong 1586 km s-1 Ly absorber toward 3C 273. In this case (Sembach et al. 2001), we detect the first 8 Lyman lines (Ly through Ly). Surprisingly, the CoG-inferred column density and -value differ considerably from those derived from Ly profile fitting.
From a CoG analysis, the Ly/Ly ratios in our FUSE survey (Shull et al. 2000) yield a preliminary distribution function of Doppler parameters, with mean km s-1 and median km s-1, comparable to values at redshifts . If thermal, these -values correspond to K, too hot for purely photoionized clouds (Donahue & Shull 1991). However, we find some evidence that the line widths are not entirely thermal. The CoG-inferred Doppler parameters are considerably less than the widths derived from Ly profile fitting, . The combined HST/FUSE data suggest that the low- Ly absorbers contain significant non-thermal motions or velocity components in the line profile, perhaps arising from cosmological expansion and infall.
Because the CoG generally produces lower -values, the derived H I column densities increase. The typical increase over that derived from Ly profile fitting is , but it can increase by more than a factor of 10. In an extreme case (Figure 5) the 1586 km s-1 absorber toward 3C 273 increased in column density by a factor of over 40, to log N (Sembach et al. 2001) compared to the value, log N, determined from Ly profile fitting (Weymann et al. 1995). This large change in NHI arose because the curve of growth gave a Doppler parameter km s-1, while Ly profile fitting gave km s-1.
2.4. Metallicities
Determining the intergalactic heavy-element abundance (metallicity) of ionization state () of element () depends in the first instance on measuring accurate column densities, NHI and NZ,i. As discussed above, NHI can be particularly sensitive to CoG effects arising from line saturation; the combination of Ly and higher Lyman lines is often needed to fix the -value. One must then apply an ionization correction, to convert the ratio NZ,i/NHI to a total abundance NZ/NH. If the absorbing gas is photoionized, this ionization correction is straightforward (Donahue & Shull 1991; Shull et al. 1998) if one knows the intensity and spectrum of the metagalactic background radiation and the physical density, , of the absorber. In practice, one computes the ionization correction as a function of the dimensionless “photoionization parameter”, , where is the number density (cm-3) of Lyman-continuum photons and is the number density of hydrogen nuclei. The situation becomes more complicated if the absorber’s physical conditions include collisional ionization in hotter gas, such as the O VI absorbers seen by Tripp, Savage, & Jenkins (2000).
Metallicity limits in several low- Ly clouds have been set for the strong 17,000 km s-1 absorbers toward PKS 2155-304 (Shull et al. 1998). The absence of detectable Si III or C IV sets limits of less than 0.003 solar. Other promising systems Ly systems have been found, including two strong Ly absorbers toward PG 1211+143 (see Figure 6). With rest-frame equivalent widths of 1.14 Å and 0.89 Å, these absorbers are among the strongest detected in our GHRS/STIS sample, and they appear to show heavy elements at the level of several percent solar metallicity. Additional studies of Ly absorbers with mÅ are currently underway with both FUSE and HST.

3. Toward Precision Measurements of the IGM Baryon Content
The primary ingredients for making accurate measurements of the contribution of low- Ly absorbers to are:
-
•
Accurate H I column densities, derived from a CoG analysis of Ly, Ly, and occasional higher Lyman lines.
-
•
Knowledge of the ionizing radiation field, neeeded to derive the photoionization corrections for total abundances.
-
•
An estimate of the physical density, , from independent determinations of H I absorber sizes, shapes, and gas distribution.
Toward these ends, we are attempting to accumulate a sufficiently large database of Ly and Ly absorbers with HST and FUSE to characterize the distribution in NHI. However well one can determine the NHI distribution, one still must deal with absorber geometric issues that produce systematic uncertainties in the ionization corrections.
One of the best ways to make progress is to find a “constellation of AGN” whose UV spectra can be cross-correlated for common Ly absorption lines to infer their characteristic sizes. At the current flux limits of the 2.4m HST, this is a difficult experiment, but there is hope with the planned (Jan. 2004) installation of the Cosmic Origins Spectrograph (COS) on HST. With 10–20 times greater throughput than STIS, COS will be able to obtain moderate resolution (15–20 km s-1) spectra toward AGN as faint as 18 mag. As shown in Table 1, this greatly increases the chances of finding multiple bright QSOs separated by . With a sufficient number of AGN background sources behind low- Ly absorbers, one can make rudimentary “tomographic maps” of the cosmic web of warm (photoionized) baryons left over from the epoch of large-scale structure formation.
Mapping the evolution of these gaseous structures down to low is a prime scientific goal of COS. The full experiment must await the powerful 6–8m successor to HST, a mission concept known as the Space Ultraviolet-Visible Observatory (SUVO). The scientific and technological rationale for SUVO is contained in the “White Paper” from the UV-Optical Working Group (Shull et al. 1999c) available on the Web at http://origins.colorado.edu/uvconf/UVOWG.html.
Table 1
QSO Counts and Mean Angular Distancea Between QSOs
| (magn) | (sqdeg-1) | (arcmin) |
|---|---|---|
| 16 | 0.01 | |
| 17 | 0.13 | |
| 18 | 1.1 | |
| 19 | 5.3 | |
| 20 | 17 | |
| 21 | 41 |
a Mean angular distance between Poisson-distributed QSOs of frequency per square degree (see Shull et al. 1999c).
To thoroughly map the cosmic web, we need to observe QSOs at magnitudes down to , where the the mean angular distance between QSOs on the sky is , allowing for lower UV continuum fluxes owing to potential extinction. After accounting for ultraviolet absorption from Lyman-limit systems, Picard & Jakobsen (1993) found a steep rate of increase, for quasars in the flux range down to ergs cm-2 s-1 Å-1 (approximately down to ). The current limit of HST/STIS for moderate-resolution spectroscopy is , while HST/COS will take this limit to . Another order-of-magnitude improvement is required to capitalize on the large increase in QSO populations at magnitudes .
In the next several years, the GALEX mission is expected to identify large numbers of QSOs in the magnitude range . The Sloan survey will provide redshifts for many of these targets. The task of mapping the IGM structures from down to will be a highlight of the SUVO program, if its spectrographs are designed with sufficient throughput to undertake a major survey of sightlines at high spatial frequency. The goal is to make an IGM baryonic survey on sub-degree angular scales, comparable to that of the MAP explorer and to the structure seen in galaxy surveys. In doing so, we will connect the high-redshift seeds of galaxies and clusters with the distributions of galaxies and IGM in the modern epoch, at redshifts .
Acknowledgments.
This work was supported at the University of Colorado by grants from the Space Telescope Science Institute, the FUSE Science Program, and the NASA Theoretical Astrophysics program. I thank my Colorado colleagues, John Stocke, Steve Penton, Mark Giroux, Jason Tumlinson, Massimo Ricotti, and Nick Gnedin for their contributions toward this research.
References
Bahcall, J.N. et al. 1991, ApJ, 377, L5
Bahcall, J.N. et al. 1993, ApJS, 87, 1
Bechtold, J., Crotts, A.P.S., Duncan, R.C., & Fang, Y. 1994, ApJ, 437, L83
Cen, R. & Ostriker, J. P. 1999, ApJ, 519, L109
Croft, R., Weinberg, D.H., Pettini, M., Hernquist, L., & Katz, N. 1999, ApJ, 520, 1
Davé, R., Hernquist, L., Katz, N. & Weinberg, D.H. 1999, ApJ, 511, 521
Davé, R., & Tripp, T. 2001, ApJ, 553, 528
Davé, R., et al. 2001, ApJ, 552, 473
Donahue, M., & Shull, J.M. 1991, ApJ, 383, 511
Hernquist, L., Katz, N., Weinberg, D.H., & Miralda-Escudé, J. 1996, ApJ, 457, L51
Hu, E.M., Kim, T.-S., Cowie, L.L., Songaila, A., & Rauch, M. 1995, AJ, 110, 1526
Hui, L., & Gnedin, N. 1997, MNRAS, 292, 27
Impey, C.D., Petry, C.E., & Flint, K.P. 1999, ApJ, 524, 536
Jannuzi, B.T., et al. 1998, ApJS, 118, 1
Kim, T.-S., Hu, E.M., Cowie, L.L., & Songaila, A.1997, AJ, 114, 1
Kim, T.-S., Cristiani, S., & D’Odorico, S. 2001, A&A, in press
Miralda-Escudé, J., Cen, R., Ostriker, J. P., & Rauch, M. 1996, ApJ, 471, 582
Moos, H.W., et al. 2000, ApJ, 538, L1
Penton, S.V., Stocke, J.T. & Shull, J.M. 2000a, ApJS, 130, 121
Penton, S.V., Shull, J.M. & Stocke, J.T. 2000b, ApJ, 544, 150
Penton, S.V., Stocke, J.T. & Shull, J.M. 2001a, ApJ, submitted
Penton, S.V., Stocke, J.T. & Shull, J.M. 2001b, in preparation
Picard, A., & Jakobsen, P. 1993, A&A, 276, 331
Ricotti, M., Gnedin, N., & Shull, J.M. 2000, ApJ, 534, 41
Savage, B.D., et al. 2001, ApJ, in press
Savaglio, S., et al. 1999, ApJ, 515, L5
Schaye, J., Theuns, T., Leonard, A., & Efstathiou, G. 1999, MNRAS, 310, 57
Sembach, K.R., Howk, J.C., Savage, B.D., Shull, J.M., & Oegerle, W.R. 2001, ApJ, in press
Shull, J.M., Stocke, J.T., & Penton, S.V. 1996, AJ, 111, 72
Shull, J.M., et al. 1998, AJ, 116, 2094
Shull, J.M., Penton, S.V. & Stocke, J.T. 1999a, PASA, 16, 1695
Shull, J.M., et al. 1999b, AJ, 118, 1450
Shull, J.M., Savage, B.D., Morse, J.A., et al. 1999c, Report of UV-Optical Working Group (see astro-ph/9907101 on http://xxx.lanl.gov/multi)
Shull, J.M., Giroux, M.L., et al. 2000, ApJ, 538, L13
Stocke, J.T., Shull, J.M., Penton, S., Donahue, M., & Carilli, C. 1995, ApJ, 451, 24
Tripp, T. M., Savage, B.D., & Jenkins, E.B. 2000, ApJ, 534, L1
Tripp, T.M. et al. 2001, ApJ, in press
Weymann, R.J., Rauch, M., Williams, R., Morris, S., & Heap, S. 1995, ApJ, 438, 650
Weymann, R.J., et al. 1998, ApJ, 506, 1
Zhang, Y., Meiksin, A., Anninos, P., & Norman, M. L. 1997, ApJ, 485, 496