The Spectrum and Accurate Location of GRS 1758-258
Abstract
We observed the “micro-quasar” GRS 1758–258 four times with Chandra. Two HRC-I observations were made in 2000 September-October spanning an intermediate-to-hard spectral transition (identified with RXTE). Another HRC-I and an ACIS/HETGS observation were made in 2001 March following a hard-to-soft transition to a very low flux state. The accurate position (J2000) of the X-ray source is RA 18 01 12.40, Dec 25 44 36.0 (90% confidence radius 0′′.6), consistent with the purported variable radio counterpart. All images are consistent with GRS 1758–258 being a point source, indicating that any bright jet is less than 1 light-month in projected length, assuming a distance of 8.5 kpc. The March spectrum is well-fit with a multi-color disk-blackbody with an inner temperature of keV, interstellar absorption of , and (un-absorbed) 110 keV luminosity of . No narrow emission lines are apparent in the spectrum and upper limits to line equivalent widths are given.
Center for Astrophysics and Space Sciences, University of California, San Diego, La Jolla, CA 92093, U.S.A.
Space Sciences Laboratory, University of California, Berkeley, Berkeley, CA 94720, U.S.A.
1. Introduction
GRS 1758–258 and its sister source, 1E 1740.7–2942, were the first objects dubbed “micro-quasars”. Their X-ray spectra are typical of Galactic black hole candidates (BHCs), and they are associated with time variable cores of double-lobed radio sources, reminiscent of extra-Galactic radio sources. This morphology, seen on a parsec scale within the Milky Way, earned them their nickname. GRS 1758–258 and 1E 1740.7–2942 are the brightest persistent sources in the Galactic bulge above 50 keV (Sunyaev et al., 1991). Their timing characteristics are typical of the black hole low/hard state (Main et al., 1999; Smith et al., 1997; Heindl et al., 1993; Sunyaev et al., 1991), and they consistently emit near their brightest observed levels, although they vary over times of days to years. Their X-ray emission properties are readily likened to the canonical BHC, Cyg X-1. In fact, together with Cyg X-1, they are the only known persistent, low-state BHCs, and all three sources have maximum luminosities around ergs s-1. Radio jets have now been observed in Cyg X-1, furthering the similarity (Fender, 2000).
GRS 1758–258 and 1E 1740.7–2942 are, however, quite different from the Galactic superluminal radio sources more typically thought of as micro-quasars: GRS 1915+105 and GRO J1655-40. The X-ray emission from these objects is much brighter and more spectacularly variable. Their radio jets, too, are much brighter and are highly variable, being unresolved or absent except during exceptional ejection events which last only weeks. In contrast, the radio lobes of GRS 1758–258 and 1E 1740.7–2942 are quite stable (Mirabel and Rodriguez, 1999).
| Seq. # | Date | Inst. | Exp. | Rate |
|---|---|---|---|---|
| (ksec) | (counts/s) | |||
| 400085 | 2000 Sep 11.2 | HRC-I | 1 | 11.4 |
| 400131 | 2000 Oct 27.4 | HRC-I | 10 | 4.2 |
| 400164 | 2001 Mar 24.3 | HRC-I | 10 | 7.8 |
| 400163 | 2001 Mar 24.4 | ACIS-S | ||
| /HETGS | 30 | 6.8111order 0 rate, significantly piled up |
2. Observations
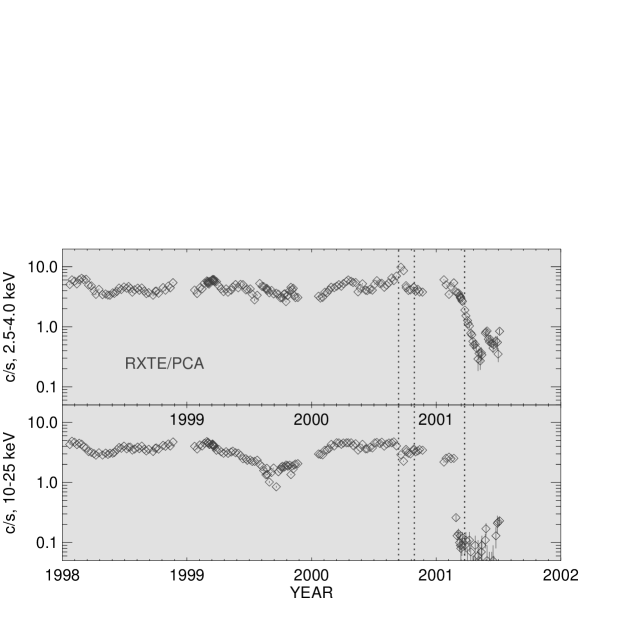
We observed GRS 1758–258 four times with Chandra. Table 1 lists the observation dates and durations. Two HRC-I observations were made in 2000 September-October spanning an intermediate-to-hard spectral transition (identified with RXTE Smith et al., 2001a, b). Another HRC-I and an ACIS/HETGS observation were made back-to-back in 2001 March following a dramatic hard-to-soft transition to a very low flux state. Figure 1 shows the RXTE/PCA light curve with our Chandra observations indicated.
3. Imaging and the Accurate Position
Figure 2 shows the HRC-I image from observation 400131. In this and the other HRC observations, the GRS 1758–258 image is consistent with the HRC point spread function, indicating that the source is point-like at the sub-arcsecond level. Assuming a distance of 8.5 kpc, this says that no strong jets are present on a physical scale of a light-month, the presence of arcminute scale radio jets notwithstanding. This is perhaps not surprising, as the timescale associated with producing the parsec-sized radio lobes would be years rather than months, and in fact the radio lobes are observed to be quite stable over years(Mirabel and Rodriguez, 1999). Thus, while de facto not ruled out, it is not required that a persistent small-scale X-ray jet be present to produce the observed radio lobes.
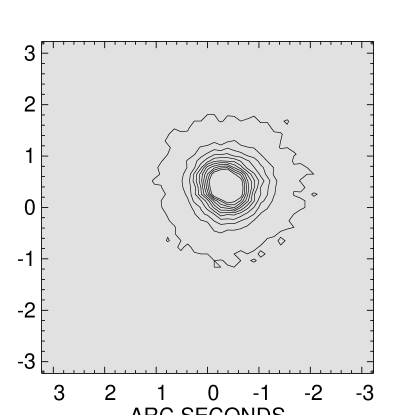
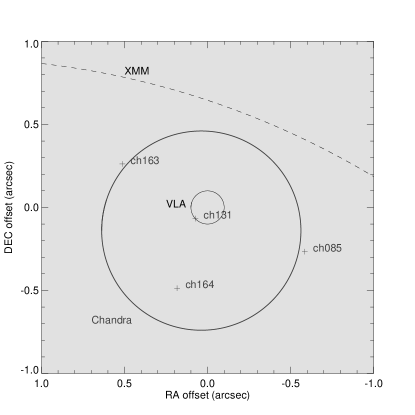
Figure 3 shows the best fit source locations from our four Chandra observations as well as the estimated 90% confidence region derived from the average of the four positions. The ACIS-S/HETGS position (400163=ch163) was based on the zeroth-order image. While the image was significantly piled up, we expect a negligible effect on the position. The Chandra error circle is centered at (J2000) RA 18 01 12.40, Dec 25 44 36.0 and has an estimated 90% confidence radius of 0′′.6 based on Chandra’s absolute aspect accuracy and averaging of four independent observations. The coincidence of the sub-arcsecond VLA and Chandra error circles seals the association of GRS 1758–258, the X-ray source, with the variable radio source (“VLA-C”, Marti et al., 1998).
4. Spectrum
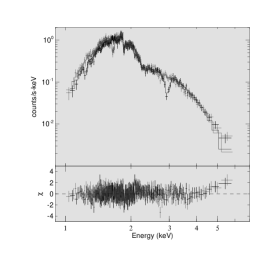
To reduce pile-up in the ACIS/HETGS observation, we used a 1/2 chip sub-array with a 1.7 s frame time. However, the counting rates in the MEG first order spectra were still about 2 counts/s, resulting in mild (10%) pileup around 2 keV. For this presentation, we therefore restrict spectral fitting to the first order HEG spectra which did not suffer from pile-up. Figure 4 shows the HEG Order spectra rebinned to a minimum of 100 counts per bin. The data are well described by a multi-color disk-blackbody model and interstellar absorption (XSPEC: “phabs*diskbb”). The positive deviations above 4 keV are indicative of a weak power-law component (2% of the 110 keV unabsorbed flux) seen in joint fits with a contemporaneous RXTE/PCA (315 keV) observation. Table 2 lists the best fit parameters to the HEG spectra alone.
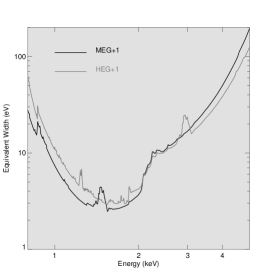
Preliminary inspection of both the HEG and MEG spectra showed no strong emission lines. Figure 4 shows the 5 sensitivity to narrow emission lines. Because the GRS 1758–258 spectrum is so soft, the line sensitivity is a strong function of energy, varying by nearly two orders of magnitude between 15 keV. The sensitivity was based on the best fit spectrum (see above) and the effective area of the ACIS/HETGS combination.
| ( ) | |
|---|---|
| (eV) | |
| Flux (1–10 keV, ) | |
| /dof | 0.66/544 |
5. Discussion
During more than 5 years’ monitoring with the RXTE prior to 2001 March, the GRS 1758–258 hard X-ray spectrum was always dominated by a hard power law with photon index (Smith et al., 2001a) with occasional appearance of a weak thermal component (Mereghetti et al., 1994; Heindl and Smith, 1998; Lin et al., 2000). As shown in Figure 1, GRS 1758–258 made an abrupt state change in 2001 March. The hard flux dropped by an order of magnitude in a few days, leaving the thermal component seen in Figure 4. Based on relative luminosity, however, the current soft state is not a high/soft state. Rather it is significantly less luminous than the low/hard state in this source. This can be contrasted to Cyg X-1 and the soft X-ray transients, where the high/soft state is more luminous. Rather, this seems to be a low-luminosity state which is fading into quiescence (Figure 1). Finally, we note that the measured column density is consistent with previous measurements (Mereghetti et al., 1994; Lin et al., 2000; Goldwurm et al., 2001)
Since strong jet ejections are generally associated with the “very
high state” and transitions from the “off” to high/soft states in
X-ray transients (Fender, 2001), it is perhaps not surprising that no
jet emission appeared in our low/hard state observations (Sep-Oct
2000) and the recent transition observation (Mar 2001). Perhaps our
best opportunity will come when (if?) GRS 1758–258 makes a transition once
again to its normal, low/hard state. We have an approved Chandra cycle 3 proposal to monitor the morphology of GRS 1758–258 and hope to
observe a jet ejection.
References
- Fender (2000) Fender, R.: 2000, in Rossi2000. March 22-24, 2000 at NASA/GSFC, Greenbelt, MD USA, p. E87
- Fender (2001) Fender, R. P.: 2001, in Proc. ESO Workshop (Garching, Sep 1999). L. Kaper, E.P.J. van den Heuvel, P.A. Woudt (eds.), Springer., p. 193
- Goldwurm et al. (2001) Goldwurm, A. et al.: 2001, astro-ph/0106310
- Heindl et al. (1993) Heindl, W. et al.: 1993, ApJ 408, 507
- Heindl and Smith (1998) Heindl, W. A. and Smith, D. M.: 1998, ApJ 506, L35
- Lin et al. (2000) Lin, D. et al.: 2000, ApJ 532, 548
- Main et al. (1999) Main, D. et al.: 1999, ApJ 525, 901
- Marti et al. (1998) Marti, J., Mereghetti, S., Chaty, S., Mirabel, I. F., Goldoni, P., and Rodriguez, L. F.: 1998, A&A 338, L95
- Mereghetti et al. (1994) Mereghetti, S. et al.: 1994, ApJ 433, L21
- Mirabel and Rodriguez (1999) Mirabel, I. and Rodriguez, L.: 1999, ARA&A 37, 409
- Smith et al. (1997) Smith, D. et al.: 1997, ApJ 489, L51
- Smith et al. (2001a) Smith, D., Heindl, W., Markwardt, C., and Swank, J.: 2001a, ApJL, accepted, astro-ph/0103381
- Smith et al. (2001b) Smith, D., Markwardt, C., and Heindl, W.: 2001b, IAU Circ. 7595, 1
- Sunyaev et al. (1991) Sunyaev, R. et al.: 1991, ApJ 383, L49