The DLAs contribution to the metal content of the high z Universe
Abstract
We investigate the evolutionary history of the Universe’s metal content focusing on the chemical abundance of several elements (N, O, S, Si, Fe, Cr, Zn) taken from observational data and predictions from chemical evolution models. The estimated abundances were observed in Damped Lyman Systems (DLAs) over a wide range of redshift (z0.5-4.5). These data are compared to predictions of chemical evolution models. Since the nature of the DLAs is uncertain, they are represented by two class of models: models with galactic winds describing dwarf galaxies and with infall representing disk galaxies. In order to settle constraints for star formation timescales in DLAs, we use the ratios [/Fe] and [N/] in the comparison to the predictions of the models. These ratios in DLAs are only partially reproduced by the disk and dwarf galaxy models suggesting that the DLAs come from a variety of morphological types of galaxies and not only one. They also imply a typically long timescale for the star formation in these systems.
Instituto Astronômico e Geofísico, USP, Av. Miguel Stefano 4200, 04301-904 São Paulo, SP, Brazil
1. Introduction
Much effort has been devoted to the study of chemical abundances in the DLAs in the last few years (Lu et al. 1996, Centurión et al 2000, Prochaska Wolfe 1999, Ellison et al. 2001, Molaro et al. 2001). Most of these works is new observational data with subsequent analysis, which is based in comparison to known patterns of abundance and abundance ratios, mainly the ones observed in our Galaxy. These studies have already revealed some important characteristics of the DLAs which gives us some clues about their nature: their metallicity, given generally by [Zn/H], lies in the range -2 to 0 (Vladilo 1998, Lauroesch et al. 1996) suggesting different epochs for DLAs formation or different star formation histories; there is no sign of evolution in the metallicity of DLAs from N(HI)-weighted Fe abundance (Prochaska Wolfe 1999, Prochaska Wolfe 2000), altought the metallicity content does decrease with redshift (Savaglio 2000); the [Zn/Fe] ratio is mostly above solar indicating the presence of dust depletion in these systems (Pettini et al. 1997); the [/Fe] pattern observed in DLAs roughly resembles that of metal-poor stars of our Galaxy (Pettini et al. 2000, Ellison et al. 2001), even though, there are some systems with values similar to those predictions by chemical evolution models for dwarf galaxies (Centurion et al. 2000, Molaro et al. 2001).
Among these works, however, just in a few of them chemical evolution models are used in the comparison to the observational data (Prantzos Bossier 2000, Matteucci et al. 1997). The predictions of the chemical evolution models are compared to absolute abundances (Prantzos Boissier 2000) and abundance ratios (Matteucci et al. 1997). The abundance ratios are better suited for chemical evolution studies because, unlike absolute values, they do not depend heavily on model assumptions, but mainly on the stellar nucleosynthesis and on the adopted IMF. The [/Fe] and [N/] ratios can be used to settle constraints for star formation timescales due to the different timescales for the formation of these elements. While the elements are produced mainly in type II Supernovae (SNe II) in short timescales, the iron peak ones and N are produced in SNe Ia and in intermediate massive stars (IMS) in a larger timescale. There is a controversy about the observed pattern of the [/Fe] ratio in DLAs: while some authors detected patterns similar to that of the metal-poor stars of our Galaxy (Pettini et al. 2000, Ellison et al. 2001), others found values that resemble the chemical evolution of dwarf galaxies (Centurion et al. 2000, Molaro et al. 2001). This discrepancy may be associated with dust depletion.
We use, in this work, one-zone chemical evolution models to represent the DLAs, which predictions are compared to [/Fe] and [N/] ratios. The abundance of Zn, Fe and Si are corrected for dust depletion and robust statistical methods are used to establish the trends of the data. In this way, we try to make a complete study of the DLAs chemical evolution embracing the most important aspects that might affect these kind of analysis.
2. The Chemical Evolution Models
Due to uncertainties about the nature of DLAs, two types of one-zone model are used in a first study about chemical enrichment in these systems. A model with infall of pristine gas is used to represent the disk systems and another one with galactic winds for dwarf galaxies.
2.1. The disk model
The disk model belongs to the class of the models with one infall episode of pristine gas. We used the basic equations for chemical evolution, with a star formation rate (SFR) similar to the one used by Matteucci François (1989), and a Salpeter IMF. The normalisation of the star formation law is made with the solar position at 8 kpc and a galaxy age of 13 Gyr. The stellar yields for intermediate mass stars (IMS) come from Renzini Voli, 1981 (hereafter RV81), models with = 0 and 1.5. The yields from van den Hoek Groenewegen (1997) for the IMS were also tested but the models with these yields produce less nitrogen than both = 0 and 1.5 models of RV81 and consequently are not applied in this DLAs study. The infall rate decreases with time and the infall timescale and superficial mass density profile vary with the galactic radius.
We run several models with different values of r: 2, 4, 8, 14, 18 kpc.
2.2. The dwarf galaxy model
The dwarf galaxy model belongs to the class of models with galactic winds. The majority of the models used here are similar to the classic ones, in which a wind is established in a time when the thermal energy of the gas exceeds the potential energy.
A galaxy with 1 Gyr is represented by the models here applied, but there is also a model which represents a galaxy with yr. The galaxy is inside a dark halo with a mass three times greater than the initial galaxy’s baryonic mass. The star formation is continuous with a SFR proportional to the present mass of gas and characterised by the specific star formation rate (the inverse of the star formation timescale), which varies in each model from 0.1 to 19 . It is adopted a Salpeter IMF between 0.1 and 100 M⊙.
Besides the classic models with wind, an early wind model (Friaça 2000) is applied. Friaça (2000) proposed differential winds, due to SNeII, in dwarf galaxies in order to explain the [ /Fe] below solar in the intercluster medium.
3. The Data
The observational data about the DLAs were collected from the literature and include chemical abundance (represented by [X/H]= - ) of a variety of elements ranging from N to Zn, observed in the redshift interval (for more details and references see Lanfranchi Friaça 2001, submited).
4. Analysis of the data
The observational data are analysed with robust statistical methods and compared to predictions of the chemical evolution models. In the statistical analysis we followed the approach described by Chiappini et al. (1999). We obtain, with the summary statistics of Cleveland Kleiner (1975), three lines that summarise the trend of the data: MM (midmean), LSMM (lower semi-midmean) and USMM (upper semi-midmean). The final plots represent locally weighted regression (lowess) smoothes of the summary lines.
The trend lines and the points distribution are then compared to the predictions of the models described above focusing the [/Fe] and [N/] ratios. Due to the [Zn/Fe] generally above solar in our sample, what may be an indication of the presence of dust in the DLAs, we corrected the abundances of Zn, Cr, Fe and Si by dust depletion. The correction is based in the depletion pattern observed in our Galaxy together with the observed [Zn/Fe] in each system analysed (see Lanfranchi Friaça 2001). The [Si/Fe] corrected for dust is then used as a tracer of the [/Fe] ratio in the comparison of the data to the predictions of the models, while [N/S] is used to represent the [N/] ratio. In this way, we obtain dust free (or almost free) tools to be compared with the models.
5. Application of the one-zone models to DLAs
5.1. Disk galaxy model
The disk models predictions for [/Fe] and [N/] ratio, using the RV81 yields with = 1.5, for different radius, r = 2, 4, 8, 14, 18 kpc compared to the observed values in DLAs are shown on the figure 1.
The observed [N/S] ratios with absolute values are centralised mainly between the lines for r = 4 and 14 kpc, with a large number of systems around the r = 8 kpc line, as indicated by the statistical trend lines. The lines trend are also similar to the models predicted behaviour: the ratio increases with [/H] rapidly in low metallicities and then becomes flatter.
The comparison between the observed [N/] in DLAs and the disk model predictions indicates that the observed values of this ratio represent a long timescale for the star formation in these systems for regions around the solar neighbourhood ().
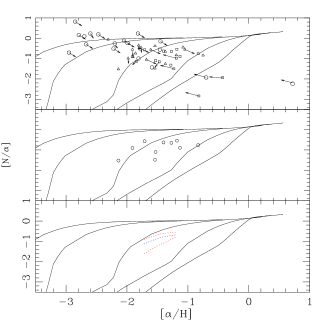

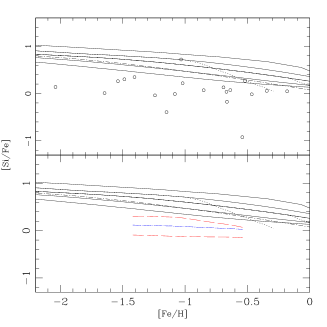
There is a discrepancy, however, when the corrected [Si/Fe] ratio is used in the comparison to the models. The region of the models with 14 - 18 kpc fits reasonably well the majority of the systems. The same behaviour is found for the statistical lines. They exhibit a trend similar to the models predictions and are located in the region around . Consequently, the comparison indicates that the observed values correspond to external regions () of disk systems, implying a long star formation timescale. A long and continuous star formation allows the iron peak group elements to be produced, giving rise to low values of [Si/Fe].
5.2. The dwarf galaxy model
On the figure 2, the comparison between the predictions of the dwarf galaxy models with different specific star formation rates and the [/Fe] and [N/] ratios are shown.
The predictions for [N/] are compared to the observed ratios both in DLAs and dwarf galaxies. The elements abundance is determined only by oxygen (circles) in dwarf galaxies while in DLAs sulphur (squares) and silicon (triangules) are also used to estimate it. The statistical lines are the same as on previous figure.
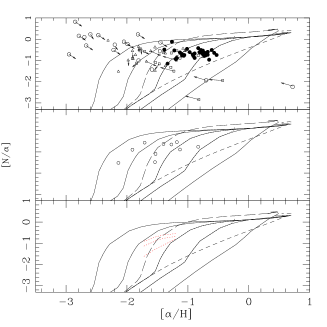
The observed [N/] in DLAs show a great dispersion, larger than that found for Galactic stars in the same range of metallicity and for dwarf galaxies. The different values of N/ for a given /H can be explained with the difference between the formation timescale of N and elements. This fact can be seen in models with diverse values of that go from almost quiescent star formation () to an extreme rapid one ( for systems with ). Most dwarf galaxies seem to require a specific star formation () between 0.3 and 3 , while the DLAs seem to need lower : for classic wind models and 1 for models with early wind. The models with galactic winds reproduce all dwarf galaxy points but are unable to match some DLAs that fall totally out of the region delimited by these models.
In the case of the dwarf galaxy models too, there is a difference when the [Si/Fe] ratios is used in the comparison to the models. While for the [N/S] ratio, most of the observed values are fitted by models with , most systems and the statistical lines lie below the [/Fe] predicted by any model. Only the upper semi-midmean (USMM - dotted line) goes near the model with = 0.1 . This fact implies a specific star formation , which represents a long star formation timescale.
6. Conclusions
The comparison between the one-zone chemical evolution models for dwarf and disk galaxies and the observational data indicates that these models are able to reproduce only partially the [N/] and [/Fe] observed in DLAs. This fact suggests that these systems may represent various types of galaxies and not a single one. The observed abundance ratios also require long star formation timescale in both models. The discrepancy between the comparisons using [N/] and [/Fe] might be related to an underestimated correction for Si.
References
Centurión M., Bonifacio P., Molaro P. & Vladilo G. 2000, ApJ, 536, 540
Chiappini C., Matteucci F., Beers T.C. & Nomoto K. 1999, ApJ, 515, 226
Cleveland W.S. & Kleiner B. 1975, Technometrics, 17, 447
Ellison S.L., Lewis G.F., Pettini M., Sargent W.L.W., Chaffee F.H. & Irwin M.J. 1999, astro-ph 9903063
Friaça A.C.S. 2000, in Dwarf Galaxies and Cosmology, Proceedings of the XXXIII Recontres de Moriond, Y.T. TRINH, C. BALKOWSKI, CAYETTEV, J.T.T. VÂN, Paris, Editions Frontières, p.312
Lanfranchi G.A. & Friaça A.C.S. 2001, submited to MNRAS
Lauroesch J.T., Truran J.W., Welty D.E. & York D.G. 1996, PASP, 108, 641
Lu L., Sargent W.L.W., Barlow T.A., Churchill C.W. & Vogt S. 1996, ApJS, 107, 475
Matteucci F., Molaro P. & Vladilo G. 1997, AAp, 321, 45
Matteucci F., & François P., 1989, MNRAS, 239, 885
Molaro P., Bonifacio P., Centurión M., Vladilo G., D’Odorico S., Levshakov S.A. 2001, astro-ph
Pettini M., Ellison S.L., Steidel C.C., Shapley A. E. & Bowen D.V. 2000, ApJ, 532, 65
Pettini M., King D.L., Smith L.J. & Hunstead R.W., 1997, ApJ, 478, 536
Prantzos N. & Boissier S. 2000, MNRAS, 315, 82
Prochaska J.X., Naumov S.O., Carney B.W., McWilliam A. & Wolfe A.M. 2000, astro-ph 0008075
Prochaska J.X. & Wolfe A.M. 1999, ApJS, 121, 369
Prochaska J.X. & Wolfe A.M., 1997, ApJ, 487, 73
Renzini A. & Voli M. 1981, A&A, 94, 175
Savaglio S., Panagia N. & Stiavelli M. 1999, astro-ph 9912112
Van Den Hoek L.B. & Groenewegen M.A.T. 1997, AASS, 123, 305