FUSE Observations of U Geminorum During Outburst and Decline
Abstract
We have obtained FUV (904 – 1187 Å) spectra of U Gem in outburst with FUSE. Three of the observations were acquired during the plateau phase of the outburst, while the fourth was obtained during late outburst decline. The plateau spectra have continuum shapes and fluxes that are approximated by steady-state accretion disk model spectra with . The spectra also show numerous absorption lines of H I, He II, and two- to five-times ionized transitions of C, N, O, P, S and Si. There are no emission features in the spectra, with the possible exception of a weak feature on the red wing of the O VI doublet. The absorption lines are narrow (FWHM 500 km s-1), too narrow to arise from the disk photosphere, and at low velocities (700 km s-1). The S VI and O VI doublets are optically thick. The absorption lines in the plateau spectra show orbital variability: in spectra obtained at orbital phases , low-ionization absorption lines appear and the central depths of the pre-existing lines increase. The increase in line absorption occurs at the same orbital phases as previously observed EUV and X-ray light curve dips. If the absorbing material is in (near-) Keplerian rotation around the disk, it must be located at large disk radii. The final observation occurred when U Gem was about two magnitudes from optical quiescence. The spectra are dominated by emission from an 43,000 K, metal-enriched white dwarf (WD). The inferred radius of the WD is , close to that observed in quiescence. Allowing for a hot heated region on the surface of the WD improves the fit to the spectrum at short (960 Å) wavelengths.
To appear in the Astrophysical Journal.
1 Introduction
Cataclysmic variables (CVs) are mass-exchanging binary systems in which a late-type donor star transfers mass to a white dwarf (WD). Dwarf novae (DN) are CVs that undergo semi-regular outbursts, brightening by 3 – 5 visual magnitudes. The outbursts last from about a day to several weeks, depending on the system. Mass exchange in DN is regulated by an accretion disk around the WD. The outbursts are triggered by a thermal instability in the accretion disk that drives the disk from a low temperature, low mass accretion rate () quiescent state to a hot, high- outburst state. The properties of CVs, including DN, have been reviewed in detail by Warner (1995).
In the “standard” theory of disk accretion in DN (see, e.g., Lynden-Bell & Pringle 1974), half of the accretion energy is radiated away by the disk and half by a boundary layer (BL) between the disk and the slowly- or non-rotating WD. In quiescence, when the mass accretion rate is low, the disk is believed to be cool (T 8000 K) while the boundary layer is very hot (T K) and optically thin. Neither is expected to contribute substantially to the ultraviolet (UV) flux, which instead should be dominated by emission from the WD. In outburst, the disk and the BL become optically thick, and the accretion disk is expected to be the principal UV emitter (T K and T K). In addition to continuum emission from the thermalized disk, many CVs, including novalikes and DN in outburst, show blueshifted UV absorption that indicates the presence of strong, fast winds from the disk or the WD (e.g., Heap et al. 1978; Holm, Panek & Schiffer 1982; Córdova & Mason 1982).
The first CV to be discovered, U Gem remains the prototypical DN and among the best studied. It goes into outburst about every 118 days and brightens by 5 magnitudes; the outbursts have a mean duration of 12 days (Szkody & Mattei, 1984). U Gem has an orbital period of 4.25 hrs; the masses of the WD (1.1 ), the mass donor star (0.4 ), and the inclination () are well determined (Smak, 1976; Sion et al., 1998; Long & Gilliland, 1999). Its distance (96.44.6 pc) is known accurately as a result of astrometric determination with the FGS on HST (Harrison et al., 1999). U Gem system parameters adopted for this study are given in Table 1.
In most respects, U Gem’s observational characteristics hew to the simple theoretical picture for DN outlined above. In outburst, the UV spectrum is consistent with that expected from a steady-state accretion disk with (; Panek & Holm 1984). In quiescence, its UV spectrum is well fit by WD models with a temperature of 30,000 K far from outburst (Panek & Holm, 1984; Long et al., 1993). Its X-ray/EUV outburst spectrum is soft, with a characteristic temperature of 140,000 K (Córdova et al., 1984; Córdova & Mason, 1984; Long et al., 1996), while in quiescence the X-ray spectrum hardens and can be fit in terms of a thermal plasma with a temperature of 5 – 10 keV ( – ; Szkody et al. 1996). Furthermore, in U Gem there is observational verification that the BL and accretion disk luminosities are comparable in outburst (Long et al., 1996).
U Gem’s X-ray and EUV light curves show dips around orbital phase 0.7 akin to the X-ray “dippers” in low mass X-ray binaries. These dips indicate the presence of absorbing material located well above the disk plane and are seen in both outburst and quiescence (Mason et al., 1988; Long et al., 1996; Szkody et al., 1996). Other interesting characteristics of U Gem include the fact that the WD appears to cool from an average temperature of 38,000 K shortly after outburst to 30,000 K several months later (Kiplinger, Sion & Szkody, 1991; Long et al., 1994a). The UV flux does not decline as much as expected for this drop in temperature. Long et al. (1993) suggested that an “accretion belt” may exist on the WD, a region hotter than the bulk WD temperature; it is this belt, rather than the entire WD, that cools during quiescence (see also Cheng et al. 1997). Models of the WD spectrum in U Gem have also indicated WD surface abundances that show evidence of CNO processing (Sion et al., 1998; Long & Gilliland, 1999).
Because U Gem’s observational behavior tallies well with the basic theoretical underpinnings of DN accretion, U Gem is an excellent target for in-depth analyses of the physics of accretion in disk-fed systems and the evolution of DN phenomenology during the outburst cycle. The far-ultraviolet (FUV) provides an excellent viewing window for such analyses. The continuum FUV in outburst is dominated by emission from the innermost regions of the accretion disk, near the WD, while the numerous FUV spectral lines are probes of the temperature and ionization structure of the disk, the winds, and other regions in the binary, such as the source of the X-ray absorption dips.
We have obtained FUV spectra of U Gem at the peak and through the decline of its 2000 March outburst using the Far Ultraviolet Spectroscopic Explorer (FUSE; Moos et al. 2000). The spectra cover a 904 – 1187 Å wavelength range at spectral resolutions of 12,000. We report here the results of those observations. The observation log and our approach to reducing the data are described in §2. The basic characteristics of the FUV spectra are described in §3. Analysis of the continuum and lines in the spectra from outburst plateau are addressed in §4, while the spectrum in late outburst decline is analyzed in §5. Discussion of the results and concluding remarks are presented in §6 and §7.
2 The Observations and their Reduction
We observed U Gem in the LWRS () aperture of FUSE on 2000 March 5, 7, 9 and 17. An observation log, including the binary orbital phases observed, is given in Table 2. Thanks to prompt notification by the AAVSO and deft scheduling by the FUSE operations team, we were able to acquire the first spectrum of U Gem about 1.5 days after U Gem reached outburst maximum. The relationship between the FUSE observations and the optical light curve reported by the AAVSO is shown in Figure 1. The first observation was obtained at peak visual brightness of the outburst; the second and third were obtained during the outburst plateau; and the last observation was obtained near the end of the outburst, about 2 days before U Gem returned to its quiescent visual magnitude. The full outburst lasted 18 days.
The FUSE telescope collects data simultaneously in four optical channels. Each channel covers a portion of the FUSE wavelength range (905 – 1187 Å). The data are written to eight segment spectra that partially overlap in coverage and, taken together, cover the full wavelength range with some redundancy. Our first three observations were acquired in the “spectral image” mode, since U Gem was projected to be too bright for “time-tag” observations. The final observation, which took place when U Gem was known to be fading, was acquired in time-tag mode. The FUSE instrument and its on-orbit performance are described in detail by Sahnow et al. (2000) and in the FUSE Observers Guide.
The Obs. 1 – Obs. 3 data products consisted of multiple flux calibrated spectra with 500 – 700 sec exposure times, spaced irregularly over the binary orbit. We used spectra processed by the FUSE data reduction pipeline (CALFUSE V. 1.6.8), but updated the calibration solutions with efficiency curves and wavelength solutions from the pipeline V. 1.8.7. The number of spectra (not including their division into segments) and their exposure times in each of Obs. 1 – Obs. 3 are noted in the comments to Table 2.
For each of the Obs. 1 – Obs. 3 exposures, we created continuous spectra by “stitching” the data from the eight segments into one. We made each combined spectrum by specifying a linear (0.07 Å) dispersion for the output spectrum and averaging all input data that fell within a given output wavelength bin. Each input datum was weighted by the sensitivity of its pixel of origin. We masked out data for which the flux calibration was uncertain — specifically, data affected by the “worm”, an instrumental artifact that disrupts the LiF1B segment for Å; see the FUSE Data Handbook v. 1.1 for more information. Depending on the placement of the target in each of the four channel apertures, there can be offsets in the absolute wavelength zero points among data from different channels. We corrected for the offset in our observations before averaging by shifting data from the two SiC channels by 0.15 Å to align them with the LiF data.
We also excluded data from the mean spectra that were affected by channel drift. FUSE guides on only one of its four channels (LiF1, which covers 987 – 1082 Å and 1094 – 1188 Å). Thermally-induced motions of the channel mirrors can lead to problems with co-alignment of all four channels during some observations, causing loss of data. Channel misalignments worsened over the course of our program: while none of the channels were misaligned during Obs. 1, all three non-guided channels drifted during Obs. 4. Any segment that showed evidence of channel drift — based on the target flux in that channel relative to the flux in channel LiF1 over the region of overlapping wavelength coverage — was discarded, leading to some loss of data and wavelength coverage, particularly below 1000 Å, in the Obs. 2 – Obs. 4 spectra. Finally, we combined all the exposures from each observation to create time-averaged spectra. The time-averaged spectra of Obs. 1 – Obs. 3 are shown in Figures 2 – 4. Based on the FWHM of the interstellar lines, we estimate that the spectral resolution of our combined segment spectra is 0.1 Å.
We reduced the Obs. 4 data using a slightly different procedure. Since the data were acquired in time-tag mode, we were able to correct for channel drift, which was severe, by directly eliminating data acquired when a channel was not properly aligned. We started with the raw, photon-counting data and re-extracted the spectra (using CALFUSE V. 1.8.7) in 300 sec exposures. We determined which of the segment spectra were usable by examining the raw count rate light curves in each channel, and we combined the good segments to create continuous spectra at 0.07 Å dispersion. As with the Obs. 1 – Obs. 3 data, we weighted the means by effective area, masked out the “worm”, and offset the SiC channel wavelengths by 0.15 Å before combining.
The Obs. 4 spectra are much fainter than those of Obs. 1 – Obs. 3, and are clearly dominated by the WD (see §3 and §5). Therefore, before creating a time-averaged spectrum of Obs. 4, we corrected for the smearing of the WD spectrum caused by the orbital radial velocity variations of the WD. The orbital period and the radial velocity curve of the WD in U Gem are known to high accuracy (Marsh et al., 1990; Long & Gilliland, 1999). Using these, we shifted each of the 300 sec spectra in wavelength to place them at a common velocity, the -velocity of the WD. We then averaged the shifted spectra to create the time-averaged spectrum of Obs. 4 shown in Figure 5. We did not mask out non-moving features from interstellar absorption and airglow when creating the time-averaged spectrum, so these lines have been smeared out in the spectrum shown in Figure 5.
3 The Spectra
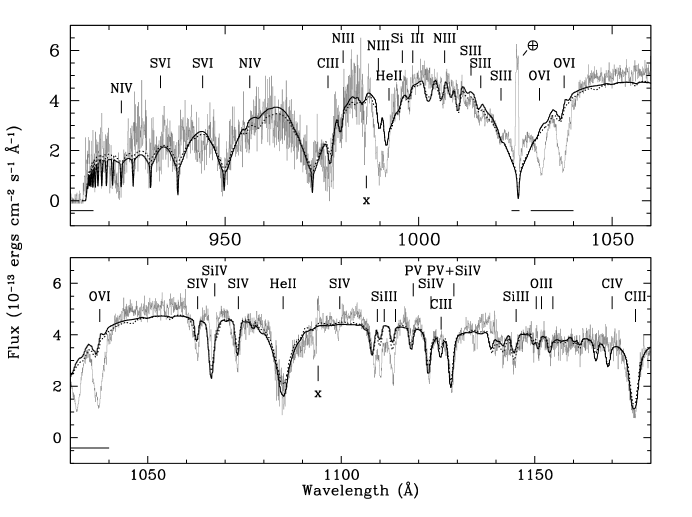
The time-averaged spectra of Obs. 1 – Obs. 3, acquired during peak and plateau of the optical outburst, look similar. Specifically, the continua rise from zero at the Lyman limit to a peak flux near 1005 Å and decline slowly at longer wavelengths. The spectra show a wealth of absorption features. With the exception of a possible emission wing on the long wavelength side of the O VI doublet, there are no emission lines in the spectra. (He II 1084 Å shows an apparent emission feature, but it is a data reduction artifact: poor flux calibration at the edges of three segments led to spurious increases in the flux around this line.)
The spectra also show numerous very narrow (FWHM 25 km s-1) absorption lines. Their widths are of order the estimated resolution of FUSE LWRS spectra (20 – 25 km s-1), which suggests that these lines are unresolved (with the exception of the narrow H I lines, which have FWHM 40 km s-1). These narrow absorption lines do not vary in velocity or equivalent width over the observations. The same transitions have been observed on lines of sight to other stars (e.g., Morton 1978), all of which indicates that the lines are purely interstellar. Unlike the majority of FUSE spectra (Shull et al., 2000) and consistent with its proximity, interstellar molecular hydrogen absorption features do not appear in the spectra of U Gem.
The absorption lines intrinsic to U Gem (i.e., not interstellar) in Obs. 1 – Obs. 3 include transitions of H I, He II, and numerous metal lines in a range of ionization states, including lines of C III, N III, Si III, S III, N IV, Si IV, S IV, O VI and S VI. The H I lines comprise the Lyman series from Ly Å in the red to at least the 1-9 transition of H I at 923.15 Å, which is the last H I line that can be individually distinguished. There is evidence that H I line absorption continues all the way to the Lyman limit, however, in that the spectra vary at 920 Å in the same way that the spectral lines, but not the continuum, vary at the longer wavelengths (see §4.2). The He II lines in the spectra include He II 1084.9 Å, 992.4 Å and 958.7 Å. Two other He II absorption lines, 972.1 Å and 1025.3 Å, are probably present but are blended with H I. Unlike the H I absorption, the He II absorption does not persist to the shortest wavelengths, as the He II lines at 942.5 Å and 927.9 Å, unblended with H I, are not seen in the spectra.
Based on low-order spline fits to the line-free regions of the time-averaged spectra, the FUV continuum dropped by 8% – 10% between Obs. 1 and Obs. 2 and 12% – 14% between Obs. 2 and Obs. 3. The peak flux (at 1005 Å) is ergs cm-2 s-1 Å-1 in Obs. 1, ergs cm-2 s-1 Å-1 in Obs. 2 and ergs cm-2 s-1 Å-1 in Obs. 3. (The uncertainty in the FUSE flux calibration is estimated at 15%; FUSE Data Handbook, V. 1.1.) The shape of the continuum is the same in all three observations: the continuum decline was gray. The continuum does not vary much within a given observation. To quantify this, we examined spectra from the LiF1 channel. This is the guide channel for FUSE, and its spectra are unaffected by changes in channel alignment. Measurements of the mean continuum flux in a line-free region (1045 – 1055 Å) of the spectra indicate little continuum variation: none of the 500 – 700 sec spectra in each observation are more than 3% from the overall observation mean, and the standard deviation of the individual spectra means about the overall mean is 2%.
U Gem had faded at UV wavelengths by Obs. 4. The time-averaged spectrum peaks at 1000 Å at ergs cm-2 s-1 Å-1, a factor of 30 below the Obs. 3 peak flux. Low-ionization lines of He II, C III, N III and Si III, as well as Si IV, are more prominent in Obs. 4 than in the previous observations. In addition, a number of low-ionization lines not seen in Obs. 1 – Obs. 3 are present in Obs. 4, including C III 1125.6 Å, Si III 1144.3 Å, the O III triplet at 1150 Å– 1154 Å, and C IV 1169 Å.
The Obs. 4 spectrum is similar to a Hopkins Ultraviolet Telescope (HUT) spectrum of U Gem acquired 11 days after the end of an outburst of similar duration (Long et al., 1993). The fluxes in the FUSE spectrum are about 30% higher than in the HUT spectrum, which, for example, has a flux at 1000 Å of ergs cm-2 s-1 Å-1. The quiescent HUT spectrum of U Gem was well fit by WD model atmosphere spectra. The similarity between the FUSE and HUT spectra indicates that the Obs. 4 FUSE spectrum is also dominated by the WD, a point that will be addressed in detail in §5.
The Obs. 4 continuum fluxes did not vary over the course of the observation. The mean flux in the time-averaged spectrum is ergs cm-2 s-1 Å-1 in a line-free region, 1045 – 1055 Å. None of the 300 sec spectra have a mean flux in that region more than 4% from the time-averaged mean; the standard deviation of the (1045 – 1055 Å) means in the individual spectra with respect to the overall mean is 2.6%. An examination of count rates from the raw data files also shows insignificant continuum variability on 10 sec time scales in Obs. 4.
Line identifications, EWs, and FWHM for the FUV lines intrinsic to U Gem are given for the time-averaged Obs. 1 and Obs. 4 spectra in Table 3 (the EWs and FWHM for Obs. 1 are representative of those found for Obs. 2 and Obs. 3). Line identifications, oscillator strengths, and EWs of the prominent interstellar lines in the U Gem spectrum are given in Table 4. The absorption line parameters were found by fitting Gaussian profiles to the lines using the IRAF task splot. The EWs for the interstellar lines were obtained primarily from the Obs. 1 time-averaged spectrum. A few of the interstellar lines (particularly those in the 1000 – 1050 Å range, where all four optical channels contribute to the data) were remeasured in individual segment spectra to minimize uncertainties caused by slight differences in the wavelength solutions of the individual channels.
4 The Outburst Plateau: Obs. 1 – Obs. 3
4.1 The Accretion Disk Continuum
In outburst, the UV continua of DN are dominated by emission from the accretion disk. The slopes of the UV continua resemble those expected from steady state disks modelled as appropriately-weighted sums of blackbodies or stellar spectra. Since the predicted continuum shapes vary, one can in principle use such models to determine the mass accretion rate in the inner portion of the disk. In the case of U Gem, Panek & Holm (1984), using IUE spectra, estimated a mass accretion rate equal to = , or . More recently, Sion et al. (1997), using a GHRS data set of high spectral resolution but limited wavelength coverage, found = . Neither of these observations extended below 1200 Å, however. Observations at the longer UV wavelengths sample the Rayleigh-Jeans side of the blackbody curve for the typical peak disk temperatures in outburst (50,000 K) and, as a result, small changes in spectral slope result in large changes in the estimated mass accretion rate.
Our FUSE spectra probe the short FUV wavelengths where the shape of the spectrum is presumably a more sensitive tracer of the mass accretion rate through the inner disk. Therefore, we generated disk model spectra to test whether disk model fits to the FUV spectra of U Gem in outburst are consistent with those fit at longer wavelengths. Because we have outburst observations from three epochs, we can also test whether the disk shows changes in its structure on decline from outburst. We synthesized the model accretion disk spectra using the model atmosphere and spectral synthesis codes of Hubeny, TLUSTY and SYNSPEC (Hubeny, 1988; Hubeny, Lanz & Jeffery, 1994). Model spectra of steady-state accretion disks were constructed from summed, area-weighted, Doppler-broadened spectra of stellar atmospheres of the appropriate effective temperature and gravity for each disk annulus (see Long et al. 1994b for a detailed description of this procedure).
For modelling the spectra, we assumed an inclination angle , E(B–V) = 0, and = . The neutral hydrogen column density was found by a curve of growth analysis of the UV interstellar lines (see Appendix A; the assumed column density affects only the cores of the Lyman series lines, so our fits are actually insensitive to the chosen value of .) The fits have two variables: a mass accretion rate, , and an overall normalization, which is 1 for a distance of 96 pc. Since there are many relatively narrow features in the spectra, originating both in the interstellar medium and in U Gem, we adopted a modified approach. Specifically, we first attempted to fit all of the data in the spectrum. We then discarded for the purpose of fitting all data points that deviated by more than from the model and refit the data. This process effectively discards the most discrepant points, is relatively unbiased, and produces fits that, to the eye at least, model the portions of the data we expect be able to model in this manner. (This approach also has the advantage that one can easily handle more complex models than the one being considered here, and that, in our case, the results were also insensitive to the exact cutoff value for rejecting data points that was chosen.)
The “best fit” disk model to the Obs. 1 spectrum is shown in Figure 6. The model spectrum resembles the shape of the observed spectrum, including the broad H I absorption at 1025 Å. The main model failure is at the shortest wavelengths, where it under-predicts the flux. The mass accretion rate in the model is and the normalization is 0.83. This mass accretion rate is similar to that determined from the data longward of Ly. Although the normalization formally suggests a distance about 10% greater than the astrometric distance, this is actually an indication that the spectral shape and the normalization are in pretty good agreement. This was not guaranteed. Model fits to spectra taken with HUT have shown that when the observed FUV peak and downturn in flux to the Lyman limit are included, steady-state disk models are often unsuccessful at replicating both the shape and the fluxes of disk spectra (Long et al., 1994b; Knigge et al., 1997).
Similar fits to the data from Obs. 2 and Obs. 3 produced similar results. This was expected from the fact that the spectra themselves are nearly identical, and the small changes in the model parameters are not in our view indicative of a change in the mass accretion rate. The best fit model for Obs. 2 had a nearly identical of and a normalization of 0.77, while Obs. 3 yielded of and a normalization of 0.95.
As noted, the primary problem with all of the models occurs shortward of 950 Å. It is not clear whether this is a problem in the disk models or whether a second source of emission is indicated. The disk models being used are created by summing spectra for atmospheres of stars, rather than summing the specific intensities for the inclination angle of U Gem. In addition, the effective gravity varies with height above the disk. It is possible that spectral syntheses using somewhat more realistic models could resolve this discrepancy, but at present such models do not exist . We also note that we have not allowed for a boundary layer, and in U Gem we know, based on EUVE observations (Long et al., 1996), that the boundary layer is luminous. Long et al. (1996) estimated the color temperature of the boundary layer to be 138,000 K, with a size comparable to the WD radius near the beginning of the outburst. A 138,000 K, optically thick boundary layer with a size of cm (Long et al., 1996) would contribute 25% of the observed flux in Obs. 1 at 915 Å but only 13% at 1180 Å. Re-radiation of boundary layer emission from the disk could also increase the effect of the boundary layer at the shortest wavelengths.
4.2 Orbital Variability in the Absorption Line Spectrum
Obs. 1 – Obs. 3 indicate that U Gem has a rich absorption line spectrum while on outburst plateau, with the spectra showing transitions of H I, He II and two- to five-times ionized transitions of C, N, O, P, S and Si. The absorption lines are relatively narrow, with FWHM ranging from 250 – 850 km s-1. (The FWHM given for Obs. 1 in Table 3 are for the time-averaged spectrum and are therefore affected by orbital smearing of the line profiles. Nevertheless, the FWHM given are fairly representative of the FWHM in the individual spectra, which typically have line widths within 100 km s-1 of the values in Table 3.)
With the exception of O VI (see §4.3), the lines are smooth, roughly Gaussian, and show little or no structure. There are no emission features or P Cygni line profiles in any of the spectra, except for O VI 1038 Å, which shows apparent weak emission to the red of the absorption line. The line ratios in the S VI 933,945 Å and O VI 1032,1038 doublets are 1:1, indicating that these lines are optically thick. Neither these lines nor any of the absorption lines in the spectra become dark (i.e., drop to zero flux) in their line cores, suggesting that the line absorption region does not completely cover the FUV continuum source (assuming that the source function of the absorbing material is negligible compared to that of the background continuum source).
The absorption lines are at low velocity: in none of the spectra are the line centers more than 700 km s-1 from their rest positions. The absorption lines shift in velocity over the binary orbit. The shift is in phase with the motion of the WD; Figure 7 shows the velocities of the line centers versus orbital phase for several absorption lines. The amplitude of motion of the WD, shown in Figure 7 and measured from narrow WD absorption lines in GHRS quiescent spectra of U Gem, is K1 = 107.1 km s-1 (Long & Gilliland, 1999). While the absorption line centers show much the same range of motion as the WD at some orbital phases, many of the lines are blueshifted in excess of the WD motion around phase 0.25, and all of the lines are redshifted in excess of the WD motion around phase 0.75. The peak redshift exceeds the WD velocity by 400 km s-1. S VI and O VI show a different range of motion in their line centers from the other metal lines: they are not as redshifted around orbital phase 0.75 but are more blueshifted (150 km s-1) around phase 0.25. Because the velocities of their line centers are obscured by interstellar H I absorption, H I lines are not shown on Figure 7, but at those orbital phases where their minima are well separated from the interstellar lines, the H I velocities are consistent with those of the lower ionization metal lines.
From Obs. 1 – Obs. 3, the absorption lines show little day-to-day change in their properties. Specifically, spectra acquired at the same orbital phase but in different observations are comparable in their absorption line shapes, velocities and EWs. Variability in the absorption lines on shorter timescales—namely, correlated with the orbital phase—is seen in all three observations, however. In particular, those spectra acquired roughly between orbital phases 0.5 and 0.8 show an increase in the strength and richness of the absorption line spectrum compared to spectra acquired over the rest of the orbit. This is illustrated in Figure 8 for Obs. 1. The upper panel of this figure shows two spectra, one from orbital phases 0.46 – 0.50 and the other from 0.54 – 0.58. The lower panel shows the ratio of the latter to the former spectrum, and demonstrates that nearly all of the lines are affected but none of the continuum is affected, as if an additional absorbing layer had been placed in front of the UV source. The same orbital behavior is seen in Obs. 2 and Obs. 3.
The change in the absorption lines manifests itself as an increase in the central depth of each line with little or no increase in the line FWHM. The increase in the absorption line depth is seen in every absorption line in the spectrum, with the exception of the interstellar lines and the O VI doublet. In addition, a number of lines that are not seen or are only weakly present in the spectra at other orbital phases appear in phases 0.5 – 0.8. These include transitions of He II, C III, N III, S III and Si III. The increase in the line depth is not accompanied by any change in the FUV continuum flux, although as mentioned previously, the flux 920 Å drops, which we believe to be due to increased H I line absorption near the Lyman limit. The increase in the strength and richness of the absorption spectrum, unaccompanied by any change in the continuum flux, suggests that the absorbing source has no continuum opacity. We also know from their doublet ratios that at least some of the absorption lines are optically thick but not dark in their line cores. If the absorbing source is a pure absorber — i.e., has a zero source function — than the increase in line absorption at these phases indicates an increase in covering factor of the continuum (the inner disk).
None of Obs. 1 – Obs. 3 had full orbital phase coverage and the orbital phases observed varied, with incomplete overlap between observations. As a result, we cannot precisely determine the orbital range over which the increase in the line absorption is seen. For the data in hand, however, the excess line absorption is only seen in spectra obtained after orbital phase 0.53 and before phase 0.79.
4.3 The O VI Doublet
The behavior of the O VI 1032,1038 doublet is different from the other absorption lines in the FUV outburst spectra of U Gem. First, the O VI lines are the only lines to show structure in their profiles. The line shapes vary dramatically from spectrum to spectrum; Figure 9 shows, for example, the O VI spectra from Obs. 3. In many spectra, the O VI lines develop what appears to be narrow (100 km s-1), blueshifted ( km s-1) dips superimposed on the broader absorption. Obs. 1 shows such dips in 4 of its 5 spectra. Eleven of the 15 spectra in Obs. 3 show dips, but oddly, none of the Obs. 2 spectra show dips — the O VI line profiles are smooth throughout Obs. 2. Although the velocities of the dips can shift by up to 50 km s-1 from spectrum to spectrum, the shifts in velocity are not correlated with the orbital motion of the binary. Many of the spectra show two dips in each O VI line. O VI 1038 Å is coincident with two interstellar lines, but leaving aside distortions in its line shape caused by the interstellar lines, both O VI 1032 Å and 1038 Å have the same profile in any given spectrum.
Second, as mentioned previously, O VI 1038 Å is the only line in the spectrum that shows any sign of an emission feature, in the form of a weak bump to the red of the absorption component of the line. The strength of the emission feature can vary from spectrum to spectrum: contrast, for example, the size of the feature in the phase 0.10 – 0.12 spectrum versus that of phase 0.53 – 0.56 in Figure 9. There is no correlation in the strength of the red emission feature with orbital phase (although it is weakest in the two Obs. 1 and Obs. 3 spectra acquired at orbital phase 0.5), nor is its strength correlated with the shape of the absorption component of the line.
Finally, while all of the other lines in the Obs. 1 – Obs. 3 spectra show an increase in their central absorption depths over orbital phases 0.53 – 0.79, the O VI lines do not become deeper at these phases. They do become broader in FWHM and FWZI (on their red wings) at these phases, however.
4.4 Line Variability in Archival HST Spectra of U Gem in Outburst
U Gem was observed at high spectral resolution over a limited wavelength range with the GHRS on HST during two outbursts in 1995 April and September (Sion et al., 1997). The first spectrum, obtained when U Gem was on early decline from outburst, is essentially featureless. The second spectrum, obtained at the peak of the subsequent outburst, shows narrow (FWHM = 460 – 640 km s-1), low velocity N V 1238,1242 Å and He II 1641 Å absorption lines superimposed on broad (FWZI 2900 km s-1) emission features. Although the HST spectra show emission components that are not seen in the FUSE spectral lines, the shapes and widths of the HST absorption features are consistent with those of the absorption lines in Obs. 1 – Obs. 3.
We retrieved the GHRS data set from the HST archive to see whether the orbital phase-dependent absorption line variations seen in the FUSE spectra are also present in the HST spectra. The HST observations of He II 1641 Å cover the orbital phases 0.55 – 0.70 and 0.93 – 0.96 and therefore include the orbital phases at which the increased line absorption is seen in the FUSE spectra. We divided the HST observations into six spectra of 465 sec integration time each to replicate the time resolution of our Obs. 1 – Obs. 3 spectra.
The spectra of He II 1641 Å at orbital phases 0.64 – 0.67 and 0.93 – 0.96 are shown in Figure 10. Like the absorption lines in the FUSE Obs. 1 – Obs. 3 spectra, the absorption core of the He II feature is deeper at mean orbital phase 0.655 than at mean phase 0.945. The He II absorption line is relatively shallow in the first spectrum ( = 0.56), but it deepens steadily in subsequent spectra, reaching its deepest level in the = 0.655 spectrum shown. Between = 0.56 to = 0.655, the absorption line shifts to the red by 260 km s-1, a shift well in excess of the WD’s radial orbital velocity motion. The penultimate spectrum ( = 0.68) also shows a relatively deep absorption line, but by = 0.945 the absorption component of He II 1641 Å has reverted to the shallow depth seen at = 0.56. The increase in the central depth and velocity of the He II Å absorption line during orbital phases 0.58 – 0.70 shows that the orbital variability in line absorption seen in our FUSE spectra is not unique to the 2000 March outburst of U Gem: the 1995 September outburst observed by HST shows a similar variability.
We also examined the N V 1238,1242 Å GHRS spectra, which were acquired over orbital phases 0.79 – 0.94. These spectra show no variations in the absorption or emission components of the doublet beyond low-level secular variability. N V was not observed at the orbital phases at which absorption line depth changes are seen in the FUSE spectra, however. We also note that while the HST spectra show no Si III 1293–1303 Å features, these observations were acquired between phases 0.1 – 0.3, when Si III absorption was also absent from the FUSE spectra; thus, their absence from the HST spectra may result from the orbital phase of observation, rather than a true absence of Si III during any portion of that outburst.
One interesting feature of the He II Å orbital variability is that the absorption line core terminates roughly at the level of the continuum in phases 0.55 – 0.58 and 0.90 – 0.92, but drops well below the continuum in phases 0.58 – 0.70. In contrast, the N V absorption is much deeper than the continuum throughout its observation. Finally, unlike in the FUSE spectra, where most of the absorption lines become stronger as well as deeper at orbital phases 0.53 – 0.79, the He II 1641 Å absorption component narrows as it deepens, so that the = 0.56 and 0.945 spectra actually show the largest EWs and absorption line fluxes. Whether this change in the FWHM in He II Å is secular or related to the increased line depth is unclear given the limited data set.
5 The Decline Phase of the Outburst — The WD Exposed
5.1 One- and Two-Temperature WD Model Fits
As noted in §3, the spectra of U Gem in Obs. 4 differ from those of Obs. 1 – 3, but are similar to a post-outburst HUT spectrum of U Gem obtained 11 days after the return to optical quiescence (Long et al., 1993). The HUT spectrum was well fit in terms of emission from the metal-enriched photosphere of a WD with an average temperature of 38,000 K. The resemblance of the Obs. 4 spectra to the HUT spectrum suggests that the WD is the dominant source in Obs. 4. To test this, we fit model WD spectra to the Obs. 4 time-averaged spectrum. The model spectra were created using TLUSTY and SYNSPEC (Hubeny, 1988; Hubeny, Lanz & Jeffery, 1994; Hubeny & Lanz, 1995). In this initial attempt, we generated LTE model atmospheres and from them constructed synthetic spectra on a fine wavelength scale ( Å). These were subsequently convolved with a Gaussian (FWHM = 0.15 Å) to replicate the resolution of the Obs. 4 spectrum. The model spectra covered a range of WD temperatures from 20,000 K 95,000 K, and gravities from 7.5 9.5. We tested WD rotation rates of 100 km s-1 and 200 km s-1. (Sion et al., 1994, 1998). We adopted a neutral hydrogen column density of = (see Appendix A) and tested reddening values of E(B–V) = 0 and 0.03, according to the reddening law of Seaton (1979). For the metal lines, we tested both solar abundances and the abundances from Long & Gilliland (1999): a C abundance of 0.1 solar, Si and Al abundances of 0.4 solar, and a N abundance of 4 times solar. The model spectra were fitted to the data by least-squares minimization. We masked out the Ly airglow and the O VI absorption lines; the latter are not expected to originate on the WD unless its temperature is much higher than anticipated for U Gem. Finally, since the model spectra are at zero velocity, we shifted the Obs. 4 spectrum by km s-1 before fitting to remove the recessional velocity of the WD (Long & Gilliland, 1999).
The best-fit single-temperature WD model for these parameters is shown as the solid line in Figure 11. The temperature of the WD is 43,410 K, the gravity is , the WD rotation rate is 200 km s-1, and the metal abundances are solar. For the model shown, the reddening is E(B–V) = 0.03. The WD model is a good qualitative (though not statistical: = 5.67) fit to the spectrum. The shapes of the continuum and the H I absorption lines are reasonably well reproduced by the model. The model also reproduces the He II and metal lines well. Virtually all of the lines that are present in the observed spectrum are also present in the model, except the N IV blend at 923 Å and the S VI and O VI doublets. The strengths of the lines are mostly well reproduced. The most glaring exceptions are N III 990 Å, He II 992 Å, and the Si III triplet at 1110 Å, all of which are too weak in the model to match the observations. On the other side, the model predicts strong lines of N III 1002,1003 Å and C II 1010,1165 Å that are not seen in the data and overpredicts the strengths of C III 1125.6 Å and C IV 1169 Å.
The normalization of the model fits is a measure of the solid angle of the WD and can be combined with the distance to give the WD radius. At the distance of U Gem, 96 pc, our normalization gives a WD radius of cm. This radius is consistent within uncertainties in flux calibration with that found by Long & Gilliland (1999): for the 96 pc distance, their model normalization gives = cm. Assuming a standard WD mass-radius relation (Anderson, 1988), our radius indicates a WD mass of 1.08 , which is close to the mass reported by Sion et al. (1998) and Long & Gilliland (1999), 1.1 (or 1.12 for ).
Both the temperature and the normalization of the single-temperature model are largely impervious to variations in the assumed WD rotation rate, metal abundances, or neutral hydrogen column density: there was 1000 K variation in the WD temperature as these values were varied, and a 5% change in the normalization (or 2.5% change in the WD radius). This is not surprising, since the fit is largely set by the fluxes and the shape of the continuum. The model parameters are sensitive to the reddening, however. For zero reddening, the WD temperature decreases by a small amount, to 41,750 K, but the normalization drops by 20%, or an 11% decrease in the WD radius. However, the only increases from 5.65 to 5.75 and the qualitative fit is essentially unchanged. Our models are subject to such uncertainties because the total wavelength coverage of the FUSE spectrum is small.
Previous studies of the WD in U Gem (Long et al., 1993; Cheng et al., 1997) have found evidence of a second temperature component, or “belt” on the WD surface. Given the importance of two-component models to previous fits to the WD spectrum in U Gem, we tested the effects of adding a second temperature component to out WD models. The best-fit two-component model, using the same model parameters discussed above for the single temperature case, is shown as the dotted line in Figure 11. It has , = 35,000 K and = 57,920 K. A reddening of E(B–V) = 0 gives a slightly better statistical fit in this case. The ratio of the normalizations of the two components indicates that the hot component covers some 40% of the WD surface in projected area. The two-component model is a statistical improvement in the fit quality: the reduced declines from 5.67 to 5.18. This improvement is primarily manifested as a better fit to the observed spectrum for 960 Å. At longer wavelengths, the two-component model is very similar to the single-temperature case. The relative size and temperature of the hot component is not well constrained by our fits. By making small changes to the model parameters, we found that the temperature of the hot component could vary from 55,000 K to 70,000 K without significantly changing the fit to the data. Changes in temperature of the second component are offset by changes in the size of the hot region, from a minimum of 13% to the 40% noted above.
For the models shown in Figure 11, we assumed solar metal abundances. We also tested models in which the metal abundances were varied. Sion et al. (1998) and Long & Gilliland (1999), modelling separate and independent observations of U Gem in quiescence, found C and Si to have sub-solar abundances and (in the latter study) N to be supersolar, while the other metals had normal abundances. We tested the values found by Long & Gilliland (1999), setting C to 0.1 solar, N to 4 times solar, and Si to 0.4 solar. Since these abundances are based on fits to lines in the HST wavelength range, our FUSE observations should be well suited to provide an independent check on their values. For the elements in question, our models indicate results consistent with those found by the previous studies.
For carbon, the solar abundance models shown in Figure 11 fit the strong C III 1186 Å and the 977 Å lines moderately well. However, most of the other C lines suggest lower abundances. Specifically, there are many C lines in the solar abundance model spectrum that are not present in the data, and other C lines in the data are strongly overpredicted by a solar abundance model. For a 0.1 solar C abundance, the fits to the weaker C lines in the spectrum are vastly improved: lines such as C II 1066 Å, C III 1125 Å and C IV 1169 Å are well fit by the 0.1 solar model and the C lines not present in the data disappear from the models. Since the C III 1186 Å and the 977 Å lines are saturated, they are not as affected by the abundance. In particularly, the strongest line, C III 1186 Å, is still fairly well fit, but is either slightly too shallow or too narrow, depending on the WD rotation rate adopted. The resonance line at 977 Å, already slightly too weak at solar abundance, becomes even weaker.
Long & Gilliland (1999) found nitrogen to be 4 times solar. This abundance was based on fits to a single feature, N III 1184 Å. There are several N III and N IV lines in the FUSE FUV range. At solar abundance, the resonance line, N III 990 Å, is much too weak, as is N IV 955 Å. At an abundance 4 times solar, both lines are much better fit; if anything, they remain slightly too weak. N III 980 Å, though not poorly fit at solar abundance, is also better fit at 4 times solar. The fits to these lines appear to confirm the super-solar N abundance found by Long & Gilliland. There are some residual peculiarities in the N line fits, however. The N IV blend doesn’t appear in any of our models, at any abundance, despite being a strong feature in the data (and being present in the model line list). Also, N III 1002 Å, 1003 Å, and 1006 Å are too strong in both the solar and super-solar models. The overall fit to the N line spectrum, however, in Obs. 4 is improved by assuming a super-solar N abundance.
Our fits are not very sensitive to the abundance of Si. Most of the Si lines in the models showed little change in their strengths when the abundance was changed from solar to 0.4 solar. Within the uncertainty of our fits, there is no reason to prefer one abundance over the other. We note that Si IV 1067 Å appears too strong at solar abundances, but it is blended with the aforementioned C II 1066 Å line, and a reduction of the C abundance from solar improves the fit to this feature without requiring an adjustment to the Si abundance. Also, the Si III triplet, 1108 Å – 1113 Å, is too weak in both the 0.4 solar and solar models.
The Obs. 4 spectrum has WD absorption lines from two elements that were not observed in the HST spectra: oxygen and phosphorus. In our model fits, solar abundances proved good fits to both the O III and P V lines. Similarly, there are only a few weak sulphur lines in the HST spectrum, but several in the FUSE spectrum. A solar S abundance provides fairly good fits to the S III and S IV lines in the FUSE spectrum, although the resonance lines, S IV 1066,1076 Å, are slightly too weak in the model shown in Figure 11.
On whole then, our model fits confirm the earlier abundance peculiarities seen on the WD in U Gem, both an underabundance of C and an overabundance of N in the atmosphere. This said we were unable to accurately determine self-consistent abundance values that fit every, or almost every, line of a given element. The U Gem spectra are somewhat cautionary in this regard, suggesting that very careful modelling is required to accurately assess the errors in derived abundances. In our case, we have used LTE models; one might hope that non-LTE modelling and/or very careful attention to the assumed oscillator strengths could improve the results. We have not pursued this here, in part due the fact that U Gem may not have been completely in quiescence at the time of our Obs. 4; disk or boundary layer material associated with the outburst may be affecting the line strengths. Possible surface temperature variations on the WD associated with the outburst could also be affecting the fits. Detailed, non-LTE modelling of a high quality FUV spectrum in full quiescence is probably a pre-requisite for a more detailed analysis of this spectrum. That will be interesting of course, since the photospheric abundances may change during the inter-outburst interval due to gravitational settling in the atmosphere if the accretion rate is sufficiently low or concentrated on a small part of the WD.
5.2 Non-WD Features in the Obs. 4 Spectrum
The Obs. 4 spectrum shows transitions of O VI and S VI. The S VI lines are weaker than in the Obs. 1 – Obs. 3 spectra (see Table 3). The O VI lines have similar EWs to those of the plateau spectra, but the lines are smooth and do not show the variable line profiles seen in the plateau observations. The S VI and O VI lines are also present in quiescent spectra of U Gem (Long et al., 1993). The lines do not originate on the WD, which is too cool to produce such high ionization potential transitions. The doublet ratio of O VI indicates that the lines are optically thick. The doublet ratio of S VI appears to be intermediate between 2:1 and 1:1, suggesting the S VI doublet is marginally optically thick. We fit simple absorption models to the doublet lines, assuming uniform absorbing slabs of zero source function. The resulting column depths of the lines are = 16.0 and = 15.1. The lines are not dark in their centers, so the covering fraction of the absorbing slabs is 1: 0.65 for O VI and 0.35 for S VI.111The N V doublet at 1238,1242 Å is also seen in quiescent UV spectra of U Gem and is not believed to originate on the WD. The doublet ratio indicates that the N V lines are also optically thick. Using the GHRS observations of U Gem (Long & Gilliland 1999), we determined the column depth of the N V absorption, and obtained = 15.3, with a covering fraction of 0.65.
We also checked the Obs. 4 data to see if the increase in line absorption during orbital phases 0.53 – 0.79 seen in Obs. 1 – Obs. 3 is also seen in Obs. 4. To do so, we averaged all Obs. 4 data acquired during phases 0.53 – 0.79 and all data acquired at other orbital phases, and examined a difference spectrum of the two averages. The difference showed no change in the Obs. 4 spectrum between the two parts of the orbit. There was no sign of increased absorption underlying the WD features, nor was there any change in the shapes or strengths of the O VI and S VI lines, indicating that the orbital phase-dependent variations in line absorption seen on outburst plateau is not observed in late outburst decline.
6 Discussion
6.1 The Outburst Spectra – Disk Plus Stream Overflow
During the peak and plateau phase of the outburst, the shapes of the FUSE spectra were very similar and the flux declined by only 22% overall. Based on our accretion disk models of U Gem, 90% of the flux at 1000 Å arises from disk radii 1 cm, or 20 WD radii. Thus, the similarity of the spectra from the three plateau observations is strong evidence that the structure of the inner accretion disk was relatively stable and that the effective size of the emitting region did not decline by more than about 20% – 25%. Indeed, the flux decline we observed was similar to that observed by EUVE during a similar outburst (Long et al., 1996). In both outbursts, the UV flux dropped earlier than the optical flux, suggesting that the declines were inside-out.
Our disk model fits to the FUV spectra of U Gem on the outburst plateau provide qualitatively reasonable determinations of for the mass accretion rate. The accretion disk models successfully reproduce the overall shape of much of the FUV continuum, although the model under-predicts the observed continuum 960 Å. Given our elementary understanding of accretion disk atmospheres, it is not clear whether the latter discrepancy is due to a limitation in the disk models or to the addition of a second continuum component, such as the boundary layer, to the light curve at the shortest wavelengths. Interestingly, there is reasonably good agreement between the accretion rate we derive and the rates that have been derived at somewhat longer wavelengths using IUE and HST (Panek & Holm, 1984; Sion et al., 1997). Our own view, based on studies of other dwarf novae, is that this is somewhat fortuitous, mainly because studies of other DN and novalike CVs have shown that the spectra of many systems with high- depart from the predictions of synthetic spectra created from summed stellar spectra (Wade, 1984; Long et al., 1991, 1994b; Knigge et al., 1997).
UV spectra of DN in outburst in the range accessible to IUE and HST usually contain features due to resonance lines, mainly of C IV, Si IV and N V. These lines are usually characterized by larger velocity widths, blue-shifted absorption centroids, and, in lower inclination systems and especially for C IV, red emission wings. Such lines are interpreted as resonant scattering in a wind driven from the inner portions of the disk. This interpretation arises naturally from the line shapes of typical systems, which for C IV in particular resemble the P Cygni profiles produced in O star winds; from the fact that even when P Cygni emission wings are absent the lines are broad and blueshifted; from blue-edge velocities of up to 5000 km s-1, which are similar to the escape velocity from the WD; and from the persistence and shape of the line emission during the eclipses of highly inclined systems (see Córdova 1995 and Drew 1997 for reviews). This interpretation has been supported by detailed comparison of line shapes to those predicted based on radiative transfer codes (Drew, 1987; Mauche & Raymond, 1987; Shlosman & Vitello, 1993; Vitello & Shlosman, 1993; Knigge et al., 1997).
However, none of these characteristics is seen in the lines in U Gem, and as a result it is quite clear that a “standard” wind does not create the FUV line structure. In particular, all of the FUV lines are relatively narrow with FWHM km s-1. It is also clear that the lines do not originate directly from the disk photosphere, since the line features in our steady-state disk models are broad (see Figure 6). The reason that steady-state disk models cannot produce these lines is simple: the line-of-sight velocities in inner disk where the bulk of the FUV radiation is produced are simply too high to produce narrow lines.
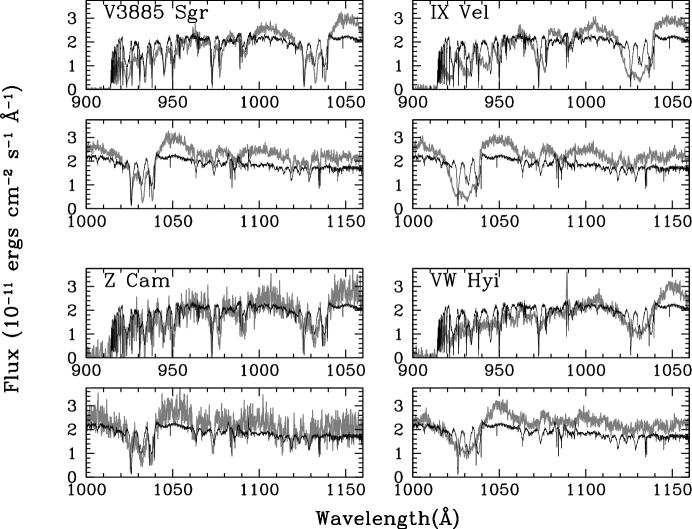
The line spectrum of U Gem in outburst is fairly unusual for a DN in outburst in the IUE/HST range, but there are relatively few spectra of CVs covering the FUV range. The largest collection of publicly available, high spectral resolution FUV spectra of CVs are those obtained with ORFEUS. (Such FUSE observations are limited at present). We downloaded spectra obtained by the Berkeley Extreme and Far-UV Spectrometer (BEFS) on ORFEUS (Hurwitz al., 1998; Hurwitz & Bower, 1996). ORFEUS spectra of the novalike CVs V3885 Sgr and IX Vel, and of the DN Z Cam (in standstill) and VW Hyi (in outburst) are shown in Figure 12. To our knowledge, these spectra are previously unpublished. For comparison, the fluxes in the ORFEUS spectra were rescaled so that their mean 900 – 1100 Å fluxes are equivalent to the mean flux in the same wavelength range of our Obs. 1 time-averaged spectrum, which is also shown in each frame of Figure 12.
In fact, we see that the FUV lines and line widths in U Gem are not that unusual. Specifically, the FUV spectra of V3885 Sgr and Z Cam are clearly quite similar to the outburst spectrum of U Gem. Their continuum shapes are comparable, and the absorption line transitions observed and their widths and velocities are virtually identical. This is true despite the fact that IUE and HUT spectra of V3885 Sgr and Z Cam show P Cygni-like C IV profiles (see, e.g., Prinja & Rosen 1995). Narrow lines are not universal in the FUV, however. The IX Vel spectrum shows much broader absorption features than are seen in U Gem, and its metal lines are blueshifted. The VW Hyi spectrum shows strong, broad O VI absorption and little else. All of the CVs except VW Hyi, which lies below the period gap, have similar (4.25 hr – 6.95 hr) orbital periods to U Gem and all (except possibly V3885 Sgr) have inclinations within 10 of U Gem (57 – 60; Ritter & Kolb 1998). Thus, while high velocity lines can be seen in some spectra, we conclude that, among FUV spectra of CVs, U Gem is not a pathological case.
We are left then with the question: if the FUV lines in U Gem and similar systems are created neither by a fast wind nor by the disk photosphere, where does the absorption arise? We have a number of clues. First, the lines encompass a large range in ionization potential, and many of the lines arise from excited lower states (see Table 3) with excitation energies of typically 5 – 15 eV. This suggests high plasma density or high radiation density, so that the lower levels will be excited. (In LTE, for example, at 25,000 K, the relative population of an excited state with an excitation energy of 10 eV is still 1%.) Indeed, all of the lines seen in the outburst spectra are also seen in the Obs. 4 spectrum that we are confident is dominated by radiation from a WD photosphere. Second, the lines have low radial velocities (700 km s-1) with respect to the WD, which rules out an inner disk origin, and none of the absorption lines are dark in their lines centers, which suggests that the absorbing region only partially covers the inner accretion disk. Finally, while the absorption lines are present at all orbital phases, the depths of the low ionization state lines vary with phase and are deepest between phases 0.53 and 0.79; in the same part of the orbit, most of the lines are redshifted by 450 km s-1 with respect to the WD.
The relatively dense, low velocity absorption spectrum suggests an outer accretion disk chromosphere origin. This is consistent with the results of Naylor & la Dous (1997), who found that U Gem’s accretion disk in outburst shows considerable vertical extent, with the hydrogen column density along the line of sight reaching up to cm-2. The orbital variability in the FUSE spectra suggests that the absorption region is also linked to the source of the X-ray and EUV dips seen in U Gem. The increase in line absorption seen in the FUSE (and archival HST) spectra occurs at approximately the same orbital phases at which X-ray and EUV absorption dips occur in U Gem (Mason et al., 1988; Long et al., 1996). Most of the observations of dips have been made during outburst, but Szkody et al. (1996) also observed orbital dips in quiescence with ASCA. Similar phenomena are observed in a group of low mass X-ray binaries, the so-called X-ray “dippers”. (See White, Nagase, & Parmar 1995 for a review of these systems.)
It is generally believed that the dips in X-ray binaries and analogous dips in CVs are due to a vertical extension of the accretion disk created by the interaction between the disk and the mass accretion stream (White & Swank, 1982). Two flavors of models of the phenomenon exist. In the first, the response of the disk is to bulge — that is, to have a different scale heights — at various azimuths. For example, Hirose, Osaki, & Mineshige (1991) carried out three-dimensional calculations that show bulges at positions that will partially occult the disk near phase 0.8, with less prominent bulges at phase 0.2 and 0.5. Alternate models were developed by Frank, King & Lasota (1987) and Lubow (1989), who proposed that the dips could be accounted for by stream material skating over the edge of the accretion disk and piling up at the co-rotation radius. Frank, King & Lasota (1987) argued that the interaction between new and old material results in a general thickening of the disk at the co-rotation radius, resulting in prominent dips between orbital phases 0.3 and 0.8. More recent calculations by Armitage & Livio (1998) are beginning to synthesize the bulge and stream extremes. They indicate that the nature of the flow depends, as one might expect, on the efficiency of cooling of the stream at the point where the stream encounters the disk. At low accretion rates, the stream flows more or less ballistically to the co-rotation radius; at higher rates, the stream is disrupted, “splashes”, near the disk rim and appears as a bulge with a phase dependence reminiscent of the predictions of Hirose, Osaki, & Mineshige (1991).
In terms of general character, our plateau absorption spectra appear consistent with vertically extended absorbing material interacting with some kind of stream overflow. In fact, in their analysis of the ASCA observations of U Gem, Szkody et al. (1996) noted that such a vertically extended stream, in addition to producing X-ray dips, should also produce very optically thick absorption lines of low ionization metals with line widths of a few hundred km s-1, much as we observe with FUSE. The increase in line absorption and redshift at orbital phases 0.55 – 0.71 in the FUSE spectra is, in this picture, caused by the presence of additional, in-flowing material as the disk-stream interaction region moves into our line of sight. Because we observe absorption lines at every orbital phase, however, the line absorption region cannot be narrowly confined to the disk-stream interaction region, but rather indicates an azimuthally-varying disk chromosphere, disturbed by the stream overflow.
Ideally, one would at this point develop a detailed model of the ionization structure of and radiation flow through such a stream interaction region of the disk. We do not have in hand a detailed picture of the density structure of this region, nor do we have in hand the 3-d radiative transfer code that would be required. We do, however, possess a 2-d Monte-Carlo code (Long & Knigge, 1998) that was simple to modify so that it could handle an accretion disk chromosphere. Our goal was limited to determining the location and velocity of absorbing material that can produce narrow absorption lines at low velocity; we did not try to find the ionization structure of the material or fit the full spectrum simultaneously. We created a disk chromosphere that rotates at the Keplerian velocity of the underlying disk, and ran pure absorption (i.e., zero source function) calculations through that chromosphere, with the inner accretion disk continuum discussed above as input, to determine the radial extent and velocity of the region.
We found two main results. First, as expected, the absorbing material must have a mean velocity with respect to the line of sight that is nearly zero. Any outflow component to the gas resulted in lines that were too heavily blueshifted. Second, we were able to produce absorption lines similar in velocity, shape, and depth to those observed when the absorbing gas was restricted to outer disk radii, cm – cm (20 – 60 RWD). As many of the absorption lines are optically thick, the extent of the absorbing region, i.e. its covering factor, was more important to matching the absorption lines than the density. The model chromosphere has a vertical scale height of 5 cm, much greater than the scale height of disk photosphere, and a base density of cm-3. At a disk radius of and an inclination angle of 67, the line of sight to the WD has a height above the disk of , so this is material that is elevated considerably above the disk photosphere.
The parameters of our simple model for the FUV absorbing region are consistent with the location of the X-ray dip absorbing material. The vertical scale height of the FUV absorbing material is 0.2 – (where is the radial distance to the WD); Long et al. 1996 gave a scale height of 0.42 for the X-ray/EUV absorber. The inner radius of the absorbing region in our model (1010 cm) is also quite close to the projected circularization radius of the mass stream for U Gem, 1.1 cm, and could therefore coincide with the stream overflow radii (Frank, King & Lasota, 1987). The outer radius in our model is 3 cm. This is smaller than the outer radius of the accretion disk in quiescence ( cm; Marsh et al. 1990) and thus is perhaps less consistent with an outer disk bulge picture, though a more sophisticated model is clearly necessary to demonstrate this in earnest.
The O VI absorption lines behave differently from the other lines in the FUV spectrum. In particular, they show signatures of a wind. In Obs. 1 – Obs. 3, O VI 1038 Å has apparent weak emission to the red of its blueshifted absorption component. Another aspect of the O VI doublet that marks it out as different from the other absorption features is the appearance in the doublet lines of narrow absorption dips at a blueshift of 500 km s-1. This lends weight to the identification of the O VI profiles as partially or mainly wind-formed in that similar blueshifted absorption dips have also been found in very clearly wind-formed line profiles in HST/STIS spectra of the non-magnetic novalike variables IX Vel and V3885 Sgr (Hartley et al, in preparation; see also Mauche 1991, Prinja & Rosen 1995). As here, the narrow absorption dips seen in IX Vel and V3885 Sgr show some EW modulation (e.g. they are seen to disappear over some minutes in Si IV 1397 in IX Vel’s spectrum), along with only slight variation of blueshift. The origin of these dips is as yet quite unclear. We can comment on what they are not: their persistence at essentially the same blueshift, when present, tends to rule out the models that are employed to explain the moving “DACs” (discrete absorption components) in O star winds (see e.g. Prinja et al 1992 and Cranmer & Owocki 1996). Instead, we need a model that invokes a structure in the disk and/or wind that is nearly azimuthally symmetric and is able to induce a pile-up of outflowing O5+ ions at the observed 500 km s-1 blueshift.
If a fast wind exists in U Gem, as the O VI line profiles suggest, it must be tenuous enough or ionized to the point where it has little effect on the spectrum in the FUV, except for a weak signature of outflow in the highest excitation FUV transition. The degree of ionization may be the key difference between U Gem and other systems, since U Gem is known to have a luminous boundary layer during outburst (Long et al., 1996). Further evidence of the wind has to be sought in the EUV domain where, indeed, very highly ionized transitions are seen in emission that could originate in the wind (Long et al., 1996).
Given the mass accretion rate estimate to hand and a figure for the white dwarf radius, we may estimate the ratio between the accretion and Eddington luminosities for U Gem. Using respectively yr-1 (this paper) and R cm (Long & Gilliland 1999), we obtain . If the wind is driven just by radiation pressure, this value of implies, at best, a mass loss rate in the region of yr-1 (deduced from the plot of wind mass loss rate against in Drew & Proga 2000, see also Proga 1999). By the standards of high-state non-magnetic CV, this is a weak wind – mass loss rates are usually estimated to be an order of magnitude higher (Drew 1997). In the presence of U Gem’s strong EUV continuum, we should not be surprised such a wind is highly ionized. Thus, while in other high state systems, with denser, less well-ionized winds and, yet, similar mass accretion rates to U Gem, radiation pressure as a driver of outflows may be insufficient to complete account for the flow (e.g., IX Vel, Hartley et al., in preparation), our outburst spectra of U Gem are compatible with mass loss driven mainly by radiation pressure.
6.2 The Spectrum in Late Outburst Decline – the White Dwarf
Obs. 4 was obtained two days before the end of the optical outburst. In the FUV, the accretion disk had already faded, revealing the white dwarf; a model WD spectrum with T K provides a good qualitative fit to the Obs. 4 spectrum. Previous UV observations of U Gem obtained early and late in its quiescent interval have shown that the WD cools between outbursts (Kiplinger, Sion & Szkody, 1991; Long et al., 1994a, 1995; Sion et al., 1998). The WD flux drops 30% (at 1450 Å) from early quiescence to late quiescence (Long et al., 1995), and models typically indicate a WD temperature of 38,000 K soon after outburst and 30,000 K several hundred days later (Kiplinger, Sion & Szkody, 1991; Long et al., 1994a). The fluxes observed in Obs. 4 are 30% higher again (at 1000 Å) than those seen in a HUT spectrum of U Gem obtained 11 days after then end of an outburst, indicating that the WD luminosity in late outburst is larger still than its luminosity in early quiescence. Moreover, the drop in flux from late outburst to early quiescence is comparable to the decline in flux during the quiescent interval.
In modelling the HUT spectrum of U Gem, Long et al. (1993) found that a single-temperature WD model provided a poor fit to the spectrum below 970 Å. The quality of the fit at the bluest wavelengths was improved by the addition of a second component on the WD, a 56,600 K source occupying 15% of the WD surface. More important, the additional component resolved an inconsistency between the observed flux decline during quiescence and the decrease in the WD temperatures of the quiescent models: an 8000 K drop in the temperature of the entire WD (from 38,000 K to 30,000 K) would cause the observed flux to drop by over a factor of two, not just 30% as observed, but the cooling of 15% of the WD from 57,000 K to 30,000 K is consistent with the observed flux decline. Indeed, virtually all of the model fits to quiescent observations of U Gem are consistent with the bulk of the WD having a constant or near-constant temperature while a fraction of the WD — heated by the outburst — cools during quiescence (Kiplinger, Sion & Szkody, 1991; Long et al., 1994a, 1995; Cheng et al., 1997).
Our single-temperature WD model indicates a temperature of 43,000 K. A decline in the bulk WD temperature from 43,000 K in late outburst to 38,000 K in early quiescence implies a decrease in flux at 1050 Å of 35%, which matches the observed flux decline within the flux calibration uncertainties of both spectra. Therefore, a second temperature component is not required to explain the drop in flux from that seen in Obs. 4 to those of early quiescent observations of U Gem. Previous observations have indicated the likely presence of a belt on the WD, however, and if a hot belt is a consequence of the elevated accretion during outburst, we would expect the belt to also be present during Obs. 4. Our two-temperature WD model is, in fact, a statistical and qualitative improvement over the single temperature fit to the Obs. 4 spectrum. The two models are quite similar at longer wavelengths, but the addition of a second component improves the fit to the spectrum at the shortest wavelengths (960 Å), as was also true of fits to the HUT post-outburst spectrum.
Our observations indicate that the WD is more luminous in late outburst than in early quiescence and that the addition of a second temperature component on the WD improves the model fit to Obs. 4. Unfortunately, we cannot use these results to draw firm conclusions about changes in temperatures across the WD after an outburst, both because the effects we are trying to measure are at the margin of what is possible after allowing for errors in the cross-calibration of the instrumentation involved, and because there is no guarantee that the WD behaved identically in the various outbursts that have been observed (see, for example, Sion et al. 1998). The question of whether all or part of the WD cools after outburst bears directly on models of the cooling source. If the heating of the WD during outburst is caused by spin-up of its surface layers, a multi-component temperature distribution on the WD in the form of a belt is likely, as the accreted material preferentially boosts kinetic energies near the WD equator (Long et al., 1993). Ongoing accretion through the disk may also support a WD belt in quiescence (Cheng et al., 1997). Other models — such as radiative heating of the WD during the outburst (Pringle, 1988), compressional heating of the WD layers by the weight of accreted material (Sion, 1995), or quiescent accretion via a disk corona (Meyer & Meyer-Hofmeister, 1994) — may allow a single-temperature WD. A series of targeted observations of U Gem throughout a full quiescent interval using HST or FUSE will be needed to resolve uncertainties concerning the response of the bulk of the WD and the WD belt to the outburst.
The O VI and S VI absorption lines that are present in the Obs 4. spectrum do not arise naturally in the WD photosphere, unless the temperature of the WD is much higher than we have estimated. The smooth O VI line profiles bear no resemblance to the wind-formed lines seen on outburst plateau. Also interesting is the fact that none of these lines (indeed, none of the lines in the Obs. 4 spectrum) show variability, orbital or otherwise. The X-ray dips with which the outburst plateau absorption spectrum is associated persist into quiescence (Szkody et al., 1996), but no associated orbital variation is seen in Obs. 4. These lines are not unique to late outburst, however, as O VI was also observed in the HUT quiescent spectra, and both the HUT and HST quiescent spectra show N V absorption. We derived column densities for the lines of , , and for N V, O VI, and S VI, respectively. The associated H column densities, assuming close to solar abundances, for all three lines range is about . (This is close to that the column density we have derived for the interstellar column density to U Gem, but that is coincidental since these are not the dominant stages of these ions in the ISM.)
If accretion onto the WD in quiescence occurs through some kind of coronal, or siphon flow, such as suggested by Meyer & Meyer-Hofmeister (1994), it is possible that these high excitation absorption lines arise in the transition region between the hot X-ray emitting gas and the WD photosphere. If this is the case, it is possible to estimate the density and the length scale from the quiescent accretion luminosity and the column densities. Specifically, and concentrating on O VI
where is the total emissivity in the O VI region, and has been left on both sides of the equation for clarity. If we assume that the 43,000 K WD temperature we derive our models of Obs. 4 represent excess heating from accretion over the 30,000 K quiescent temperature of the WD, we obtain an excess luminosity of ergs s-1 and a reasonable accretion rate g s-1. In coronal equilibrium, the relative abundance of O VI peaks at K and the corresponding emissivity is ergs s-1 cm3 (Raymond, Cox, & Smith, 1976), and this suggests a density of in the transition region between the hot plasma and the WD photosphere. Since we know the column density () to be , the thickness of the region is about 20 km. This is within an order of magnitude of the scale height for a component to the upper atmosphere of a log g=8 star.
Finally, one of the more interesting recent discoveries from analyses of HST UV spectra of U Gem in quiescence has been that sub-solar carbon abundances and super-solar nitrogen abundances are required in the photosphere of the WD. (The models also indicate slightly sub-solar silicon and aluminum abundances; Sion et al. 1998, Long & Gilliland 1999). Such an abundance pattern is indicative of a history of CNO processing in the surface WD material. Intriguingly, Harrison et al. (2000) find that the CO absorption lines in their NIR spectra of U Gem are also weaker than expected for the mass donor star spectral type, which may confirm that the material accreted onto the WD consists of CNO processed material, perhaps deposited on the mass donor star during an previous nova explosion in the binary (Sion et al., 1998). In our models, the overall C and N absorption spectra are consistent with a sub-solar abundance for the former and a super-solar abundance for the latter as found by fits to the HST spectra.
7 Conclusions
1. We have obtained FUSE FUV spectra of U Gem in outburst. The Obs. 1 – Obs. 3 spectra, obtained when U Gem was on the outburst plateau, are characterized by a curved continuum that peaks at 1005 Å and a host of absorption lines, both interstellar and intrinsic to U Gem. The FUV continuum level declined by 8% – 10% from Obs. 1 to Obs. 2 and 12% – 14% between Obs. 2 and Obs. 3 with no change in the shape of the spectrum. The Obs. 4 spectrum, obtained on the late decline from outburst, is 30 times fainter than Obs. 3. It also has a bent continuum shape that peaks near 1000 Å and an absorption line spectrum.
2. The continua of the Obs. 1 – Obs. 3 spectra are consistent with steady-state accretion disk model spectra with a mass accretion rate in the disk of = yr-1 at peak of outburst. The accretion disk models do not fit the absorption lines in the spectra, which are too narrow to originate in the inner, FUV-emitting accretion disk.
3. The non-interstellar absorption lines in the Obs. 1 – Obs. 3 spectra are narrow (FWHM 500 km s-1) and low-velocity (700 km s-1) transitions of H I, He II and two- to five-times ionized transitions of C, N, O, P, S and Si. With the possible exception of a red wing on the O VI 1038 Å line, there are no emission features in the spectra. Most of the lines (except those of O VI) are smooth and show little structure. The S VI and O VI doublets are optically thick. At a given orbital phase, absorption line shapes, EWs and velocities are similar between observations. The outburst spectra of U Gem are also very similar to ORFEUS spectra of the novalike CV V3885 Sgr and the DN Z Cam.
4. The absorption lines show orbital variability. Specifically, spectra acquired at orbital phases 0.53 and 0.79 show an increase in the depths of the absorption lines and the appearance of numerous low ionization lines not seen at other orbital phases. A similar increase in the central depth of its absorption line is seen in HST spectra of He II 1641 obtained during an earlier outburst.
5. The absorption line variability occurs at the same orbital phases as X-ray and EUV light curve dips seen in U Gem in both outburst and quiescence. Assuming that the increase in line absorption is tied to the source of the dips suggests that the absorption line spectrum originates in extended material above the plane of the accretion disk, with the orbital variability caused by a disk bulge or mass stream overflow. Simple models of the FUSE absorption line spectrum indicate that the FUV absorbing material must be located at large disk radii in order to achieve the observed low radial velocity.
6. In late outburst decline, Obs. 4, the spectrum is dominated by the white dwarf. The fluxes in Obs. 4 are 30% higher than in a HUT spectrum of U Gem acquired in early quiescence. The Obs. 4 spectrum is qualitatively well fit by a single-temperature WD model spectrum with 43,000 K. The model indicates a WD radius of = . The presence of a second temperature component on the WD improves the quality of the model fits to the data at 960 Å. Our fits confirm the non-normal metal abundances found in previous studies of the WD. Optically thick O VI absorption lines and weak, marginally optically thick S VI absorption are present in the Obs. 4 spectrum. These lines may arise in a transition region above the WD photosphere.
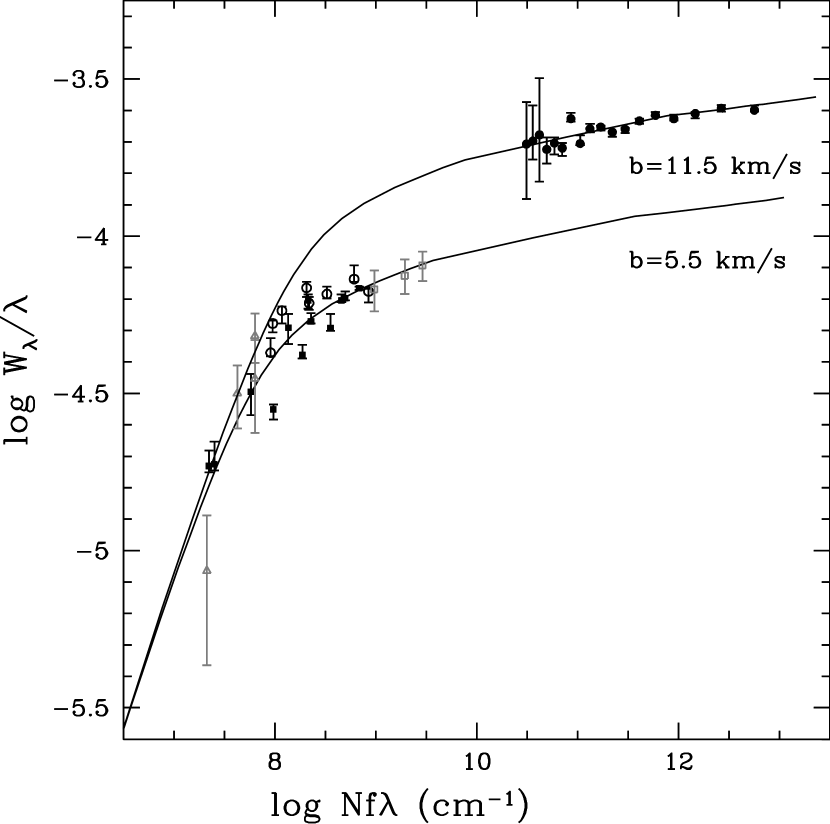
7. We conducted a curve of growth analysis of the interstellar lines in the spectrum of U Gem. We find a neutral hydrogen column density on the line of sight to U Gem of . The metal lines are consistent with a broadening parameter of 5.5 km s-1, while the interstellar Lyman absorption lines are consistent with km s-1.


Appendix A A Curve of Growth Analysis of the Interstellar Lines in the U Gem Spectrum
The interstellar (IS) hydrogen column density on the line of sight to U Gem was previously determined by Long et al. (1996) from a curve of growth analysis of the IS metal absorption lines in a high-resolution IUE spectrum of U Gem. Using the method of Mauche, Raymond & Córdova (1988), Long et al. determined from the growth curve of the metal lines by making two assumptions: first, that the abundances of nitrogen and sulpher are undepleted with respect to their solar abundances (and can therefore be used to determine the hydrogen column density); second, that a single broadening parameter describes all species. Using these assumptions and measurements of N I and S II IS lines in the IUE spectrum, they obtained cm-2 and = 5 km s-1. Because the FUSE wavelength range contains numerous IS metal transitions as well as IS absorption from the higher order Lyman series, we resolved to re-analyze the growth curve on the line of sight to U Gem. Although the value of the hydrogen column density does not affect the models in this manuscript, precise values of are important in the analysis of EUV and soft X-ray observations of U Gem.
We used the EWs and oscillator strengths given in Table 4 to construct our growth curve, on which we included unblended lines of H I, N I, and O I. We assumed that N and O are undepleted with respect to their mean gas-phase IS abundances; these abundances were taken from Meyer et al. (1997, 1998). We constructed the curve of growth for this sight line, assuming a single-component Maxwellian distribution (i.e., assuming no damping wings), using the basic method outlined by Spitzer (1978). The curve is shown in Figure 13. The error bars on the points represent uncertainties in placement of the continuum only (they are much larger than the statistical uncertainties for our spectra). Also shown in gray are the IUE N I and S II points from Long et al. The lower growth curve shown is the best fit to the metal lines: cm-2 and = 5.5 km s-1.
Also shown on Figure 13 are the H I absorption lines from the FUSE spectrum. The higher-order Lyman series lines can not be used to directly determine because they all land on the flat part of the curve of growth. Observations of Ly, which falls on the square-root part of the growth curve, are necessary to fix from the H I absorption. The H lines shown in Figure 13 land above the growth curve defined by the metal lines. The upper line in Figure 13 shows that if the broadening parameter, , is increased to 11.5 km s-1, the growth curve passes directly through the H I points. A larger broadening parameter value is expected for H I, since Doppler broadening of the IS line profiles from thermal motions will be larger for H than for the heavier species. If was set solely by Doppler broadening, however, we would expect it to be , or 3.74, times larger for H than for N, while the broadening parameter value for H is only 2.1 times larger than for the metal lines in Figure 13. This discrepancy can be reconciled if the IS cloud has an appreciable non-thermal velocity that dominates the broadening parameter for the metals, while the thermal broadening dominates for H. If and , then the two values shown in Figure 13 give km s-1 and km s-1. This thermal velocity implies a cloud temperature of 6600 K. Note, however, that this calculation assumes that the effective values indicated by the curve of growth are equivalent to the true thermal and non-thermal values in an IS cloud. The H I are so much stronger than the metal lines that the presence of low column density clouds in the sight line, for example, could broaden H I while not affecting the metal lines at all.
Note also that the curve of growth analysis is predicated on the assumption that a single IS cloud determines the IS absorption to U Gem. None of the metal lines (except the uncertain S II 1250.586 Å line) truly fall on the linear part of the curve, so the derived is subject to uncertainties in the shape of the growth curve, which would be affected by the presence of multiple IS clouds. Dring et al. (1997) observed two stars, Gem ( = 192, = +23.4, d = 10.3 pc) and Gem ( = 191, = +23.3, d = 37.5 pc), on lines of sight similar to that of U Gem ( = 201, = +22.7). They found that both these lines of sight pierced two clouds, for a total of cm-2 for Gem and cm-2 for Gem. This suggests that at least three clouds, perhaps more, are penetrated on the line of sight to U Gem, as the column density to U Gem is an order of magnitude larger than those to the two stars analyzed by Dring et al. (1997). Jenkins (1986) concluded, however, that column densities derived from a curve of growth analysis should only underestimate by 20% at most so long as the distribution of optical depths and broadening parameters along the sight line is fairly smooth and highly saturated lines are not present. The resolution of our FUSE spectrum (20–25 km s-1) is insufficient to resolve the contributions of individual IS clouds, so our value of is subject to the caveat that a more complex IS structure than the one assumed in our curve of growth analysis may be present. Given that caveat, we find that cm-2 is the best estimate of the line of sight column density to U Gem.
References
- Anderson (1988) Anderson, N. 1988, ApJ, 325, 266
- Armitage & Livio (1998) Armitage, P. J. & Livio, M. 1998, ApJ, 493, 445
- Cheng et al. (1997) Cheng, F. H., Sion, E. M., Horne, K., Hubeny, I., Huang, M. & Vrtilek, S. D. 1997, AJ, 114, 1165
- Córdova (1995) Córdova, F. A. 1995, in X-ray Binaries, eds. W. H. G. Lewin, J. van Paradijs & E. P. J. van den Heuvel (Cambridge: Cambridge University Press), 331
- Córdova et al. (1984) Córdova, F. A., Chester, T. J., Mason, K. O., Kahn, S. M. & Garmire, G. P. 1984, ApJ, 278, 739
- Córdova & Mason (1984) Córdova, F. A. & Mason, K. O. 1984, MNRAS, 206, 879
- Cranmer & Owocki (1996) Cranmer, S. R. & Owocki, S. P. 1996, ApJ, 462, 469
- Drew & Proga (2000) Drew, J. E. & Proga, D. 2000, New Astronomy Review, 44, 21
- Drew (1997) Drew, J. 1997, in ASP Conf. Ser. 121: IAU Colloq. 163: Accretion Phenomena and Related Outflows, 465
- Drew (1987) Drew, J. 1987, MNRAS, 224, 595
- Dring et al. (1997) Dring, A. R., Linsky, J., Murthy, J., Henry, R. C., Moos, W., Vidal-Madjar, A., Audouze, J., & Landsman, W. 1997, ApJ, 488, 760
- Frank, King & Lasota (1987) Frank, J., King, A. & Lasota, J.-P. 1987, A&A, 178, 137
- Harrison et al. (2000) Harrison, T. E., McNamara, B. J., Szkody, P. & Gilliland, R. L. 2000, AJ, 120, 2649
- Harrison et al. (1999) Harrison, T. E., McNamara, B. J., Szkody, P., McArthur, B. E., Benedict, G. F., Klemona, A. R. & Gilliland, R. L. 1999, ApJL, 515, L93
- Heap et al. (1978) Heap, S. R., Boggess, A., Holm, A., Klinglesmith, D. A., Sparks, W., West, D., Wu, C. C., Boksenberg, A., Willis, A. & Wilson, R. 1978, Nature, 275, 385
- Hirose, Osaki, & Mineshige (1991) Hirose, M., Osaki, Y., & Mineshige, S 1991, PASJ, 43, 809
- Holm, Panek & Schiffer (1982) Holm, A. V., Panek, R. J. & Schiffer, F. H., III 1982, ApJL, 252, L35
- Howk et al. (2000) Howk, J. C., Sembach, K. R., Roth, K. C. & Kruk, J. W. 2000, ApJ, 544, 867
- Hubeny & Lanz (1995) Hubeny, I., & Lanz, T. 1995, ApJ, 439, 875
- Hubeny, Lanz & Jeffery (1994) Hubeny, I., Lanz, T. & Jeffery, C. S. 1994, Newsletter on Analysis of Astronomical Spectra (St. Andrews: St. Andrews Univ.), 20, 30
- Hubeny (1988) Hubeny, I. 1988, Comput. Phys. Comm., 52, 103
- Hurwitz al. (1998) Hurwitz, M., et al. 1998, ApJL, 500, L1
- Hurwitz & Bower (1996) Hurwitz, M. & Bower, S. 1996, in Astrophysics in the Extreme Ultraviolet, ed. S. Boyer and R. F. Malina (Dordrecht: Kluwer Academic Publishers), 601
- Jenkins et al. (2000) Jenkins, E. B., et al. 2000, ApJL, 538, L81
- Jenkins (1986) Jenkins, E. B. 1986, ApJ, 304, 739
- Kiplinger, Sion & Szkody (1991) Kiplinger, A. L., Sion, E. M. & Szkody, P. 1991, ApJ, 366, 569
- Knigge & Drew (1997) Knigge, C., & Drew, J. E. 1997, ApJ, 486, 445
- Knigge et al. (1997) Knigge, C., Long, K. S., Blair, W. P. & Wade, R. A. 1997, ApJ, 476, 291
- Long & Gilliland (1999) Long, K. S. & Gilliland, R. L. 1999, ApJ, 511, 916
- Long & Knigge (1998) Long, K. S. & Knigge, C. 1998, “Modeling the Spectral Signatures of Accretion Disk Winds in Cataclysmic Variables”, in “Accretion Processes in Astrophysical Systems: Some Like It Hot”, eds. S. S. Holt, T. Kallman, AIP Conference Proceedings 431, 467
- Long et al. (1996) Long, K. S., Mauche, C. W., Raymond, J. C., Szkody, P. & Mattei, J. A. 1996, ApJ, 469, 841
- Long et al. (1995) Long, K. S., Blair, W. P. & Raymond, J. C. 1995, ApJ, 466, 964
- Long et al. (1994b) Long, K. S., Wade, R. A., Blair, W. P., Davidsen, A. F. & Hubeny, I. 1994b, ApJ, 426, 704
- Long et al. (1994a) Long, K. S., Sion, E. M., Huang, M. & Szkody, P. 1994a, ApJL, 424, L49
- Long et al. (1993) Long, K. S., Blair, W. P., Bowers, C. W., Davidsen, A. F., Kriss, G. A., Sion, E. M. & Hubeny, I. 1993, ApJ, 405, 427
- Long et al. (1991) Long, K. S., et al. 1991, ApJL, 381, L25
- Lubow (1989) Lubow, S. H. 1989, ApJ, 340, 1064
- Lynden-Bell & Pringle (1974) Lynden-Bell, D. & Pringle, J. E. 1974, MNRAS, 168, 603
- Marsh et al. (1990) Marsh, T. R., Horne, K., Schlegel, E. M., Honeycutt, R. K. & Kaitchuck, R. H. 1990, ApJ, 364, 637
- Mason et al. (1988) Mason, K. O., Córdova, F. A., Watson, M. G. & King, A. R. 1988, MNRAS, 232, 779
- Mauche (1991) Mauche, C. W. 1991, ApJ, 373, 624
- Mauche, Raymond & Córdova (1988) Mauche, C. W., Raymond, J. C. & Córdova, F. A. 1988, ApJ, 335, 829
- Mauche & Raymond (1987) Mauche, C. W. & Raymond, J. C. 1987, Ap&SS, 130, 269
- Meyer et al. (1998) Meyer, D. M., Jura, M. & Cardelli, J. A. 1998, ApJ, 493, 222
- Meyer et al. (1997) Meyer, D. M., Cardelli, J. A. & Sofia, U. J. 1997, ApJ, 490, L103
- Meyer & Meyer-Hofmeister (1994) Meyer, F. & Meyer-Hofmeister, E. 1994, A&A, 228, 175
- Moos et al. (2000) Moos, H. W., et al. 2000, ApJL, 538, L1
- Morton (1991) Morton, D. C. 1991, ApJS, 77, 119
- Morton (1978) Morton, D. C. 1978, ApJ, 222, 863
- Naylor & la Dous (1997) Naylor, T. & la Dous, C. 1997, MNRAS, 290, 160
- Panek & Holm (1984) Panek, R. J. & Holm, A. V. 1984, ApJ, 277, 700
- Pringle (1988) Pringle, J. E. 1988, MNRAS, 230, 587
- Prinja & Rosen (1995) Prinja, R. K. & Rosen, R. 1995, MNRAS, 273, 461
- Prinja et al. (1992) Prinja, R. K. et al. 1992, ApJ, 390, 266
- Proga (1999) Proga, D. 1999, MNRAS, 304, 938
- Raymond, Cox, & Smith (1976) Raymond, J. C., Cox, D. P., & Smith, B. W. 1976, ApJ, 204, 290
- Ritter & Kolb (1998) Ritter, H. & Kolb, U. 1998, A&AS, 129, 83
- Sahnow et al. (2000) Sahnow, D. J., et al. 2000, ApJL, 538, L7
- Seaton (1979) Seaton, M. J. 1979, MNRAS, 187, 73P
- Shlosman et al. (1997) Shlosman, I, Vitello, P., & Mauche, C. 1997, ApJ, 471,377
- Shlosman & Vitello (1993) Shlosman, I. & Vitello, P. 1993, ApJ, 409, 372
- Shull et al. (2000) Shull, J. M., et al. 2000, ApJL, 538, L73
- Sion et al. (1998) Sion, E. M., Cheng, F. H., Szkody, P., Sparks, W., Gaensicke, B., Huang, M. & Mattei, J. 1998, ApJ, 496, 449
- Sion et al. (1997) Sion, E. M., Cheng, F. H., Szkody, P., Huang, M., Provencal, J., Sparks, W., Abbott, B., Hubeny, I., Mattei, J. & Shipman, H. 1997, ApJ, 483, 907
- Sion (1995) Sion, E. M. 1995, ApJ, 438, 876
- Sion et al. (1994) Sion, E. M., Long, K. S., Szkody, P. & Huang, M. 1994, ApJL, 430, L53
- Smak (1976) Smak, J. 1976, AcA, 26, 277
- Spitzer (1978) Spitzer, L. 1978, Physical Processes in the Interstellar Medium (New York: Wiley)
- Szkody et al. (1996) Szkody, P., Long, K. S., Sion, E. M. & Raymond, J. C. 1996, ApJ, 469, 834
- Szkody & Mattei (1984) Szkody, P. & Mattei, J. 1984, PASP, 96, 988
- Vitello & Shlosman (1993) Vitello, P. & Shlosman, I. 1993, ApJ, 410, 815
- Wade (1984) Wade, R. A. 1984, ApJ, 335, 394
- Wade (1981) Wade, R. A. 1981, ApJ, 246, 215
- Warner (1995) Warner, B. 1995, Cataclysmic Variable Stars (Cambridge:Cambridge University Press)
- White, Nagase & Parmar (1995) White, N. E., Nagase, F. & Parmar, A. N. 1995, in X-Ray Binaries, eds. W. H. G. Lewin, J. van Paradijs & E. P. J. van den Heuvel, (Cambridge: Cambridge University Press), 1
- White & Swank (1982) White, N. E. & Swank, J. H. 1982, ApJL, 253, L61
| Parameter | Value | Reference |
|---|---|---|
| 0.17690619 d | Marsh et al. 1990 | |
| km s-1 | Long & Gilliland 1999 | |
| Long & Gilliland 1999 | ||
| Long & Gilliland 1999 | ||
| Long & Gilliland 1999 | ||
| pc | Harrison et al. 1999 |
| Date (UT) | Start (UT) | End (UT) | tobs (sec) | |||
|---|---|---|---|---|---|---|
| Obs. 1 | 2000 March 05 | 16:36:37 | 0.46 | 18:43:43 | 0.96 | 2883 |
| Obs. 2 | 2000 March 07 | 10:11:18 | 0.26 | 14:04:01 | 1.17 | 6248 |
| Obs. 3 | 2000 March 09 | 13:50:17 | 0.42 | 21:04:11 | 2.12 | 7868 |
| Obs. 4 | 2000 March 17 | 11:43:20 | 0.14 | 20:34:16 | 2.25 | 12975 |
Note. — Obs. 1 consists of five spectra with integration times of 576 – 577 sec each. Obs. 2 is divided into nine spectra of roughly 700 sec exposure time each, and the Obs. 3 data consist of sixteen spectra with exposure times of 423 – 527 sec each. The Obs. 4 data were acquired in time-tag mode at high time resolution. We divided the Obs. 4 data into 42 spectra with exposure times of 300 sec (see text).
| Obs. 1 | Obs. 4 | ||||
|---|---|---|---|---|---|
| Ion | EW (Å) | FWHM (km s-1) | EW (Å) | FWHM (km s-1) | |
| N iv+ H i | 922–924;923.2 | 2.2 | 1200 | 3.1 | 1320 |
| H i | 926.2 | 0.18 | 340 | ||
| H i | 930.7 | 0.78 | 710 | 0.44 | 240 |
| S vi | 933.4 | 1.30 | 590 | 0.89 | 650 |
| H i | 937.8 | 0.51 | 430 | 0.84 | 630 |
| S vi | 944.5 | 1.35 | 650 | 0.81 | 820 |
| H i | 949.7 | 0.88 | 630 | 1.68 | 780 |
| N iv | 955.3 | 0.25 | 340 | 0.21 | 320 |
| He ii | 958.7 | 0.08 | 320 | ||
| H i | 972.5 | 0.82 | 530 | aaLine is blended with terrestrial airglow. | aaLine is blended with terrestrial airglow. |
| C iii | 977.0 | 0.29 | 390 | 1.73 | 770 |
| N iii | 979.8 | 0.10 | 270 | 0.20 | 210 |
| N iii | 989.8 | 0.21 | 290 | 1.17 | 570 |
| He ii | 992.4 | 0.47 | 510 | 1.77 | 750 |
| Si iii | 993.5 | 0.07 | 310 | 0.12 | 170 |
| Si iii | 997.4 | 0.08 | 260 | 0.16 | 190 |
| N iii | 1006.0 | 0.14 | 380 | 0.18 | 270 |
| S iii | 1012.5 | 0.06 | 210 | 0.09 | 320 |
| S iii | 1015.5 | 0.14 | 320 | 0.21 | 530 |
| S iii | 1021.1 | 0.11 | 380 | 0.27 | 430 |
| L | 1025.7 | 1.27 | 440 | aaLine is blended with terrestrial airglow. | aaLine is blended with terrestrial airglow. |
| O vi | 1031.9 | 1.46 | 850 | 1.56 | 710 |
| O vi | 1037.6 | 1.71 | 840 | 1.76 | 750 |
| S iv | 1062.7 | 0.37 | 410 | 0.60 | 520 |
| Si iv | 1066.6 | 0.24 | 540 | 0.51 | 320 |
| S iv | 1073.0 | 0.55 | 530 | 0.85 | 600 |
| S iii | 1077.2 | 0.07 | 300 | 0.05 | 290 |
| He ii | 1084.9 | 0.41 | 490 | 3.40 | 1640 |
| S iv | 1098.9 | 0.08 | 470 | 0.26 | 450 |
| Si iii | 1108.4 | 0.10 | 300 | 0.83 | 620 |
| Si iii | 1110.0 | 0.07 | 210 | 0.69 | 540 |
| Si iii | 1113.2 | 0.20 | 340 | 0.89 | 500 |
| P v | 1118.0 | 0.50 | 420 | 0.19 | 350 |
| Si iv | 1122.5 | 0.35 | 540 | 0.61 | 380 |
| P v+Si iv | 1128.0;1128.3 | 0.63 | 520 | 0.97 | 500 |
| C iii | 1125.6 | 0.06 | 150 | ||
| Si iii | 1144.3 | 0.18 | 190 | ||
| O iii | 1149.6 | 0.10 | 160 | ||
| O iii | 1150.9 | 0.12 | 153 | ||
| O iii | 1153.8 | 0.10 | 140 | ||
| C iv | 1169.0 | 0.13 | 230 | ||
| C iii | 1175.3 | 0.64 | 521 | 2.20 | 650 |
Note. — Lines marked with a are excited state transitions.
| Ion | (Å) | EW (Å) | |
|---|---|---|---|
| H i | 913.826 | 0.000170 | 0.18 |
| H i | 914.039 | 0.000197 | 0.18 |
| H i | 914.286 | 0.000229 | 0.19 |
| H i | 914.576 | 0.000270 | 0.17 |
| H i | 914.919 | 0.000321 | 0.18 |
| H i | 915.329 | 0.000385 | 0.17 |
| H i | 915.824 | 0.000468 | 0.22 |
| H i | 916.429 | 0.000577 | 0.18 |
| H i | 917.181 | 0.0007226 | 0.20 |
| H i | 918.129 | 0.0009213 | 0.20 |
| H i | 919.351 | 0.001200 | 0.20 |
| H i | 920.963 | 0.001605 | 0.20 |
| H i | 923.150 | 0.002216 | 0.21 |
| O i | 924.950 | 0.001540 | 0.04 |
| H i | 926.226 | 0.003183 | 0.22 |
| O i | 929.517 | 0.00229 | 0.05 |
| H i | 930.748 | 0.004816 | 0.22 |
| O i | 936.630 | 0.003650 | 0.06 |
| H i | 937.803 | 0.007804 | 0.23 |
| O i | 948.686 | 0.005420 | 0.06 |
| H i | 949.743 | 0.01394 | 0.24 |
| O i | 950.885 | 0.001570 | 0.05 |
| N i | 952.303 | 0.001762 | 0.02 |
| 952.415 | 0.001556 | 0.02 | |
| N i | 953.415 | 0.0131 | 0.04 |
| 953.655 | 0.0249 | 0.05 | |
| 953.970 | 0.0348 | 0.06 | |
| 954.104 | 0.00675 | 0.03 | |
| P ii | 963.801 | 1.458 | 0.03 |
| N i | 963.990 | 0.0148 | 0.06 |
| 964.626 | 0.0094 | 0.05 | |
| 965.041 | 0.0040 | 0.03 | |
| O i | 971.738 | 0.01367 | 0.06 |
| H i | 972.537 | 0.0290 | 0.27 |
| O i | 976.448 | 0.003310 | 0.07 |
| C iii | 977.020 | 0.7620 | 0.06 |
| O i | 988.578 | 0.0005530 | 0.18 |
| 988.655 | 0.008300 | aaFeature is blended with the previous line. | |
| 988.773 | 0.04650 | aaFeature is blended with the previous line. | |
| N iii | 989.799 | 0.1066 | 0.08 |
| Si ii | 989.873 | 0.1330 | aaFeature is blended with the previous line. |
| Si ii | 1020.699 | 0.02828 | 0.03 |
| H i | 1025.722 | 0.07912 | 0.44 |
| O i | 1025.762 | 0.01705 | aaFeature is blended with the previous line. |
| C ii | 1036.337 | 0.123 | 0.12 |
| O i | 1039.230 | 0.009200 | 0.08 |
| Ar i | 1048.220 | 0.263 | 0.03 |
| N ii | 1083.990 | 0.1031 | 0.08 |
| N i | 1134.165 | 0.01342 | 0.06 |
| 1134.415 | 0.02683 | 0.07 | |
| 1134.980 | 0.04023 | 0.08 | |
| Fe ii | 1144.946 | 0.15 | 0.03 |
Note. — Wavelengths and oscillator strengths are taken from Morton (1991), except for Fe II from Howk et al. (2000). The oscillator strengths of some lines have been updated by D. C. Morton and have been privately distributed; these were obtained from Jenkins et al. (2000).