Evolution of X-ray Luminous Clusters from z=0.3 to z=0.8
Abstract
Observations of the highest redshift clusters provide the longest lever arm in the attempt to evaluate the evolution of their bulk properties. I present the most recent results on galaxy cluster evolution based on data from the ROSAT North Ecliptic Pole survey. At there is a deficit of clusters with respect to the local universe which is significant at 4.7. The evolution appears to begin at L erg s-1 in the NEP survey data and goes in the same direction as the original EMSS result. At lower redshifts there is no evidence for evolution, a result in agreement with all the existing cluster surveys.
Istituto di Radioastronomia-CNR, Bologna, ITALY
Institute for Astronomy, Honolulu, Hawaii, USA
1. Introduction
The spatial abundance of distant clusters and its redshift evolution constrain cosmological parameters. For cosmological studies, however, sample completeness with well-defined selection functions is required. One of the cleanest way to avoid sample contamination is the selection of high redshift clusters by means of their X-ray emission. X-ray surveys are sensitive enough to detect objects at redshifts of order unity (e.g. MS105403 at z0.83, Gioia & Luppino 1994; RXJ1716.6+6708 at z0.81, Gioia et al. 1999; RXJ0848.9+4452 at , Rosati et al. 1999; Cl J1226.9+3332 at , Ebeling et al. 2001). At these high redshifts some evolution is expected in the look-back time that approaches half the age of the universe.
Today all the determinations of the cluster X-ray luminosity function (XLF) derived from existing surveys are in agreement for low redshifts () and for low luminosities (L erg s-1) indicating no evolution. There is no unanimous opinion yet regarding the most luminous and most distant clusters known, but results in favor of evolution are accumulating. The first evidence for negative evolution came from the Extended Medium Sensitivity Survey (EMSS; Gioia et al. 1990a; Stocke et al. 1991; Maccacaro et al. 1994) and was discussed in terms of the cluster XLF; the volume density of high redshift, high luminosity clusters is smaller than for nearby objects (Gioia et al. 1990b; Henry et al. 1992). In the past several results seemed at odds with the EMSS evolution’ s claim. However, these were made without remembering that only the high luminosity end of the XLF was claimed to evolve, a regime where the supposedly contradictory studies had no data.
In this contribution I present additional evidence regarding the evolution of the cluster population based on the ROSAT All-Sky Survey observations around the North Ecliptic Pole region (NEP). I use H 50 km s-1 Mpc -1 and q 0.5 throughout.
2. The ROSAT North Ecliptic Pole survey
The ROSAT NEP survey covers a region of the deepest area of the ROSAT All-Sky Survey (RASS; Trümper et al. 1991; Voges et al. 1999) where the scan circles converge and the effective exposure time approaches ks. Details on the ROSAT NEP survey and the X-ray data can be found in Henry et al. 2001 and Voges et al. 2001.
The main difference between the NEP survey and the existing X-ray serendipitous cluster surveys is that the NEP survey is both deep (median flux limit is f erg cm-2 s-1) and covers a contiguous area of sky (see Fig. 1). Thus the NEP ROSAT survey database can be used to examine large-scale structure in the distribution of clusters and other classes of extragalactic X-ray sources (e.g., AGN). A concentration of 21 groups and clusters was indeed found during the analysis of the NEP sources (see Mullis et al. 2001). A total of 445 X-ray sources were detected with flux determinations in the keV band using the RASS-II processing. All but two sources in the survey have been spectroscopically identified and redshifts have been measured for the extragalactic population. A complete and unbiased sample of 64 galaxy clusters has been extracted. Nineteen clusters have a redshift greater than 0.3 with the highest at z0.81. In the course of identifying sources from the X-ray NEP survey, several serendipitous discoveries were made. I mention here the beautifully extended cluster RXJ1716+67 (Fig. 2), one among the most distant (z0.81) Xray selected clusters so far published with a large number of spectroscopically determined cluster member velocities (see Gioia et al. 1999).
3. The NEP Cluster Number-Counts Relation
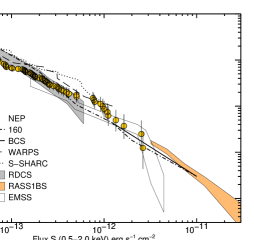
The integral number counts of galaxy clusters are a well established means to verify reliability of sky coverage and completeness of identifications. In Fig. 3, in addition to the NEP data, the observed cumulative number counts derived from the 160 deg2 (Vikhlinin et al. 1998), the BCS (Ebeling et al. 1997), the WARPS (Jones et al. 1998), the S-SHARC (Burke et al. 2001), the RDCS (Rosati et al. 1998), and the RASS1-BS (De Grandi et al. 1999) are shown. The NEP cluster number counts are in agreement within the errors with all the other independent determinations, giving us confidence that our sample is complete.
4. A deficit of high z and high LX clusters in the ROSAT NEP
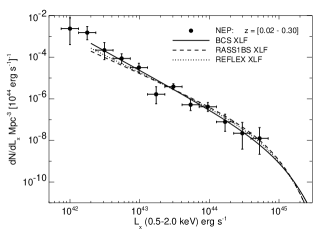
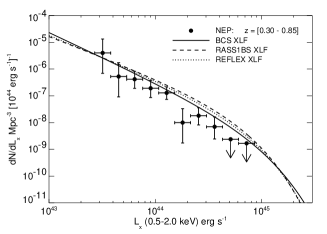
The number of observed clusters in the NEP survey has been compared to the number of expected clusters, assuming no-evolution models. The three local luminosity functions derived from the RASS1 (De Grandi et al. 1999), REFLEX (Böhringer et al. 1998) and BCS (Ebeling et al. 1997) have been folded through the NEP sky coverage and then integrated in the appropriate redshift and luminosity ranges. The ranges of integration were and in redshift, and erg s-1 in luminosity (0.5-2.0 keV).
For the redshift range, the number of clusters expected from the three local samples and observed in the NEP are consistent, with the the significance of difference equal to . For the range a value of 65.5 clusters is expected according to the RASS1, a value of 55.9 according to the REFLEX and a value of 44.2 according to the BCS. Only 19 NEP clusters are observed in the same redshift and luminosity ranges. The significance of deviation is 6.4, 7.2 or 4.7 depending on which of the three local XLF sample determinations is considered. There is a deficit of clusters at L erg s-1 and compared to expectations from a non-evolving XLF (see Fig. 4 for a plot of the NEP XLF and three local XLFs.) This result goes in the same direction as the evolution derived from the EMSS survey.
5. Discussion and Conclusions
The ROSAT NEP survey detects clusters up to z0.81. There is a deficit of clusters at high redshifts and high luminosity compared to expectations from a non-evolving XLF. Five out of six surveys now find evolution. The original EMSS (Gioia et al. 1990b; Henry et al. 1992), 160 deg2 (Vikhlinin et al. 1998), SHARC (Nichol et al. 1999), RDCS (Rosati et al. 2000) and NEP (Gioia et al. 2001) surveys are reporting negative evolution at varying levels of significance from 1 to greater than 5. The only X-ray survey that does not find negative evolution is the WARPS (Jones et al. 2000; Ebeling et al. 2001). Evidence is thus accumulating in favor of evolution at the high luminosity end of the XLF at high redshift. The essentially complete identification rate of the NEP survey gives us confidence that the deficit of clusters seen is not due to the fact that clusters have been missed. Until larger and better characterized samples are available, the results presented in this contribution represent the state of the art with respect to evolution of high redshift, high X-ray luminosity clusters.
Acknowledgments I wish to thank my collaborators who contributed to the success of the NEP survey: C. Mullis, P. Henry, H. Böhringer, U. Briel, W. Voges and J. Huchra. The ROSAT NEP survey was partially funded by NSF (AST91-19216 and AST95-00515), NASA (NAG 5-9994), NATO (CRG91-0415) and from the Italian Space Agency ASI. Finally I wish to thank Francesca Matteucci, Roberto Fusco-Femiano and all the other membErs of the OC for organizing a great meeting in a fascinating Italian island.
References
Böhringer, H., et al., 1998, The Messenger, 94, p. 21
Burke D.J. et al. 2001, in preparation
Clowe, D., Luppino, G. A., Kaiser, N., Henry, J. P., & Gioia, I. M. 1998, ApJ, 497, 61
De Grandi, S., Guzzo, L., Böhringer, H., Molendi, S., Chincarini, G., Collins, C., Cruddace, R., Neumann, D., Schindler, S., Schuecker, P. & Voges, W., 1999, ApJ, 513, L17
Ebeling, H., Edge, A.C., Böhringer, H., Allen, S.W., Crawford, C.S., Fabian, A.C., Voges, W. & Huchra, J.P., 1997, MNRAS, 301, 881
Ebeling, H., Jones, L.R., Fairley, B.W., Perlman, E., Scharf, C., Horner, D, 2001, ApJ, 548, L23
Gioia, I.M. Maccacaro, T., Morris, S., Schild, R.E., Stocke, J.T., Wolter, A. & Henry, J.P. 1990a, ApJS, 72, 567
Gioia, I.M., Henry, J.P., Maccacaro, T., Morris, S.L. Stocke, J.T. & Wolter, A., 1990b, ApJ, 356, L35
Gioia, I.M. & Luppino, G.A. 1994, ApJS, 94, 583
Gioia, I.M., Henry, J.P., Mullis, C.R., Ebeling, H. & Wolter, A. 1999, AJ, 117, 2608
Gioia, I.M., Henry, J.P., Mullis, C.R., Voges, W., Briel, U.G., Böhringer, H. & Huchra, ApJ, 553, 105
Henry, J.P., Gioia, I.M., Maccacaro, T., Morris, S.M., Stocke, J.S. & Wolter, A. 1992, ApJ, 386, 408
Henry, J.P., Gioia, I.M., Mullis, C.R., Voges, W., Briel, U.G., Böhringer, H. & Huchra, J.P. 2001, ApJ, 553, 109
Jones, L.R., Scharf, C., Ebeling, H., Perlman, E., Wegner, G., Malkan, M. & Horner, D., 1998, ApJ, 495, 100
Jones, L.R., Ebeling, H., Scharf, C., Perlman, E., Horner, D., Fairley, B.W., Ellis, S., Wegner, D. & Malkan M. 2000, in http://www.iap.fr/Conferences/ Colloque/coll2000/ contributions Reference: 5.5.5.
Maccacaro, T., Wolter, A., McLean, B., Gioia, I.M., Stocke, J.T., Della Ceca, R., Burg, R. & Faccini, R. 1994, Astroph. Let and Com., 29, 1
Mullis, C.R., Henry, J.P., Gioia, I.M., Böhringer, H., Briel, U.G., Voges, W. & Huchra, J.P. 2001, ApJ, 553, 115
Nichol, R.C., Romer, A.K., Holden, B.P., Ulmer, M.P., Pildis, R.A., Adami, C., Merrelli, A.J., Burke, D.J. & Collins, C.A., 1999, ApJ, 521, L21
Rosati, P., Della Ceca, R. Norman, C. & Giacconi, R., 1998, ApJ, 492, L21
Rosati, P., Stanford, S.A., Eisenhardt, P.R., Elston, R., Spinrad, H., Stern, D. & Dey, A. 1999, AJ, 118, 76
Rosati, P., Borgani, S., Della Ceca, R., Stanford, A., Eisenhardt, P. & Lidman, C., 2000, in “Large-Scale Structure in the X-ray Universe”, eds. Plionis & Georgantopoulos, Atlantisciences, Paris, France, p. 13
Stocke, J.T., Morris, S.L., Gioia, I.M., Maccacaro, T., Schild, R.E., Wolter, A., Fleming, T.A. & Henry, J.P. 1991, ApJS, 76, 813
Trümper, J., et al. 1991, Nature, 349, 579
Vikhlinin, A., McNamara, B.R., Forman, W., Jones, C., Quintana, H. & Hornstrup A., 1998, ApJ, 498, L21
Voges, W., et al. 1999, A&A, 349, 389
Voges, W., Henry, J.P., Briel, U.G., Böhringer, H., Mullis, C.R., Gioia, I.M. & Huchra, J. 2001, ApJ, 553, 119