The Reddest Quasars
Abstract
In a survey of quasar candidates selected by matching the FIRST and 2MASS catalogs, we have found two extraordinarily red quasars. FIRST J013435.7093102 is a 1 Jy source at and has , while FIRST J073820.1+275045 is a 2.5 mJy source at z=1.985 with . FIRST J073820.1+275045 has strong absorption lines of Mg II and C IV in the rest frame of the quasar and is highly polarized in the rest frame ultraviolet, strongly favoring the interpretation that its red spectral energy distribution is caused by dust reddening local to the quasar. FIRST J073820.1+275045 is thus one of the few low radio-luminosity, highly dust-reddened quasars known. The available observational evidence for FIRST J013435.7093102 leads us to conclude that it too is reddened by dust. We show that FIRST J013435.7093102 is gravitationally lensed, increasing the number of known lensed, extremely dust-reddened quasars to at least three, including MG04140534 and PKS1830211. We discuss the implications of whether these objects are reddened by dust in the host or lensing galaxies. If reddened by their local environment, then we estimate that between 10 and 20% of the radio-loud quasar population is reddened by dust in the host galaxy. The discovery of FIRST J073820.1+275045 and objects now emerging from X-ray surveys suggests the existence of an analogous radio-quiet red quasar population. Such objects will be entirely missed by standard radio or optical quasar surveys. If dust in the lensing galaxies is primarily responsible for the extreme redness of the lensed quasars, then an untold number of gravitationally lensed quasars are being overlooked.
1 Introduction
The vast majority of the catalogued quasars have very similar optical spectral energy distributions: a very blue continuum with prominent broad emission lines. Several studies provide evidence that a population of red quasars also exists, overlooked by surveys optimized to find quasars by their UV excess and strong emission lines. The size of any such “hidden” population of quasars is important for a complete understanding of the quasar phenomenon. Low et al. (1989) found that the majority of quasars in a small IR-selected sample were significantly redder than optically selected objects. Sprayberry & Foltz (1992) argue that the larger dust extinction and very weak emission features in low ionization broad absorption line (BAL) quasars means that they are underrepresented in the known quasar population. Using a much larger sample, Webster et al. (1995) have argued that the large range of colors (1 to 8) of radio-selected quasars implies that up to 80% of quasars are undetected because of several magnitudes of dust obscuration. Adding fuel to the fire are the discoveries of striking examples of individual QSO’s with extremely red spectral energy distributions and/or lacking prominent emission lines. The continuum of 3CR 68.1 () is highly reddened (Brotherton et al. 1998) and polarized. And the original radio-loud BAL, FIRST J155633.8+351758 (; Becker et al. 1997), is also quite red with (Hall et al. 1997) and very weak or absent broad emission lines. Further evidence of red quasars comes from X-ray surveys. Dust reddened quasars are faint or invisible in soft X-rays because of the high columns of associated absorbing gas (Risaliti et al. 2001) but are relatively bright in hard X-ray surveys now being done with Chandra (Barger et al. 2001). Countering the dusty quasar argument are the studies of Benn et al. (1998) and Whiting, Webster, & Francis (2001) showing that radio-selected quasars are often red because of an excess of flux at long wavelengths from host galaxy contributions or a red synchrotron component rather than from extinction at shorter wavelengths.
Determining the fraction of very red quasars in the total population, regardless of the cause of their redness, is essential for a precise determination of the quasar luminosity function, and bears directly on the evolution of quasars and the nature of the quasar-galaxy connection. Also important is whether the red quasar population may harbor a significant number of optically faint, gravitationally lensed objects, where extinction in an intervening dusty lens reddens the quasar light and cancels the magnification bias which accompanies dust-free lensing (Bartelmann & Loeb 1999). A sizable population of red lensed quasars would have significant ramifications for any conclusions based on the statistics of gravitational lensing.
The 2-Micron All-Sky Survey (2MASS; Kleinmann et al. 1994) provides an opportunity for gauging the population of very red quasars, and determining the fraction missed by optically-selected quasar surveys. With a resolution of 4″ and limiting magnitude of 14.3, 2MASS will catalog sources with high-precision coordinates and IR fluxes. The overwhelming majority of unresolved 2MASS sources are ordinary Galactic stars, so to use 2MASS effectively in selecting extragalactic point sources requires additional information. We have matched 2MASS with the VLA FIRST Survey 20cm catalog (Becker et al. 1995; White et al. 1997), obtaining a sample dominated by extragalactic sources. Particularly interesting for the red quasar question is the subset of FIRST/2MASS matches that are too faint in the optical to appear in extant optical catalogs such as the APM (McMahon & Irwin 1992).
We are in the early stages of a program using imaging and spectroscopy to investigate the nature of these objects. We report here the discovery of two extremely red quasars from our sample, FIRST J013435.7093102 (also known as PKS 0132097) and FIRST J073820.1+275045 (hereafter J01340931 and J0738+2750, respectively). We list their 2MASS magnitudes and FIRST positions and 20cm fluxes in Table 1. Neither is bright enough optically to appear in the APM catalog, though both are faintly visible on the digitized second generation sky survey. Both appear to be intrinsically red. One object, J0134-0931, is extremely bright in the IR, which we argue below is due to gravitational lensing. The gravitationally lensed nature of J0134-0931 has been independently discovered by Winn et al. (2001a), who investigate its radio properties in detail. We discuss whether the redness of these two quasars arises in the host galaxy or an intervening galaxy along the line of sight, and compare their properties to other very red quasars in the literature, in particular MG 0414+0534 (Hewitt et al. 1992) and PKS 1830211 (Jauncey et al. 1991; Courbin et al. 1998) which have similarly extreme optical – near-infrared colors (Table 1). If even one or two of the lensed objects with extreme spectral energy distributions is intrinsically red, then the statistics imply that a significant unlensed population of red quasars probably exists, of which J0738+2750 is an example, and the discovery of the two IR-bright, optically faint quasars in the 2MASS-FIRST sample is further evidence that optically selected quasars do not provide a complete sampling of the quasar population. The intrinsically red interpretation leads us to speculate that many, perhaps even most, quasars may undergo a red phase early in their lives when the active galactic nucleus (AGN) first turns on. If, on the other hand, the lensed quasars are reddened by dusty lensing galaxies, then there must exist numerous undiscovered, optically faint, gravitationally lensed quasars with small () image separations.
2 Observations
2.1 J0738+2750
J0738+2750 has and a FIRST 20cm flux density of 2.6 mJy. In 1999 November, we obtained an optical spectrum of J0738+2750 using the Low Resolution Imaging Spectrograph (LRIS, Oke at al. 1995) at Keck Observatory. The spectrum reveals a very red continuum and identifiable, but relatively weak, quasar emission features (Figure 1) at . The C IV emission is particularly weak and both Mg II and C IV show narrow line doublet absorption at or near the emission line reference frame. The Mg II absorption comprises three discrete systems at redshifts of 1.97496, 1.98535, and 1.99127, while the C IV appears to be single and at the emission line redshift. The C IV absorption features appear marginally resolved; higher resolution data may reveal multiple components in the C IV absorption, but at much lower velocity dispersion than in Mg II. The velocity dispersion of the three Mg II systems is in the quasar rest frame. A broad absorption trough extends from -13000 to -17500 , reaching a depth of of the continuum level; we identify this as due to Mg II, making J0738+2750 a weak BAL quasar. Fe II absorption systems (Å) corresponding to each of the three Mg II absorbers are also present, as is C II] emission, which is unusually strong relative to the other emission lines. There is also an intervening Mg II + Fe II absorption system at .
In 2000 January, we obtained 36 minutes of spectropolarimetry of J0738+2750, again using LRIS. These data show that this quasar highly polarized in the optical, ranging from 5% at Mg II to more than 9% at C IV (Figure 1).
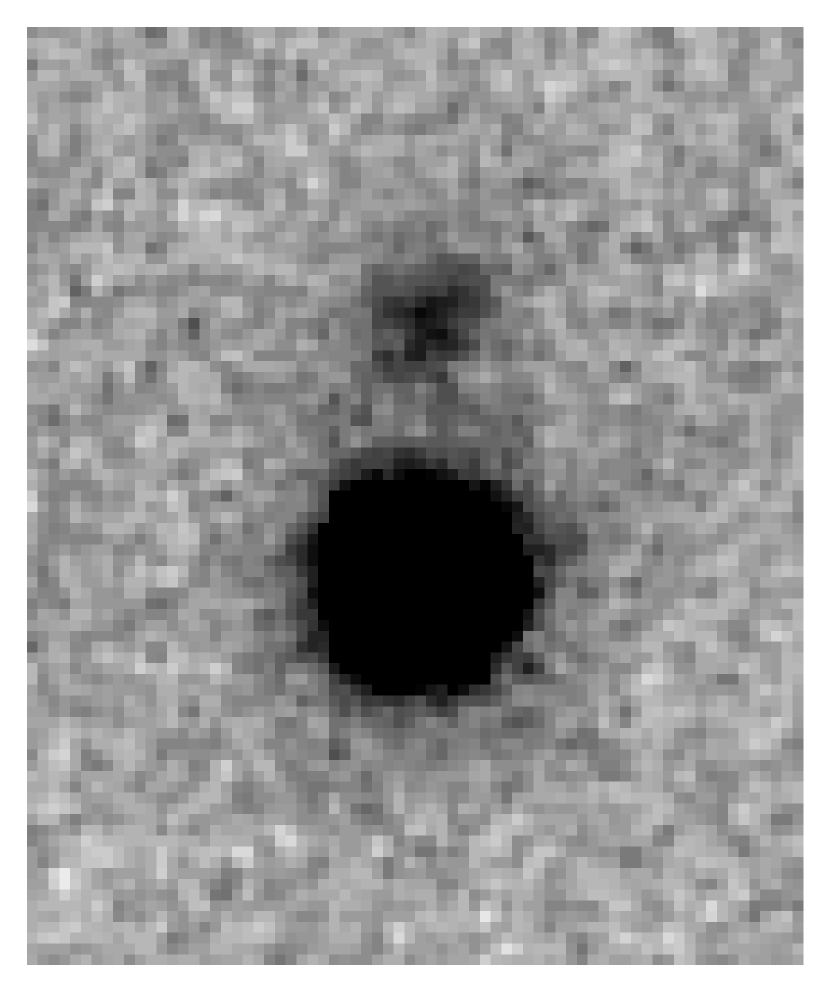
In 2000 April, we obtained and band images of J0738+2750 (Figure 2) in photometric conditions using the Near Infrared Imaging Camera (NIRC, Matthews & Soifer, 1994) at Keck Observatory. The 9 point dither pattern totaled 270s of integration time. Although the seeing was , instrument rotator problems limited the resolution to roughly twice that. At this level, J0738+2750 is unresolved, but 18 away is a faint galaxy which is perhaps the source of the intervening absorption lines.
2.2 FIRST J0134-0931
J0134-0931 is distinguished by being both a strong radio source (900 mJy at 20 cm in the FIRST survey) and a very bright infrared object, with 2MASS . It is identified in NED as a quasar, but no redshift is given. The original Veron-Cetty & Veron catalog listed objects as quasars if they were stellar optical identifications of radio sources, without requiring spectral confirmation. The optical “identification” of J0134-0931 is found in Bolton, Shimmens, & Wall (1975), the seventh part of the Parkes catalog, where finding charts for optical counterpart candidates are presented for 122 radio sources. For 121 of these, the photographic finding charts show an obvious optical source, but for PKS0132-097, the tick marks enclose blank sky. Thus, this quasar, “discovered” nearly thirty years ago, not only had no redshift, but also had no optical identification.
In 2000 August, we obtained an infrared spectrum of J0134-0931 at Lick Observatory using the Gemini IR imaging spectrograph on the Shane 3m telescope. The spectrum (Figure 3) covers windows in , and , with resolution varying from 30Å in to 120Å in . A single broad emission feature is seen at a wavelength of , which we ascribed to H at . The observed FWHM of this line is 280Å, more than twice the instrumental resolution of 120Å. This identification was confirmed by an optical spectrum obtained with the Andalucia Faint Object Spectrograph Camera (ALFOSC) on the Nordic Optical Telescope (NOT) at La Palma on 2000 October 30 and 31. The observations consisted of two 1800s exposures covering the 4000-9000Å region, and a single 1800s exposure with a different grism to extend the wavelength coverage redwards to . Both sets of observations were made with a 12 slit at a PA of 125° at an airmass of . The seeing was 09 on both nights and the resolution was 15Å for both spectra. The optical spectrum clearly shows emission lines of C III] and Mg II at a redshift of (Figure 3); C IV is weakly detected.
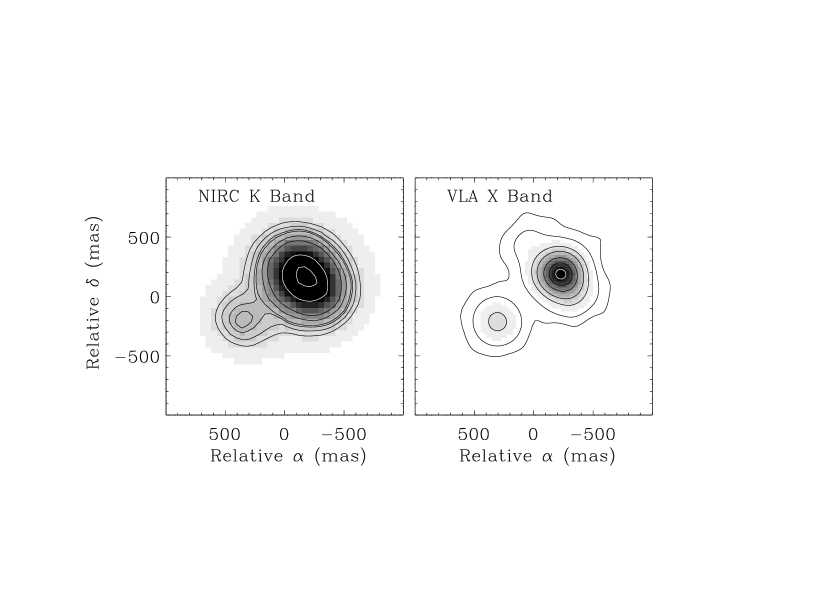
Images of J0134-0931 were obtained with NIRC in and in 2000 September, totaling 270s of integration each. Conditions were photometric, the seeing at was 037, and the instrument rotator problem (which compromised the NIRC observation of J0738+2750) had been fixed. The data were reduced using the dimsum package in iraf up to the point of sky subtraction, after which the dithered exposures were subsampled with a spline interpolation by a factor of 3.14, then shifted and combined. The image (Figure 4) clearly resolves two components, the brighter component (A) being extended along one axis in both and bands. daophot/iraf was used to construct a point spread function (PSF) from a star near the edge of the image. Fitting and subtracting the PSF shows that component D is consistent with a point source while A leaves large residuals. (For consistency, we have retroactively adopted the nomenclature of Winn et al. 2001a where the components are ranked by radio flux; see also below.) The centroids of the two objects are 0635 apart.
A 110s observation of J0134-0931 made on 1992 December 31 with the Very Large Array (VLA) in the A-configuration at 8.4 GHz (3.6cm) was recovered from the NRAO archive. The data were calibrated using observations of 0141-094 and 3C286 with the aips software package. The resulting map (Figure 4) has a resolution of 03 and is very similar to the NIRC image, showing two components, the brighter being resolved in one axis at the same position angle as in the infrared. Using aips imfit to fit elliptical gaussians to components A and D yields total fluxes of 518 and 69.0 mJy, respectively, separated by 0660. See the accompanying paper by Winn et al. (2001a) for an in-depth discussion of the radio properties of J0134-0931.
3 Analysis and Discussion
3.1 Lensing of FIRST J0134-0931
The apparent extremely large luminosity of J0134-0931 initially led us to suspect that gravitational lensing was at work. Adopting H∘ = 70 and , the redshift of J0134-0931 implies that even before dereddening. In the absence of lensing, it would be one of the most luminous objects in the Universe. The morphological similarity of the NIRC K’-band image and the VLA 3.6cm map virtually confirms that gravitational lensing is at work.
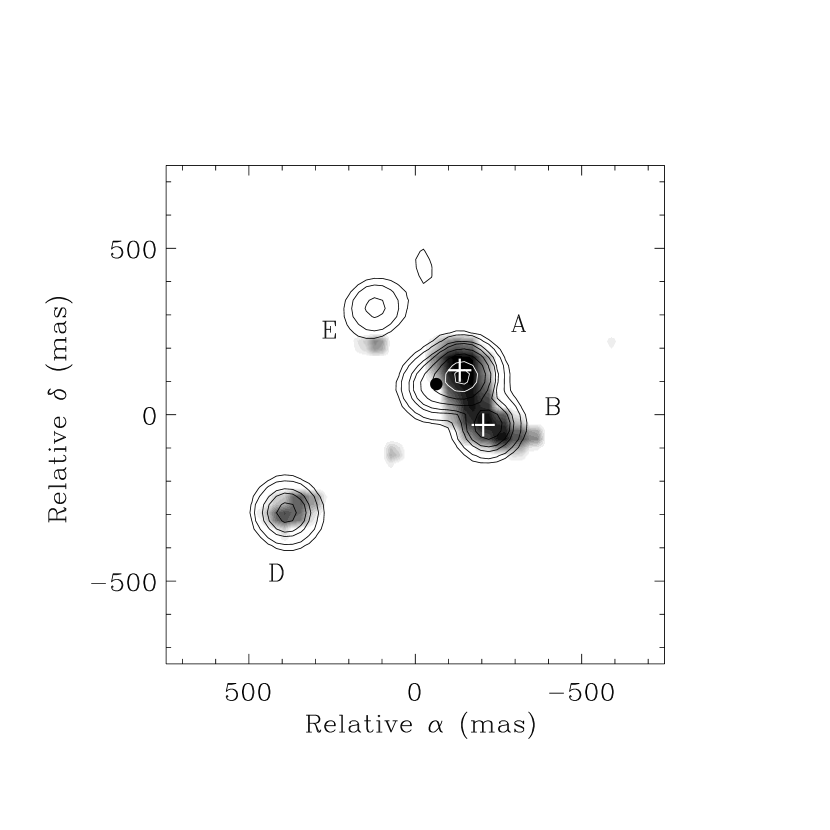
Early in our analysis of J0134-0931, we became aware of the independent work of Winn et al. (2001a) showing that J0134-0931 is a 5-component radio source, which they also interpreted as due to lensing. To explore the lensing nature of this object further and to compare the infrared and radio morphologies, we deconvolved our NIRC -band image of J0134-0931 using a variety of techniques. All produced qualitatively similar results; here we discuss those from the maximum entropy task mem in iraf. The deconvolved image is shown in Figure 5 as greyscale, smoothed to reduce the pixelation, and has an effective resolution of (2 pixels). The deconvolution breaks component A into two peaks, A and B (marked by crosses in Figure 5), perhaps with some associated extended structure at lower surface brightness. Component D is consistent with a point source in our image. A fainter and much less certain source, E, lies to the northeast, plus a hint of excess flux remaining between components A and D.
We next used the difmap package (Shepherd 1997) to map and fit models to the archival VLA data. A check of the NASA Extragalactic Database (NED) shows that J0134-0931 is a GigaHertz-peaked spectrum (GPS) radio source, and therefore we expect the dominant emission regions to have a small size compared to the VLA beam (O’Dea, Baum & Stanghellini 1991), so we fit models consisting only of point sources to the data. Initially we used four point sources: three to account for the resolved brighter component, plus a fourth for component D. A fifth source, C, just to the SE of the brightest component (A) was required to reduce the otherwise large residuals and to produce a reasonable fit to the high S/N data. These five sources account for 96% of the flux and there is no evidence for further discrete components in the residual map, to a limit of mJy (). The resulting model is shown in Figure 5, convolved with a restoring beam to match approximately the resolution of the deconvolved NIRC image; the position of C is indicated by a black dot. The four components A, B, C, and E have fluxes of 346, 84, 79, and 20 mJy respectively, while D is 65 mJy. These ratios are roughly 100 : 24 : 23 : 19 : 5.8 (A through E). The radio positions and flux ratios are consistent with the more detailed, higher resolution results of Winn et al. (2001a).
The radio and IR images in Figure 5 have been placed on the same scale and registered using component D. There is good positional agreement for components A and B; the NIRC data suggest an object consistent with E, and at still lower significance there is a hint of another component roughly midway between A and D. Better signal-to-noise and resolution are needed to test the reality of these fainter components.
Fitting PSFs at the locations of the five radio components in the original image with daophot/iraf greatly reduces the residuals over the single PSF A-component case, and significantly improves the fit over those with just two or even three components. The relative fluxes A:B:C:D:E are, roughly, 100 : 90 : 10 : 25 : 5. Using the cplucy deconvolution task iraf, we arrive at very similar flux ratios for the 5 component case, 100 : 90 : 14 : 26 : 6. Given the limited spatial resolution and depth of the data, the results of fitting five components is evidence only for a qualitative consistency between the radio and infrared images.
The overall similarity of the -band and 3.6cm images leads us to conclude that J0134-0931 is gravitationally lensed, but the exact nature of the lensing is unclear. One possibility is a quadruple image, the 4 components being A, B, D, and E, though the latter is not unambiguously detected in the NIRC images. Component C, clearly detected in the radio and perhaps marginally needed to account for the 2 flux, is difficult to interpret, but is perhaps structure in the quasar radio source and aligned optical emission. The observed mismatch between the radio and infrared images can be ascribed to insufficient resolution and signal-to-noise of the -band data, real optical/radio morphology differences among the components, or even variability of the radio source.
One obvious discrepancy between the radio and infrared is the relative brightness of A and B; though comparable at 2, there is a factor of 4 difference at 3.6cm. In support of the result, similar analysis with cplucy and daophot of the somewhat lower resolution (05) NIRC -band image finds that B is at least 80% as bright as A. At the same time, the flux ratio of the sum of the close components (A, B, C, E) to component D is remarkably similar at 3.6cm (8.1) and (8.0) especially given the brightness differences seen among the four closest components. In the -band image, we find the A/D brightness ratio to be much greater, . At the redshift of J0134-0931, the observed -band is rest frame near-UV, so the change in color between and of the two components implies significant differential reddening, or possibly microlensing effects, or both.
The reader is referred to Winn et al. (2001a) for an in-depth multi-frequency, high resolution radio analysis of the gravitational lensing of J0134-0931, including a more in-depth discussion of the lensing model possibilities.
3.2 Constraining the Reddening
From the flux calibrated LRIS spectrum of J0738+2750, we obtain ; combining with the 2MASS data yields a relatively red . From our composite optical/IR spectrum of J0134-0931, we measure and a lower limit – there are no detected counts in the passband. The extreme red color of J0134-0931 is confirmed by the broad band photometry of Winn et al. (2001a). The foreground Galactic extinctions (Schlegel, Finkbeiner, & Davis 1998) are small in both cases (Table 1). These colors are approximate given the uncertainties of the spectrophotometric calibration, but the extremely red observed spectral energy distributions of these objects are beyond question. A critical issue is whether the redness of these unusual objects is due to environmental effects local to the quasar or to intervening extinction somewhere along our line of sight.
The strong absorption features in the spectrum of J0738+2750 at the same redshift as the emission lines argue strongly that in this particular case, the reddening arises locally to the quasar. The intervening absorption features are not particularly strong; many quasars with similar intervening systems are not noticeably reddened (White et al. 2000). The strong polarization (Figure 1), indicative of large amounts of local scattering, is also strong evidence that reddening by dust is responsible for the atypical spectral energy distribution of this object. Sprayberry & Foltz (1992) have found that BAL quasars are intrinsically redder than non-BAL quasars, so even the modest Mg II BAL (Figure 1) is consistent with local reddening in J0738+2750.
Determining the origin of the redness of J0134-0931 is more difficult. There are no prominent absorption lines in the optical spectrum and the gravitational lens interpretation raises the real possibility of intervening reddening and extinction. Dusty lenses have been debated as the source of the redness in lensed quasars (Malhotra, Rhoads, & Turner 1997; Kochanek et al. 2000).
We have attempted to constrain the redshift of the dust using simple least squares minimization and various popular extinction laws to redden the composite quasar template spectrum of Brotherton et al. (2001) to match the observed spectra of J0738+2750 and J0134-0931. The standard Milky Way reddening curve fails because of the 2175Å silicate “bump,” which does not appear in either source. The starburst reddening law of Calzetti et al. (1994) can produce a red quasar spectrum that matched the targets, but could not simultaneously fit the 2MASS photometry points, regardless of the assumed redshift for the dust. Only the SMC extinction curve (Pei 1992) could produce results approximating the overall spectral energy distributions of J0738+2750 and J0134-0931, though still not with complete success.
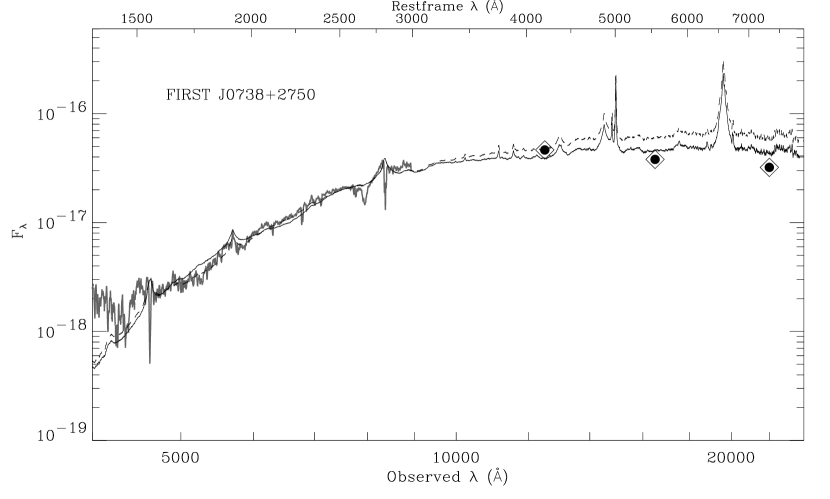
Figure 6 compares J0738+2750 with the result of reddening the composite spectrum by , assuming the reddening occurs in the quasar frame. The 2MASS photometry points were not used to constrain the fit because of the uncertainty of the scaling between the slit spectroscopy flux calibration and the IR aperture photometry, which we estimate to be 10-30%. Given the uncertainties of applying the SMC reddening in this environment, the fit is reasonably good over the range covered by the Keck spectrum, and fits the 2MASS points within the overall scaling uncertainty. There is a continuum slope mismatch at longer wavelengths, perhaps because of a real difference between the intrinsic unreddened continuum of J0738+2750 and the quasar composite. The observed turndown is a general characteristic of a reddened power law spectral energy distribution (Francis, Whiting, & Webster 2000). Adjusting the redshift of the extinction to the intervening absorber system at 1.424 leads to a slight improvement in the fit over the region covered by the LRIS spectrum, but the fit is the IR is significantly worse. There is evidence for excess light in J0738+2750 compared to the reddened quasar spectrum at short wavelengths (Å), which is probably scattered quasar light, though a contribution from young stars in the host galaxy cannot be ruled out. Based on the high polarization and the overall consistency of the reddening fits, we conclude that J0738+2750 is reddened by dust local to the quasar.
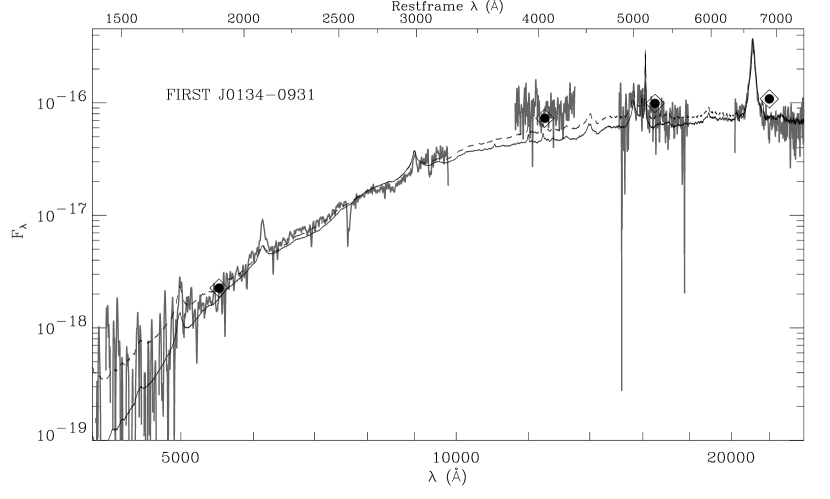
Figure 7 shows the observed optical-IR spectrum of J0134-0931, with the 2MASS and band photometry (Winn et al. 2001a) overplotted. We have scaled the photometry points by a factor of 0.7 by eye to bring them into agreement with the spectrum; the overall agreement confirms that the two spectral regions are scaled correctly. The -band point drops to the continuum level of the spectrum if corrected for the presence of the strong H line. Two reddened versions of the composite spectrum are also overplotted. The solid line is the composite reddened by with dust local to the quasar. While the overall shape of the spectrum is reproduced, the fit does not account for the flux in the -band, and the slope of the continuum is not reproduced for wavelengths redward of . The dotted line spectrum shows the result of placing the dust at , where the best fit using the SMC law yields . Moving the dust to lower redshift results in a slightly improved fit in the IR and perhaps marginally better fit in the optical, but this is not compelling, given that the same is true for J0738+2750 where the polarization points conclusively to dust in the quasar environment. Lacking additional evidence, such as polarization measurements or absorption features in the spectrum, we conclude that our present data are consistent with dust reddening of J0134-0931, but the redshift of the dust is unconstrained by the modeling.
The existing circumstantial evidence is equally ambiguous as to the location of the reddening of J0134-0931. GPS sources like J0134-0931 frequently occur in systems obscured by large amounts of gas and dust (O’Dea et al. 1996) and where the hosts are often morphologically “disturbed”, perhaps mergers or interacting galaxies (see review by O’Dea 1998). A significant amount of dust associated with the interaction could account for the extreme red energy distribution of J0134-0931. If J0134-0931 is a merger or interacting system with large amounts of dust, then the difficulty in consistently interpreting its IR and radio morphology (see also Winn et al. 2001a) may not be surprising. The differential reddening that we find in J0134-0931, however, is highly suggestive of a dusty lens, though microlensing, which may be needed to explain at least some of the details, cannot be ruled out. This object is slated for imaging during Cycle 10 of the Hubble Space Telescope (Falco et al. GO9133); the higher resolution optical data may resolve the situation. Spectropolarimetry would also help determine the whereabouts of the dust. It is, of course, possible that both the host and the lens are dusty.
The differences between the reddened composite quasar and the observed red quasars can be ascribed to a multitude of factors. Strong iron emission can possibly account for much of the difference in the band. The turnover and slope mismatch is perhaps due to intrinsic differences between the continuum slopes. There may be host galaxy contributions with different levels of reddening than the quasars, and the extinction laws are almost certainly different from the SMC. An infrared spectrum of J0738+2750 and a higher S/N infrared spectrum for J0134-0931 documenting H will permit detailed modeling, as was done by Lawrence et al. (1995a) for the red lensed quasar MG 0414+0534, and may help clarify these issues. Determining the optical colors of the individual components, which will be possible with the HST images, will also aid in unraveling the nature of J0134-0931.
To conclude, our data for J0738+2750 place the source of extinction firmly in the host galaxy. Our results are somewhat less certain in the case of J0134-0931. The lack of strong absorption features in its spectrum suggests that if the lens is dusty, then it must be at a low enough redshift to place telltale absorption features far enough into the blue that they are undetected in our spectrum. With the presently available information, we cannot pin down the redshift of the dust for J0134-0931.
4 Implications for the Red Quasar Population
How numerous are dust-reddened objects such as J0134-0931 and J0738+2750? Such unusually red quasars suffer so much extinction in their restframe ultraviolet that they are rendered practically invisible even at moderate redshifts and are potentially severely underestimated in optically-selected samples. Establishing the size of this red population is of paramount importance to a full understanding of the general quasar phenomenon and to the interpretation of quasar gravitational lensing statistics.
Although the very red spectral energy distributions of J0134-0931 and J0738+2750 are unusual compared to the large majority of optically-selected quasars, such red objects are much more common among radio-selected samples of both unlensed (Webster et al. 1995; Francis et al. 2000) and lensed quasars (Malhotra et al. 1997). Using matched populations of radio- and optically-selected quasars, Francis et al. (2000) demonstrate that most optically-selected quasars fall in a narrow color range, ; roughly 50% of radio-selected quasars have similar colors, but the other half are distributed over the range . Malhotra et al. (1997) have shown that a similar color dichotomy exists for the known lensed quasars. Optically-discovered lensed quasars have broad band colors consistent with the general quasar population, typically , while radio-discovered lensed quasars span a much wider and redder color range, having , including one of the reddest extragalactic objects known, MG 0414+0534 with (Lawrence et al. 1995a).
A color of corresponds to an effective optical-infrared spectral index (defining in the sense that flux density ); we hereafter adopt this our working definition of a “red quasar”.
4.1 Red Quasars in Unlensed Samples
To estimate the fraction of dusty red quasars in the general population requires an understanding of why the color distribution of unlensed, radio-selected quasars differs from that of the optically-selected counterparts. Benn et al. (1998), Francis et al. (2000), and Whiting et al. (2001) argue that many of the red quasars in the sample of Webster et al. (1995) have intrinsically red spectra due to optical/near-infrared synchrotron emission from the radio jets in these relatively bright, flat-spectrum radio sources, but Francis et al. (2000) conclude that dust is necessary to account for a significant fraction of red quasars, amounting to of the total population. The 3CRR sample of 173 quasars and galaxies (Laing, Riley & Longair 1983) contains a number of quasars which have colors significantly redder than the general population. As 3CRR is selected at low radio frequencies, the beamed emission from the radio jet which can produce strong optical synchrotron emission is much reduced compared to the sample of Webster et al. (1995), and thus these quasar spectra are unlikely to have significant red optical synchrotron components. The fraction of quasars significantly reddened by dust in 3CRR has been estimated by Simpson et al. (1999) as %, larger than the fraction deduced by Francis et al. (2000), but with small number statistics producing the large error bars.
Most optical surveys for quasars rely on some form of blue color selection criterion, so it is not surprising that red quasars suffering large extinction should be missing from optically-selected samples. It is conceivable, however, that the radio-quiet quasar population simply has, for some reason, no red objects (). J0738+2750, although not radio-quiet, is radio-intermediate (if the optical emission is dereddened), suggesting that this is probably not the case. Evidence that such objects may be relatively common comes from identifications of Chandra hard X-ray sources (Barger et al. 2000) which find significant numbers of lightly-reddened quasars, and one example of a “Quasar-2”, in which the broad line region is completely hidden by dust (Norman et al. 2001). Similarly, using an objective prism survey and ROSAT data, Risaliti et al. (2001) have identified quasars with anomalously low soft X-ray fluxes, indicating a significant absorbing column, and find that these quasars are significantly redder in the optical than the general population. All of these results suggest that there is a substantial population of radio-quieter red quasars, and that the intrinsic color distributions of radio-loud and radio-quiet quasars may well be similar.
4.2 Red Lensed Quasars
The different color distributions of optical- and radio-selected lensed quasars documented by Malhotra et al. (1997) can be explained largely as a natural consequence of the above discussion – red quasars are missing from the optically-selected samples to begin with. Two other factors enhance the numbers of red, radio-selected lensed quasars, explaining why Malhotra et al. (1997) find that the colors of radio-loud lensed quasars are even redder than those of the general radio-loud unlensed population. First, a very dusty lensing galaxy can significantly redden the quasar light. This appears to be the explanation for the very red quasar PKS1830-211. The high differential reddening (Courbin et al. 1998) between the components of PKS 1830-211 and the strong differential molecular absorption at an intervening redshift (Frye, Welch, & Broadhurst 1997; Menten et al. 1999) is near-conclusive evidence that the responsible dust is in the lensing galaxy and that the color differences are not intrinsic to the source or due to microlensing effects (Courbin et al. 1998).
The second factor contributing to the high numbers of red radio-selected lensed objects is that lensing can magnify the host galaxy contributions, invariably redder than the quasar light. Host galaxy starlight probably explains the very red colors of MG 1131+0456 and B 1938+666 (Kochanek et al. 2000). But Hubble Space Telescope NICMOS images and near-infrared spectra show that host galaxy contributions are negligible for the extremely red lensed quasar MG 0414+0534 (Lawrence et al. 1995a), which has colors comparable to J0134-0931 (see Table 1). Although Lawrence et al. (1995a) conclude from multicomponent spectral modeling that a dusty lens is responsible for the red color of MG 0414+0534, the circumstantial evidence argues that the redness arises from dust local to the quasar. First, it is a GPS source. There are also very strong low-ionization absorption features of Mg II and Fe I at the host redshift (Lawrence et al. 1995b), much like the case of J0738+2750 discussed above, as well as 21cm Hi absorption with a column consistent with the observed reddening (Moore, Carilli, & Menten 1998). In addition, the lensing galaxy seems to be a typical elliptical with a low dust content (Tonry & Kochanek 1999).
The size of the quasar population which is reddened by dust local to the source can be estimated from the statistics of radio-discovered gravitationally lensed quasars. There are now roughly 18 to 20 gravitationally lensed quasars from various radio searches, including the Jodrell Bank-VLA Astrometric Survey (JVAS, Patnaik & Narasimha 1993), the Cosmic Lens All-Sky Survey (CLASS, Phillips et al. 2001) and Winn et al. (2000; 2001b,c). Among these are the three extremely red objects PKS 1830-211 (Courbin et al. 1998), MG0414+0534 (Hewitt et al. 1992) and J0134-0931 (Winn et al. 2001a and this work). Assuming that both J0134-0931 and MG0414+0534 are reddened by dust local to the quasar, then of the radio-selected objects are intrinsically red quasars.
If, however, J0134-0931 and MG0414+0534 are, along with PKS 1830-211, reddened by their lensing galaxies, the implication is that a potentially large number of gravitationally lensed quasars exists. As only of quasars are radio-loud, such a population will be times as large as the radio-loud lensed quasars. As dusty lenses are likely to be lower mass, late-type galaxies, the image separations will be small and extinction in the lensing galaxy can more than counteract any amplification of the quasar light (Bartelmann & Loeb 1998). Such radio-quiet lensed objects are extremely difficult to discover at any wavelength.
4.3 Origin of Intrinsically Red Quasars
Two possible explanations for the existence of intrinsically dust-reddened quasars are youth and orientation. Both the GPS and BAL phenomena have been conjectured to occur early in the lives of quasars (O’Dea et al. 1996; Becker et al. 2000). The reddest quasars, exemplified by J0134-0931 and MG 0414+0534, both GPS sources, and J0738+2750, with a BAL feature, may thus be early evolutionary phases in the lives of quasars, when the AGN is first activated or is refueled. Furthermore, Baker & Hunstead (1997), in a sample of quasars selected from the Molongolo radio source catalogue found that the compact steep spectrum (CSS) quasars in their sample typically had redder than average optical spectra and higher Balmer decrements. Like GPS sources, CSS sources are thought to be young, with source evolution proceeding from the GPS through the CSS to the fully-developed FRII stage (de Vries et al. 1998).
Alternatively, within the context of “unified schemes” (Antonucci 1993), red quasars may represent objects whose quasar light is just grazing the dusty torus which hides the quasar nucleus of narrow-line AGN. There are well-studied examples from the 3CRR sample which suggest that youth and orientation are each partly responsible for the red quasar population: 3C190 is a CSS radio source in a spectacular merging host galaxy and so possibly a young quasar (Stockton & Ridgway 2001), whereas 3C22 and 3C68.1 have all the hallmarks of evolved radio sources at an angle to the line of sight roughly corresponding to the hypothesised torus opening angle of deg.
5 Conclusions
If J0134-0931 and MG0414+0534 are intrinsically red, then the statistics of lensed and unlensed radio-selected red quasars imply that % of radio-loud quasars are significantly reddened by dust in the host galaxy. The case of J0738+2750 proves that there are at least some dust reddened quasars with radio luminosities less than the very high values typical of 3CRR and JVAS/CLASS sources. If such intrinsically red objects exist in similar proportion to the radio-loud red quasars, then a substantial population of red, radio-quiet objects awaits discovery. The relative numbers of red quasars and their redshift distribution can set limits on the relative lengths of the red phase and its possible relation to the BAL and GPS phases.
If J0134-0931 and MG0414+0534 are reddened by dust in their lensing galaxies, however, then no large population of intrinsically red quasars exists. These objects, along with PKS 1830-211, have been discovered because they are Jy radio sources. If they are red because of intervening material along the line of sight, then a substantial population of radio-quiet, red, gravitationally lensed systems remains undiscovered, perhaps in numbers 5-10 times as great as the radio-loud objects. Their actual numbers are critical to the interpretation of the statistics of lensed quasars, bearing on fundamental issues of cosmology and the masses and evolution of intervening galaxies.
Quasar surveys utilizing 2MASS and other IR catalogs will eventually build the statistics of the red quasar population, allowing these issues to be addressed definitively. It will be necessary to carry out much of the exploratory spectroscopy at infrared wavelengths to accurately gauge the numbers of the most extreme objects.
References
- (1)
- (2) Annis, J. & Luppino, G., A. 1993, ApJL, 407, L69
- (3)
- (4) Antonucci R., 1993, ARA&A, 31, 473
- (5)
- (6) Baker J.C., Hunstead R.W., 1995, ApJ, 452, L95
- (7)
- (8) Barger, A. J., Cowie, L. L., Mushotzky, R. F., & Richards, E. A. 2001, AJ, 121, 662
- (9)
- (10) Bartelmann, M. & Loeb, A. 1998, ApJ, 503, 48
- (11)
- (12) Becker, R. H., White, R. L., & Helfand, D. J. 1995, ApJ, 450, 559
- (13)
- (14) Becker, R. H., White, R. L., Gregg, M. D., Brotherton, M. S., Laurent-Muehleisen, S. A., & Arav, N. 2000, ApJ, 538, 72
- (15)
- (16) Becker, R. H., Gregg, M. D., Hook, I. M., McMahon, R. G., White, R. L., & Helfand, D. J. 1997, ApJL, 479, L93
- (17)
- (18) Benn, C. R., et al. 1998, MNRAS, 295, 451
- (19)
- (20) Bolton, J. G., Shimmins, A. J., & Wall, J. V. 1975, Australian J. Phys. Ap. Suppl., Vol. 34, 1
- (21)
- (22) Brotherton, M. S., van Breugel, W., Smith, R. J., Boyle, B. J., Shanks, T., Croom, S. M., Miller, L. & Becker, R. H. 1998, ApJL, 505, L7
- (23)
- (24) Brotherton M.S., Wills B.J., Dey A., van Breugel W., Antonucci R., 1998, ApJ, 501, 110
- (25)
- (26) Brotherton, M. S., Tran, H. D., Becker, R. H., Gregg, M. D., Laurent-Muehleisen, S. A., & White, R. L. 2001, ApJ, 546, 775
- (27)
- (28) Calzetti, D., Kinney, A. L., Storchi-Bergmann, T. 1994, ApJ, 429, 582
- (29)
- (30) Courbin, F., Lidman, C., Frye, B. L., Magain, P., Broadhurst, T. J., Pahre, M. A., & Djorgovski, S. G. 1998, ApJL, 499, L119
- (31)
- (32) de Vries W.H., O’Dea C.P., Perlman E., Baum S.A., Lehnert M.D., Stocke J., Rector T., Elston R., 1998, ApJ, 503, 138
- (33)
- (34) Economou F., Lawrence A., Ward M.J., Blanco P.R., 1995, MNRAS, 272, L5
- (35)
- (36) Falco, E. E., et al. 1999, ApJ, 523, 617
- (37)
- (38) Francis, P., Whiting, M., & Webster, R. 2000, PASA, 53, 56
- (39)
- (40) Frye, B., Welch, W. J., & Broadhurst, T. 1997, ApJL, 478, L25
- (41)
- (42) Hall, P. B., Martini, P., DePoy, D. L., & Gatley, I. 1997, ApJL, 484, L17
- (43)
- (44) Hewitt, J. N., Turner, E. L., Lawrence, C. R., Schneider, D. P., Brody, J. P. 1992, AJ, 104, 968
- (45)
- (46) Jauncey, D. L. et al. 1991, Nature, 352, 132
- (47)
- (48) Kleinmann, S.G., Lysaght, M.G., Pughe, W.L., Schneider, S.E., Skrutskie, M.F., Weinberg, M.D., Price, S.D., Matthews, K., Soifer, B.T., & Huchra, J.P. 1994, ApJS, 217, 11
- (49)
- (50) Kochanek, C. S., et al. 2000, ApJ, 535, 692
- (51)
- (52) Laing R.A., Riley J.M., Longair M.S., 1983, 204, 151
- (53)
- (54) Lawrence, C. R., Elston, R., Januzzi, B. T., & Turner, E. L. 1995a, AJ, 110, 2570
- (55)
- (56) Lawrence, C.R., Cohen, J. G., & Oke, J. B. 1995b, AJ, 110, 2583
- (57)
- (58) Low, F.J., Cutri, R.M., Kleinman, S.G., & Huchra, J.P. 1989, ApJL, 340, 1
- (59)
- (60) Malhotra, S., Rhoads, J.E., & Turner, E.L. 1997, MNRAS, 288, 138
- (61)
- (62) Matthews, K., & Soifer, B. T. 1994, in Infrared Astronomy with Arrays: the Next Generation, ed. I. McLean (Dordrecht: Kluwer), 239
- (63)
- (64) McMahon, R.G., & Irwin, M.J. 1992, in Digitized Optical Sky Surveys, eds. H.T. MacGillivray and E.B. Thomson, Kluwer, p. 417
- (65)
- (66) Menton, 1999
- (67)
- (68) Moore C.B., Carilli C.L., Menten K.M., 1998, ApJ, 510, L87
- (69)
- (70) Norman C., et al. 2001, ApJ, submitted (astro-ph/0103198)
- (71)
- (72) O’Dea, C. P., Baum, S. A., & Stanghellini, C. 1991, ApJ, 380, 660
- (73)
- (74) O’Dea, C. P., Worrall, D. M., Baum, S. A., & Stanghellini, C. 1996, AJ, 111, 92
- (75)
- (76) O’Dea, C. P. 1998, PASP, 110, 493
- (77)
- (78) Oke, J. B., Cohen, J. G., Carr, M., Cromer, J., Dingizan, A., Harris, F. H., Labrecque S., Lucinio, R., Schaal, W., Epps, H., & Miller, J. 1995, PASP, 107, 375
- (79)
- (80) Patnaik, A. & Narasimha, D. 1992, Bull. Astr. Soc. India, 21, 457
- (81)
- (82) Pei, Y. C. 1992, ApJ, 395, 130
- (83)
- (84) Phillips, P. M., et al. 2000, astro-ph/0009334
- (85)
- (86) Rawlings S., Lacy M., Eales S. A., Sivia D. S., 1995, MNRAS, 274, 428
- (87)
- (88) Risaliti G., Marconi A., Maiolino R., Salvati M., Severgnini P., 2001, A&A, in press
- (89)
- (90) Schlegel, D.J, Finkbeiner, D.P., & Davis, M. 1998, ApJ, 500, 525
- (91)
- (92) Shepherd, M.C. 1997, in ASP Conf. Ser. 125, Astronomical Data Analysis Software and Systems VI, eds. G. Hunt, H. E. Payne, 77).
- (93)
- (94) Simpson C., Rawlings S., Lacy M., 1999, MNRAS, 306, 828
- (95)
- (96) Smith H.E., Spinrad H., 1980, ApJ, 236, 419
- (97)
- (98) Sprayberry, D., & Foltz, C. B. 1992, ApJ, 390, 39
- (99)
- (100) Stockton A., Ridgway S. E., 2001, ApJ, in press (astro-ph/0102293)
- (101)
- (102) Tonry J. L. & Kochanek C. S., 1999, AJ, 117, 203
- (103)
- (104) Veron-Cetty, M. P. & Veron, P. 1983, A&AS, 53, 219
- (105)
- (106) Webster, R.L., Francis, P.J., Peterson, B.A., Drinkwater, M.J., & Masci, F.J. 1995, Nature, 375, 469
- (107)
- (108) White, R. L., Becker, R. H., Helfand, D. J., & Gregg, M. D. 1997, ApJ, 475, 479
- (109)
- (110) White, R.L., et al. 2000, ApJS, 126, 133
- (111)
- (112) Whiting, M., Webster, R., & Francis, P. 2001, astro-ph/0101502
- (113)
- (114) Willott C.J., Rawlings S., Blundell K.M., Lacy M., 2000, MNRAS, 316, 449
- (115)
- (116) Winn, J. et al. 2000b, AJ, 120, 2868
- (117)
- (118) Winn, J. et al. 2001a, ApJ, 000, 000
- (119)
- (120) Winn, J. et al. 2001b, astro-ph/0104092
- (121)
- (122) Winn, J. et al. 2001c, AJ, 121, 1223
- (123)
| Name | (J2000) | Gal. | (mJy) | |||||||||
|---|---|---|---|---|---|---|---|---|---|---|---|---|
| FIRST 01340931 | 0.10 | 2.216 | 22.57 | 20.61 | 18.77 | 16.17 | 14.75 | 13.55 | 900. | |||
| FIRST 07382750 | +27°50′46 | 0.14 | 1.985 | 23.8 | 22.1 | 20.6 | 19.2 | 17.1 | 16.2 | 15.3 | 2.6 | |
| MG 04140534 | 0.10 | 2.639 | 24.1 | 23.8 | 21.8 | 19.5 | 15.7 | 14.2 | 13.7 | |||
| PKS 18302111 | 1.54 | 2.507 | — | — | — | 21.4 | 18.7 | — | 15.0 |
Note. — Optical photometry for J0134-0931 from Winn et al. 2001, for J0738+2750 from our flux calibrated spectrum, for MG 0414+0534 from Lawrence et al. (1995a).
IR photometry from 2MASS, Lawrence et al. (1995a), or Courbin et al. 1998.
Radio flux density from FIRST survey or NED.
![[Uncaptioned image]](/html/astro-ph/0107441/assets/x1.png)
Fig. 1.– Flux-calibrated Keck LRIS spectrum of J0738+2750 showing the
very red continuum. The Mg II 2800 and C IV 1549 regions have
narrow line absorption at the emission line redshift and the Mg II absorption is triple with a velocity dispersion of .
Fe II absorption corresponding to each of these is also present, as
is a broad Mg II absorption feature extending from to
in the quasar restframe.
There is also an
intervening absorber contributing narrow Mg II and Fe II lines at (in italics). The polarization data, also from Keck LRIS,
show an increase from 4% to more than 9% between Mg II and C IV,
supporting the interpretation that the unusual spectral energy
distribution is due to reddening by dust. The polarization error bars
show errors; wavelength error bars indicate the binning used
to measure the polarization signal.