PMN J0134–0931: A gravitationally lensed quasar
with an unusual radio
morphology
Abstract
The radio-loud quasar J0134–0931 was discovered to have an unusual morphology during our search for gravitational lenses. In VLA and MERLIN images, there are 5 compact components with maximum separation 681 mas. All of these components have the same spectral index from 5 GHz to 43 GHz. In a VLBA image at 1.7 GHz, a curved arc of extended emission joins two of the components in a manner suggestive of gravitational lensing. At least two of the radio components have near-infrared counterparts. We argue that this evidence implies that J0134–0931 is a gravitational lens, although we have not been able to devise a plausible model for the foreground gravitational potential. Like several other radio-loud lenses, the background source has an extraordinarily red optical counterpart.
1 Introduction
Gravitationally lensed quasars are rare and valuable astrophysical tools. They can be used to determine the Hubble constant (Refsdal 1964) and place limits on the cosmological constant (Turner, 1990; Fukugita, Futamase & Kasai, 1990). The image configuration reveals properties of the matter distribution of the foreground galaxy, including dark matter, and in some cases gravitational magnification reveals interesting details that would otherwise be too faint to observe (for reviews see, e.g., Blandford & Narayan 1992; Wambsganss 1998; Narayan & Bartelmann 1999).
Lenses are usually recognized as such by an unusual morphology in a high-resolution () image. A quasar that exhibits two or more components in an optical or infrared image is an excellent lens candidate. Likewise, a radio source with more than one compact flat-spectrum component, or a radio lobe with a ringlike or arclike morphology, is likely to be the result of gravitational lensing.
Such candidates are usually followed up with imaging at multiple wavelengths and/or higher resolution, and with optical spectroscopy. The goals are to determine whether the components have identical spectra and surface brightness, as would be the case for lensed images, and to search for evidence of foreground objects that are responsible for the gravitational deflection.
This strategy has been employed by many lens surveys, including our own, which is a radio-based survey of the region . We used the VLA111The Very Large Array (VLA) and Very Long Baseline Array (VLBA) are operated by the National Radio Astronomy Observatory (NRAO), a facility of the National Science Foundation (NSF) operated under cooperative agreement by Associated Universities, Inc. to search for characteristic lensing morphologies in a sample of approximately 4000 radio sources, chosen to be flat-spectrum between the 4.85 GHz PMN catalog (Griffith & Wright, 1993) and the 1.4 GHz NVSS catalog (Condon et al., 1998). This paper reports the discovery of PMN J0134–0931, the fourth object in our survey that we believe is gravitationally lensed; the others are J1838–3427 (Winn et al., 2000), J2004–1349 (Winn et al., 2001a), and J1632–0033 (Winn et al., 2001b).
Independently, J0134–0931 was identified by Gregg et al. (2001) during a search for highly reddened quasars. In a companion paper, they present optical and near-infrared spectra exhibiting quasar emission lines at , and a -band image revealing at least two components. These authors also argue that the quasar is being gravitationally magnified, and examine the possible implications of the extreme redness of J0134–0931.
The next section describes the radio properties of J0134–0931. Section 3 describes the near-infrared and optical properties. Section 4 argues the case for gravitational lensing based on this evidence and points out complications of the lensing hypothesis. Section 5 contains a summary and suggests future observations to test the lensing hypothesis and constrain lens models.
2 Radio properties
2.1 VLA, MERLIN, and ATCA observations
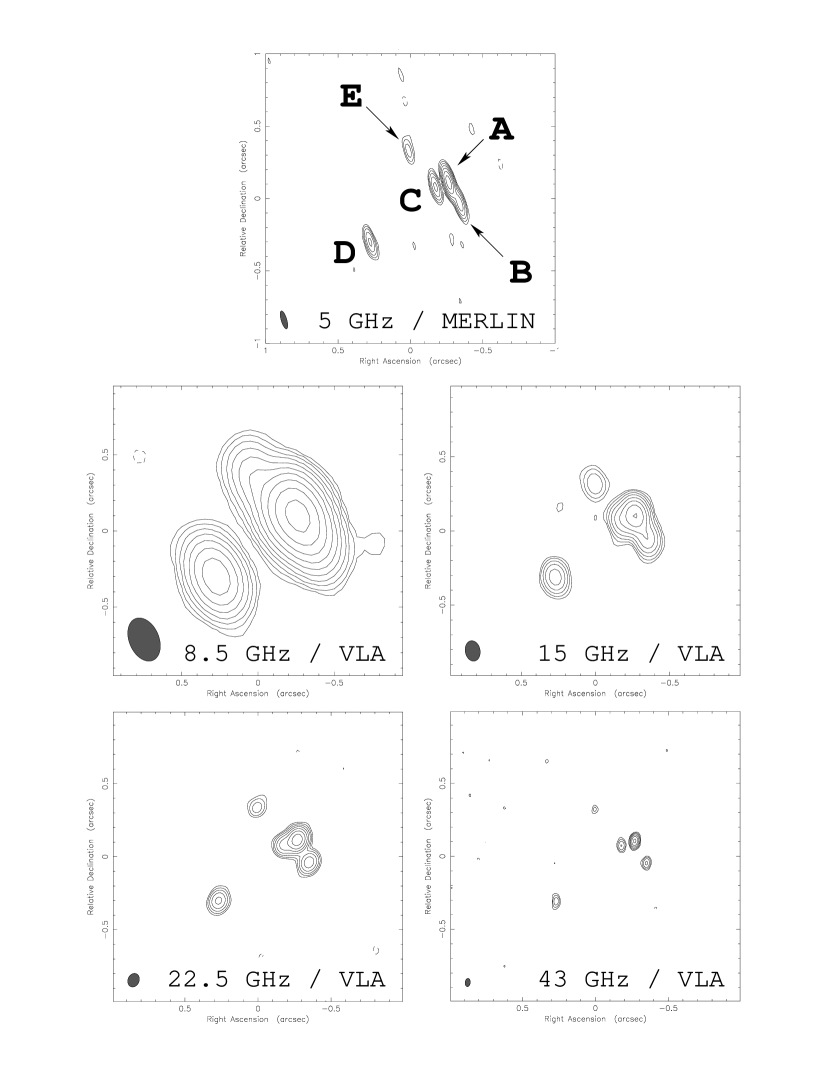
We selected J0134–0931 as a lens candidate because of its unusual radio morphology. Table 1 provides a summary of our radio observations, and also lists the coordinates of J0134–0931. Figure 1 presents radio images with the VLA and MERLIN222 The Multi-Element Radio Linked Interferometry Network (MERLIN) is a UK national facility operated by the University of Manchester on behalf of SERC., at frequencies ranging from 5 GHz to 43 GHz. The details of calibration and data reduction were as follows:
For the VLA and MERLIN observations, we interleaved observations of J0134–0931 with the nearby source J0141–0928 in order to calibrate the antenna gains. To calibrate the absolute flux density scale for the MERLIN data, we observed 3C286 and assumed a flux density of 7.38 Jy on the shortest baseline. For the VLA observations in October 2000, we observed J2355+4950 instead; this secondary flux calibrator is monitored monthly by G. Taylor and S. Myers of NRAO, and has been found to have a stable flux density. We assumed the flux densities of this source (in Janskys) were 0.921, 0.602, 0.473, and 0.284 at 8.5 GHz, 15 GHz, 22.5 GHz and 43 GHz, respectively. Calibration was performed using standard procedures within the software package AIPS. We applied gain-elevation corrections for data at 15 GHz and higher frequencies, based on gain curves prepared by S. Myers.
Imaging was performed with the software package Difmap (Shepherd, 1997). Five radio components were apparent in each image, except the 8.5 GHz image, in which four of the components were blended together. In Figure 1 these components are labelled A–E, in decreasing order of flux density. This order is the same in all five images; indeed, the visual appearance of the images suggest that all the components of J0134–0931 have approximately the same radio “color.”
To investigate this point quantitatively, we fit a model consisting of 5 point components to the visibility function of each data set. We used this model to perform phase-only self-calibration with a solution interval of 30 seconds. This process, model-fitting and self-calibration, was repeated (typically 5–10 times) until the model converged. In all cases, the relative separations of the 5 components (printed in Table 2) agreed within 2 mas.
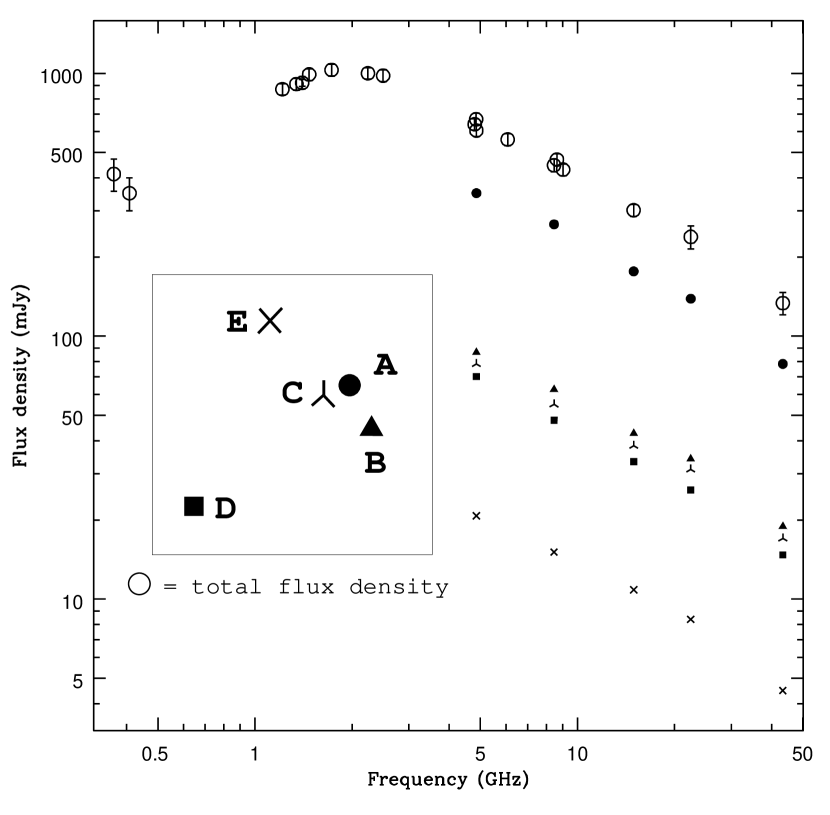
The flux density of each component as a function of radio frequency is plotted in Figure 2. We computed the best-fit power law for each component. They are all consistent with between 5 GHz and 43 GHz. Evidently, the radio continuum spectra of all five components have the same slope. This comparison can be made more precise by comparing the flux density ratios between components at each frequency, because these ratios are not affected by the uncertainty in the absolute flux scales. The ratios relative to component D are printed in Table 2. The differences between the ratios measured at different frequencies are less than 4%.
Also plotted in Figure 2 is the total flux density of J0134–0931 over a wider frequency range. The data were drawn from the literature, our VLA and MERLIN measurements described earlier, and our ATCA333The Australia Telescope Compact Array (ATCA) is part of the Australia Telescope which is funded by the Commonwealth of Australia for operation as a National Facility managed by CSIRO. measurements of 2000 September 25. The ATCA measurements were performed when the array was in the 6D configuration, and used PKS B1934–638 to set the flux density scale. The total flux density measurements reveal that J0134–0931 is a gigahertz-peaked-spectrum (GPS) source with a peak at 2 GHz. The morphology of J0134–0931 is unusual for a GPS quasar, or indeed for any radio source. Although morphologies of GPS quasars are diverse, they are predominantly compact sources, core-jet sources, or linear triples with an angular extent of 10–100 milliarcseconds (see, e.g., O’Dea, 1998; Stanghellini et al., 1997).
Two other characteristics of typical GPS sources are a low level of centimeter-wavelength polarization, and low or non-existent variability of total flux density. The lack of a polarized signal in the MERLIN observations implies that the fractional polarization of the brightest component of J0134–0931 is less than 3%. (The VLA observations were not calibrated for polarization.) The agreement of many measurements of the total flux density spanning almost 20 years, as shown in Figure 2, suggests that J0134–0931 is not significantly variable.
To summarize the main conclusions that we have drawn from the VLA and MERLIN data: (1) J0134–0931 is a GPS radio source. (2) It consists of 5 compact components in an unusual triangular arrangement with maximum separation 681 mas. (3) The spectral indices of the components are the same from 5 GHz to 43 GHz.
2.2 VLBA observations
We observed J0134–0931 with the VLBA on two separate occasions. On 24 April 2000, we observed for one hour at 5 GHz, using 8 antennas (the Mauna Kea and Hancock antennas were unavailable). On 31 October 2000, we observed for four hours at 1.7 GHz with all 10 antennas. The key parameters of these observations are printed in Table 1. In both cases, the total observing bandwidth of 64 MHz was divided into 8 intermediate frequency bands of width 8 MHz, each of which was subdivided into 16 channels of width 500 kHz. The sampling time was 1 second.
Calibration was performed with standard AIPS procedures. We solved for phase delays and rates using a fringe-fit interval of 2 minutes. After fringe fitting, we averaged the data into frequency bins of width 2 MHz, and time bins of width 6 seconds. These values were chosen to reduce the data volume as much as possible while keeping the amount of bandwidth smearing and time-average smearing below over the required field of view.
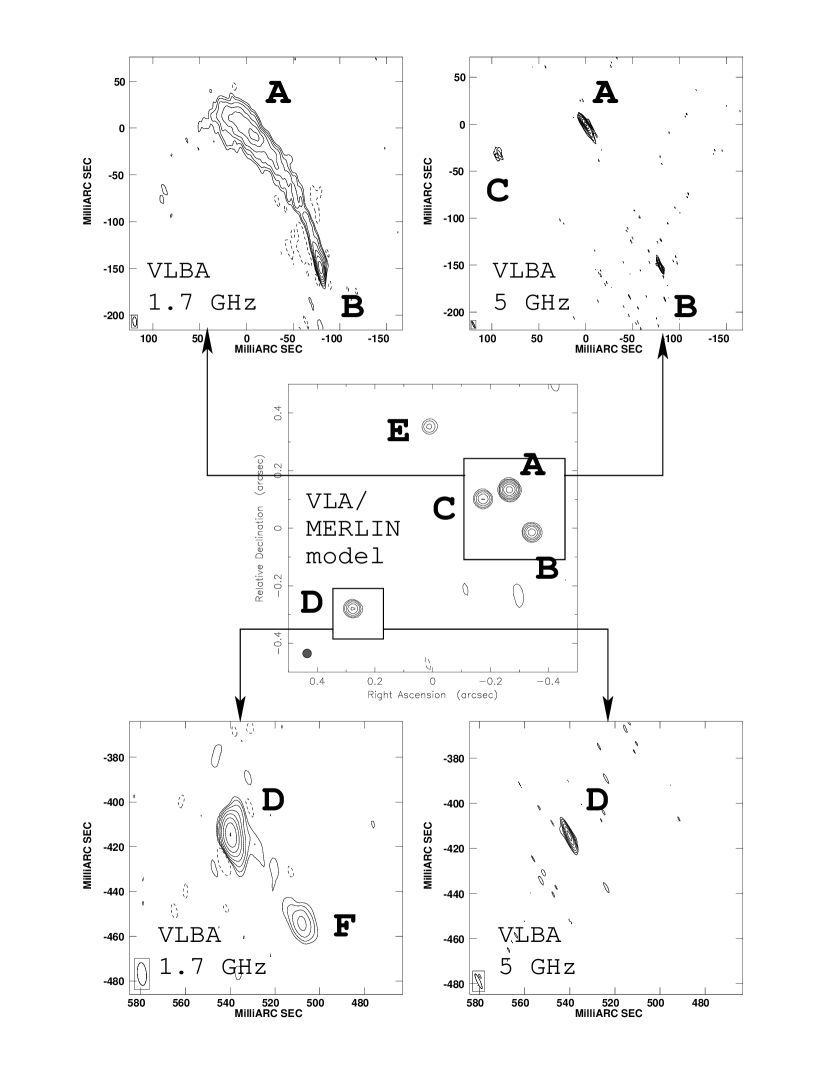
For imaging, we employed standard AIPS procedures. The process of “cleaning” (deconvolution) and phase-only self-calibration (with a 30-second solution interval) was iterated 3 times. Figure 3 presents the final images, using uniform weighting. The central panel is not an image; it is merely an illustration of the 5-component model developed from the VLA and MERLIN data, to provide a wide-field overview of the system.
We first discuss the 5 GHz data. The four components A–D were detected. Components B and D are nearly unresolved, whereas component A is highly elongated. Component C is barely visible in the image, and has a larger angular size (and lower surface brightness) than the other components. Table 3 lists the parameters of a simple model consisting of 4 elliptical Gaussian components that fits the data fairly well. In this model, component A was represented by 2 elliptical Gaussians. Component E is absent from the image, although it does appear (faintly) when the data are re-weighted so as to emphasize the shortest baselines.
In general, radio structure that is smooth on an angular scale greater 25–30 beamwidths is “resolved out” and will be invisible in VLBA images. In order to gauge whether any of the components are significantly resolved out, we divided the total 5 GHz flux of each component as measured by the VLBA by its 5 GHz flux as measured by MERLIN. The results are 1.00, 0.88, 0.50 and 0.95 for components A–D respectively, confirming that C is largely resolved out. The non-detection of E implies that its angular size must be larger than about 35 mas. Because E was unresolved in the 5 GHz MERLIN image, the angular size cannot be much larger than 80 mas.
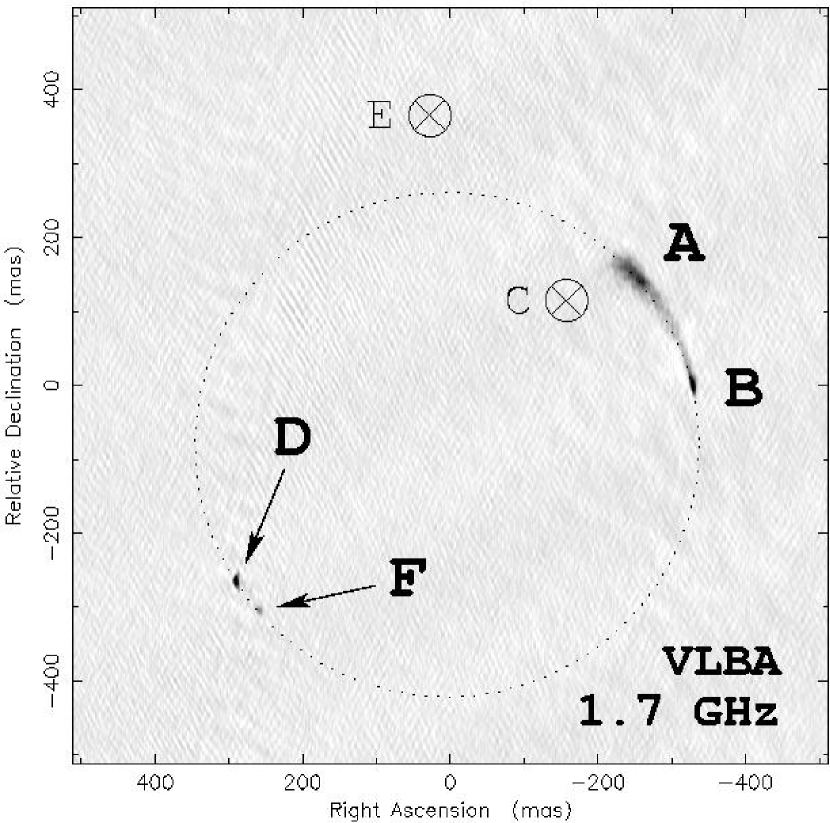
We next discuss the 1.7 GHz image. Figure 3 contains radio contour plots, and Figure 4 is a wide-field grayscale image. Components B and D are compact, but C and E are completely absent. Component A is very extended and is connected to B by a curved arc of emission. Furthermore, a dim sixth component is evident to the southwest of D, labelled F in Figures 3 and 4.
In Figure 4, a dotted circle has been drawn through components A, B, D and F. This illustrates that all 4 components lie on the same circle, and also that the arc joining A and B lies on the circle. Both of these properties are strongly suggestive of gravitational lensing (see § 4.1).
Table 4 lists the parameters of a simple model consisting of 4 elliptical Gaussian components. This model provides a decent fit to the image, but does not account for most of the flux in the arc. The total flux density of the model is 0.634 Jy, which is 91% of the total flux density in the image (0.696 Jy). Components D and F are elongated towards one another. It is possible that D and F are connected by an arc, as are components A and B, but that the arc is too dim to be evident.
Judging from the total flux densities plotted in Figure 2, the total flux density of J0134–0931 at this frequency is about 1.0 Jy. The 0.3 Jy that is missing from the 1.7 GHz VLBA image is mainly due to the absence of components C and E. These two components would be expected to contribute about 0.2 Jy at 1.7 GHz, by extrapolating their flux densities measured at higher frequencies. For these components to be resolved out by the VLBA, their angular sizes must be about 120 mas or larger.
3 Optical and infrared properties
3.1 Near-infrared counterparts
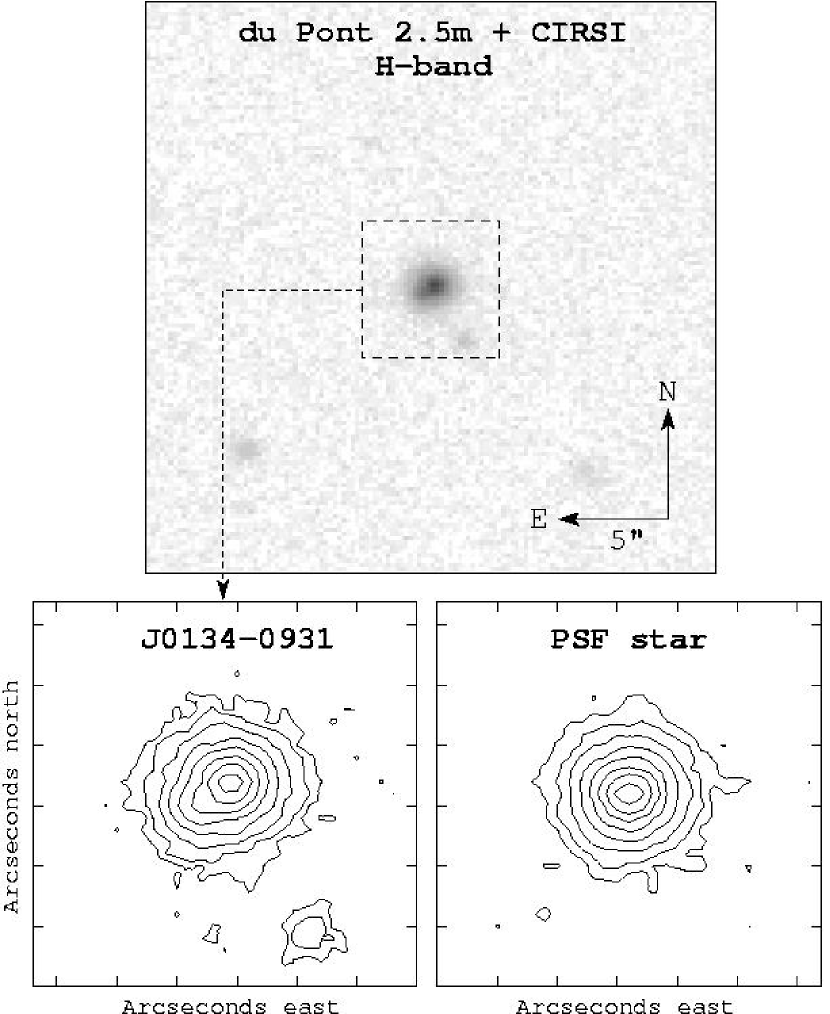
We obtained an -band image of J0134–0931 on 2000 October 13 at Las Campanas Observatory, using the Cambridge Infra-Red Survey Instrument (CIRSI) camera mounted on the Cassegrain focus of the du Pont 2.5-meter telescope. Four exposures of 30 seconds were taken at each of 5 dither positions, making for a total integration time of 10 minutes in the final stacked image. The pixel scale is and the resolution in the stacked image is . A subraster of the stacked image is shown in Figure 5, along with a contour representation.
The -band counterpart is obviously elongated. There is also a dim object to the southwest, which is radio-silent in all our radio images. We used the DAOPHOT routines in the software package IRAF444 IRAF is distributed by the National Optical Astronomy Observatories, which are operated by the Association of Universities for Research in Astronomy, Inc., under cooperative agreement with the National Science Foundation. to construct an empirical PSF of diameter using a star east and south of J0134–0931. A contour representation is displayed in the lower right panel of Figure 5. We used this empirical PSF to find the best-fit positions and fluxes of a model with three components (two for J0134–0931 and one for the dim object to the southwest).
In this model, the double representing J0134–0931 had separation mas, position angle , and flux ratio . The corresponding radio values for components A and D are mas, and . The other pairings of radio components that agree with the -band separation are A/F, C/D, and C/F, but in those cases the radio flux ratios do not match the -band flux ratio at all.
The simplest conclusion is that A and D, at least, have near-IR counterparts. It is possible that components B and C also have near-IR counterparts that are merged with A in our image. Indeed, Gregg et al. (2001) present an analysis of a -band image of J0134–0931 that supports this interpretation. After performing a maximum-entropy deconvolution, these authors conclude that components A, B and D (at least) have -band counterparts.
If J0134–0931 is indeed gravitationally lensed, it is also possible that the foreground galaxy contributes significantly to the total light. These possibilities would complicate the interpretation of the near-infrared images. For the purpose of evaluating possible lensing scenarios, it will be important to obtain higher-resolution optical or near-infrared images, using adaptive optics or the Hubble Space Telescope.
3.2 Optical counterpart
On 2000 July 26, we obtained images of J0134–0931 with the Mosaic II CCD camera at the prime focus of the Blanco 4-meter telescope at CTIO555The Cerro Tololo Inter-American Observatory (CTIO) is operated by the Association of Universities for Research in Astronomy Inc., under a cooperative agreement with the NSF as part of the National Optical Astronomy Observatories.. Each exposure lasted 10 minutes. The seeing varied from to . The images were processed with standard IRAF routines, and the -band image was defringed using a template kindly provided by R.C. Dohm-Palmer. An empirical PSF of diameter was constructed for each image and used to compute magnitudes for J0134–0931. In the -, - and -band images the optical counterpart was detected but unresolved. In the -band image, the counterpart was not detected.
For photometric calibration we measured the flux of star #361 from the SA110 field described by Landolt (1992), within an aperture of diameter . We adopted “typical” CTIO extinction coefficients of , , , and (Landolt, 1992). Table 5 lists the optical and near-infrared total magnitudes of J0134–0931 in 7 filters from to , using the observations described in this section and entries from the 2MASS catalog666The Two Micron All Sky Survey (2MASS) is a joint project of the University of Massachusetts and the Infrared Processing and Analysis Center/California Institute of Technology, funded by the National Aeronautics and Space Administration and the National Science Foundation (NSF).. Evidently J0134–0931 is very red, with . This is confirmed by the spectrophotometry of Gregg et al. (2001), who find .
4 The gravitational lensing hypothesis
4.1 The case for lensing
The case that J0134–0931 is gravitationally lensed relies mainly on its near-infrared and radio morphology. Given the spectra of Gregg et al. (2001), which reveal the source to be a quasar, the observation that the -band counterpart is double (§3.1) is by itself powerful evidence for lensing. At optical and near-infrared wavelengths, quasars are almost always observed as unresolved points. Quasars that appear double (with separation ) are either (1) the result of a chance superposition between a quasar and a star, (2) a chance superposition of quasars at different redshifts, (3) a binary quasar, or (4) a gravitational lens.
The first possibility is ruled out by the observation that both components are radio-loud. The second and third hypotheses are a priori unlikely because radio-loud quasars constitute a minority () of quasars generally. The observation that components A–E all have the same continuum radio spectrum from 5 GHz to 43 GHz makes the chance superposition hypotheses untenable, and casts serious doubt on the binary quasar hypothesis. By contrast, the identity of spectral indices is a natural consequence of gravitational lensing. The maximum component separation of 681 mas is also in the range of angular sizes that is characteristic of gravitational lensing by galaxies (). This angular scale is set by the Einstein ring radius of medium-redshift galaxies.
Furthermore, the milliarcsecond morphology of J0134–0931 is unusual for a GPS quasar, or indeed for any radio source. GPS sources are almost always a single core, a compact double, a linear triple, or a core-jet structure (O’Dea, 1998). Examples of VLBI observations of GPS sources are given by Snellen, Schilizzi & van Langevelde (2000). The total angular extent is usually less than 100 mas. By contrast, the five components of J0134–0931 have a much larger separation and are not collinear, which prevents any obvious assignment of the components as cores, lobes and jets.
The curved arc between components A and B in the 1.7 GHz VLBA image (§ 2.2) is particularly suggestive, because the arc is nearly perpendicular to the line from A to D. The magnification due to gravitational lensing often results in lensed images that are stretched tangentially, i.e., stretched along the circular or elliptical critical curve that runs approximately through the images. Some examples are B0218+357 (Patnaik et al., 1995), B1422+231 (Patnaik et al., 1999), MG 0414+0534 (Trotter, Winn & Hewitt, 2000), and B2016+112 (Garrett et al., 1997).
In addition, the line joining D and F is nearly perpendicular to the line joining A and D, suggesting that D and F may also be an example of tangential stretching. As pointed out in § 2.2, it is possible that D and F are connected by an arc. In fact, if the A/B arc is extrapolated into a full circle (to approximate a critical curve), the circle intersects both D and F, as shown in Figure 4.
Finally, Gregg et al. (2001) present an additional piece of circumstantial evidence that J0134–0931 is being gravitationally lensed: based on its observed redshift and -band magnitude, the object would be among the most intriniscally luminous quasars known. This high apparent luminosity is consistent with gravitational magnification.
4.2 Problems with gravitational lens models
An important step in the analysis of newly-discovered gravitational lens systems is to devise a plausible model of the gravitational potential of the foreground galaxy, and of the background source structure, that can account for the observed image configuration. The most common configurations by far are those with 2 and 4 lensed images, which can often be modeled by an isothermal elliptical potential that is lensing a single background source. However, the radio morphology of J0134–0931, with at least 6 components, cannot be produced by such simple models, and we have not been able to devise a completely satisfactory alternative model. In this section, we describe some possible lensing scenarios, and the unsatisfactory aspects of each one.
Is it possible that J0134–0931 is a simple 2- or 4-image gravitational lens, and that some of the additional radio components are actually due to the foreground object(s) rather than the background source? Any such scenario is unsatisfactory because A–E have the same spectral index (§ 2.1), suggesting they are all related. Furthermore, even if the lens galaxy is assumed to be centered on one of the radio components, or between any two of them, the remaining radio components are not arranged in a typical lensing configuration.
Could all the radio components be images of a single background source? This is unsatisfactory because lensing conserves surface brightness, whereas two of the components (C and E) apparently have a lower surface brightness than the other components (§ 2.2). One would have to invoke a propagation effect that acts differently along the various image paths. For example, interstellar scattering (by plasma that is either in a foreground galaxy or our own Galaxy) might be causing differential scatter-broadening of the images. In this scenario, the comparatively large angular sizes of C and E, which caused them to be largely resolved out of our VLBA images, is due to a larger column density of electrons along those image paths. This hypothesis is testable, because the angular sizes of the components would be expected to vary as , where is the observing wavelength. Multifrequency VLBI observations that include some short baselines () would be helpful.
The other problem with identifying all 6 components as images of a single background source is that the image configuration cannot be produced with simple lens models consisting of a single galaxy. Nor have we been able to produce the image configuration with models consisting of more than one lens galaxy, although the phase space of parameters in such models is too large to explore comprehensively without at least some prior constraints (e.g., the galaxy positions).
We are therefore led to consider models in which the background source has more than one radio component. GPS quasars commonly have more than one radio component, so this scenario is reasonable. Because the near-infrared counterpart is double, it is tempting to try models in which each background source is doubly imaged. From the 1.7 GHz image alone (Figure 3), such a model appears plausible. In one scenario, the background source consists of a core and a jet with a hot spot at its end. In one image, the core is B and the hot spot is A; in the other, parity-reversed image, the core is D and the hot spot is F.
A lens model consisting of a singular isothermal sphere can reproduce the positions of A, B, D and F almost exactly. However, the predicted magnification ratios in this model are not even close to the observed flux ratios; the problem is that A is much brighter than F, whereas B and D are of comparable brightness. Any lens model of this type would need to produce a very large magnification gradient between the source locations corresponding to A/F and B/D, which is possible for a source almost perfectly aligned with the foreground galaxy. The main problem with this scenario is that it ignores components C and E.
This situation, compelling evidence for gravitational lensing but inability to model the system adequately, is frustrating but not unique. For example, the correct model for the well-established three-image lens B2016+112 (Lawrence et al., 1984) has been a mystery for over 15 years and seems to involve two lens galaxies at different redshifts (Nair & Garrett, 1997). The lensing scenario for the six-image system B1359+154 became clear only after an image with the Hubble Space Telescope revealed that the foreground mass was actually a compact group of 3 galaxies (Rusin et al., 2001).
5 Summary and discussion
We have presented an extensive set of radio, near-IR and optical observations of the GPS quasar J0134–0931. The radio morphology is unusual, with at least 5 components sharing the same radio continuum spectrum between 5 GHz and 43 GHz. At least two of the components have -band counterparts, strongly suggesting they are lensed images of a single source. A curved arc of radio emission between two of the components appears to be an example of the tangential stretching that is characteristic of gravitational lensing.
Neither the lensing correspondences between the components nor the foreground mass distribution is clear from the present data. We suggest three lines of observational inquiry to obtain this information:
1. Multi-frequency high-resolution radio imaging. Images at many frequencies will allow the angular sizes of components C and E to be measured as a function of wavelength, in order to see if they scale as characteristic of scatter broadening. Images at higher frequencies will further resolve components A, B and possibly D; the detailed morphology may be valuable in devising lens models. Finally, sensitive images at multiple frequencies will allow the spectral index of the dim component F to be compared to the other components.
2. Higher-resolution optical/near-IR imaging. This will establish exactly which radio components have optical counterparts, and will test for the presence of a foreground galaxy or galaxies. Finally, it may establish the nature of the dim component southwest of J0134–0931 that was detected in our near-IR image (Fig. 5).
3. Optical/near-IR spectroscopy of the individual components. Separate spectra of components A and D should verify they are both quasars at the same redshift. Deep spectra may also reveal the presence of foreground absorbing material, and provide its redshift.
Separating the various components at optical wavelengths will probably require the Hubble Space Telescope. Adaptive-optics imaging is a more challenging prospect because there are no particularly bright stars within to serve as a guide star.
Finally, we note that the optical counterpart of J0134–0931 is extremely red, with . This places J0134–0931 among the recently recognized population of red quasars that appear in radio surveys but have been missed in optical surveys (see, e.g., Francis, Whiting & Webster, 2000). Several other gravitationally lensed radio sources are also extremely red (e.g., MG 0414+0534, MG J1131+0456, JVAS B1938+666). Gregg et al. (2001), Kochanek et al. (2000), Webster et al. (1995) and Becker et al. (1997), among others, have argued that these quasars are red due to mechanisms intrinsic to the quasar or host galaxy rather than reddening due to foreground objects along the line of sight, and are connected to a large population of optically obscured AGN.
References
- Becker, White & Helfand (1995) Becker, Robert H., White, Richard L., & Helfand, David J. 1995, ApJ, 450, 559
- Becker et al. (1997) Becker, Robert H., Gregg, Michael D., Hook, Isobel M., McMahon, Richard G., White, Richard L., & Helfand, David J. 1997, ApJ, 479, 93
- Blandford & Narayan (1992) Blandford, R. D.; Narayan, R. 1992, ARA&A, 30, 311
- Condon et al. (1998) Condon, J. J.; Cotton, W. D.; Greisen, E. W.; Yin, Q. F.; Perley, R. A.; Taylor, G. B.; Broderick, J. J. 1998, AJ, 115, 1693
- Douglas et al. (1996) Douglas, James N.; Bash, Frank N.; Bozyan, F. Arakel; Torrence, Geoffrey W.; Wolfe, Chip 1996, AJ, 111, 1945
- Francis, Whiting & Webster (2000) Francis, P.J., Whiting, M.T., & Webster, R.L. 2000, PASP, 53, 56
- Fukugita, Futamase & Kasai (1990) Fukugita, M., Futamase, T., & Kasai, M. 1990, MNRAS, 246, 24
- Garrett et al. (1997) Garrett, M.A.; Porcas, R.W.; Nair, S.; Patnaik, A.R. 1997, MNRAS, 279, L7
- Gregg et al. (2001) Gregg, M. et al. 2001, this volume
- Griffith & Wright (1993) Griffith, M.R. & Wright, A.E. 1993, AJ, 105, 1666
- Griffith et al. (1994) Griffith, Mark R., Wright, Alan E., Burke, B.F., & Ekers, R.D. 1994, ApJS, 90, 179
- Kochanek et al. (2000) Kochanek, C.S., Falco, E.E., Impey, C.D., Lehár, J., McLeod, B.A., Rix, H.-W., Keeton, C.R., Muñoz, J.A., & Peng, C.Y. 2000, ApJ, 535, 6921
- Landolt (1992) Landolt, A.U. 1992, AJ, 104, 340
- Lawrence et al. (1984) Lawrence, C.R., Schneider, D.P.; Schmidet, M., Bennett, C.L., Hewitt, J.N., Burke, B.F., Turner, E.L., & Gunn, J.E. 1984, Science, 223, 4631
- Nair & Garrett (1997) Nair, S. & Garrett, M. A. 1997, MNRAS, 284, 58
- Narayan & Bartelmann (1999) Narayan, R. & Bartelmann, M. 1999, in Formation of Structure in the Universe, Avishai Dekel & Jeremiah P. Ostriker, eds., Cambridge University Press, p. 360
- O’Dea (1998) O’Dea, C.P. 1998, PASP, 110, 493
- Patnaik et al. (1995) Patnaik, A.R., Porcas, R.W., & Browne, I.W.A. 1995, MNRAS, 274, L5
- Patnaik et al. (1999) Patnaik, A.R., Kemball, A.J., Porcas, R.W., & Garrett, M.A. 1999, MNRAS, 307, L1
- Persson et al. (1998) Persson, S.E., Murphy, D.C., Krzeminski, W., Roth, M., & Rieke, M.J. 1998, AJ, 116, 2475
- Refsdal (1964) Refsdal, S. MNRAS, 128, 307
- Rusin et al. (2001) Rusin, D., Kochanek, C.S., Norbury, M., Falco, E.E., Impey, C.D., Lehár, J., McLeod, B.A., Rix, H.-W., Keeton, C.R., Muñoz, J.A., & Peng, C.Y. 2001, ApJ, submitted (astro-ph/0011505)
- Shepherd (1997) Shepherd, M.C., Astronomical Data Analysis Software and Systems VI, A.S.P. Conference Series, Vol. 125, 1997, Gareth Hunt and H. E. Payne, eds., p. 77
- Snellen, Schilizzi & van Langevelde (2000) Snellen, I.A.G., Schilizzi, R.T., & van Langevelde, H.J. 2000, MNRAS, 319, 429
- Stanghellini et al. (1997) Stanghellini, C., O’Dea, C.P., Baum, S.A., Dallacasa, D., Fanti, R., & Fanti, C. 1997, A&A, 325, 943
- Trotter, Winn & Hewitt (2000) Trotter, Catherine S., Winn, Joshua N., & Hewitt, Jacqueline N. 2000, ApJ, 535, 671
- Turner (1990) Turner, E. 1990, ApJ, 365L, 43
- Wambsganss (1998) Wambsganss, J. 1998, Living Reviews in Relativity, vol. 1, published by the Max-Planck-Institut für Gravitationsphysik (Albert-Einstein-Institut), Germany (http://www.livingreviews.org/Articles/Volume1/1998-12wamb)
- Webster et al. (1995) Webster, R.L., Francis, P.J., Peterson, B.A., Drinkwater, M.J., & Masci, F.J. 1995, Nature, 375, 469
- Winn et al. (2000) Winn, Joshua N., Hewitt, Jacqueline N., Schechter, Paul L., Dressler, Alan, Falco, E.E., Impey, C.D., Kochanek, C.S., Lehár, J., Lovell, J.E.J., McLeod, B.A., Morgan, Nicholas D., Muñoz, J.A., Rix, H.-W., & Ruiz, Maria Teresa 2000, AJ, 120, 2868
- Winn et al. (2001a) Winn, Joshua N., Hewitt, Jacqueline N., Patnaik, Alok R., Schechter, Paul L., Schommer, Robert A., López, Sebastian, Maza, José, & Wachter, Stefanie 2001, AJ, 121, 1223
- Winn et al. (2001b) Winn, Joshua N., Hewitt, Jacqueline N., Lovell, J.E.J., Morgan, N.D., Patnaik, A.R., Pindor, B., Schechter, P.L., & Schommer, R.A. 2001, AJ, submitted (astro-ph/0104092)
| Date | Observatory | Frequency | Bandwidth | Duration | Beam FWHM | RMS level | Flux scale |
|---|---|---|---|---|---|---|---|
| (GHz) | (MHz) | (min) | (mas mas, P.A.) | (mJy/beam) | uncertainty | ||
| 1992 Dec 31 | VLA | 8.440 | 100 | 2 | , | 0.24 | 3% |
| 2000 Apr 01 | MERLIN | 4.994 | 15 | 36 | , | 1.2 | 5% |
| 2000 Apr 24 | VLBA | 4.975 | 64 | 60 | , | 0.4 | 5% |
| 2000 Sep 25 | ATCA | 1.2–9.0aa The ATCA was used to measure total flux densities only, with 2-minute observations at 1.216, 1.344, 1.472, 1.728, 2.240, 2.496, 4.800, 6.080, 8.640, and 9.024 GHz. | 128 | 2 | 5% | ||
| 2000 Oct 15 | VLA | 8.46 | 100 | 10 | , | 0.15 | 3% |
| 2000 Oct 15 | VLA | 14.94 | 100 | 28 | , | 0.40 | 5% |
| 2000 Oct 15 | VLA | 22.46 | 100 | 28 | , | 0.44 | 10% |
| 2000 Oct 15 | VLA | 43.34 | 100 | 28 | , | 0.68 | 10% |
| 2000 Oct 31 | VLBA | 1.667 | 64 | 240 | , | 0.2 | 5% |
Note. — The J2000 coordinates of component A of J0134–0931 are , within .
| Component | R.A. | Decl. | Flux ratio, |
|---|---|---|---|
| (mas) | (mas) | rel. to D | |
| A | |||
| B | |||
| C | |||
| D | 0 | 0 | 1 |
| E |
Note. — Figures reported here are the average of the modeling results applied to the VLA and MERLIN data. Each quoted uncertainty is the standard deviation of these results.
| Component | R.A. | Decl. | Flux density | P.A. | ||
|---|---|---|---|---|---|---|
| (mas) | (mas) | (mJy) | (mas) | |||
| A1 | ||||||
| A2 | ||||||
| B | ||||||
| C | ||||||
| D | 0 | 0 |
Note. — Each component is an elliptical Gaussian with the specified position, flux density, FWHM major axis (, ellipticity (), and position angle (degrees east of north).
| Component | R.A. | Decl. | Flux density | P.A. | ||
|---|---|---|---|---|---|---|
| (mas) | (mas) | (mJy) | (mas) | |||
| A | ||||||
| B | ||||||
| D | 0 | 0 | ||||
| F |
Note. — Each component is an elliptical Gaussian with the specified position, flux density, FWHM major axis (, ellipticity (), and position angle (degrees east of north).
| Source | Filter | Magnitude |
|---|---|---|
| CTIO 4m / Mosaic II | B | |
| CTIO 4m / Mosaic II | V | |
| CTIO 4m / Mosaic II | R | |
| CTIO 4m / Mosaic II | I | |
| 2MASS | J | |
| LCO 2.5m / CIRSI | H | |
| 2MASS | H | |
| 2MASS | K |