Penetrating the Mask: The Gravitational Torque of Bars
Abstract
The Hubble classification scheme of galaxies is based on blue-light appearance. Atlases reveal the rich variety of responses of the Population I component (‘the mask’) of gas and dust to the underlying, older, stellar population. However, the Population I component may only constitute 5 percent of the dynamical mass of the galaxy; furthermore, dusty masks are highly effective in hiding bars. In the 1960s, Ken Freeman presented a meticulous study of the dynamics of bars at a time when nonbarred galaxies were called “normal” spirals and barred galaxies were regarded as curiosities. Now we know that it is more “normal” for a galaxy to be barred than to be nonbarred. What is the range for the gravitational torques of bars? We describe here a recently developed method for deriving relative bar torques by using gravitational potentials inferred from near-infrared light distributions. We incorporate a bar torque class into the Block/Puerari dust-penetrated galaxy classification system. We find a huge overlap in relative bar torque between Hubble (Sa, Sb, …) and (SBa, SBb, …) classifications. Application of the method to the high redshift universe is briefly discussed.
University of the Witwatersrand, Johannesburg, South Africa
University of Alabama, Tuscaloosa, Alabama, USA
INAOE, Tonantzintla, Puebla, México
Isaac Newton Group of Telescopes, La Palma, Spain
IBM Research Division, Yorktown Heights, NY, USA
Univ of Hertfordshire, Hatfield, Herts, UK
Vassar College, Dept Phys & Astronomy, Poughkeepsie, NY, USA
1. Introduction
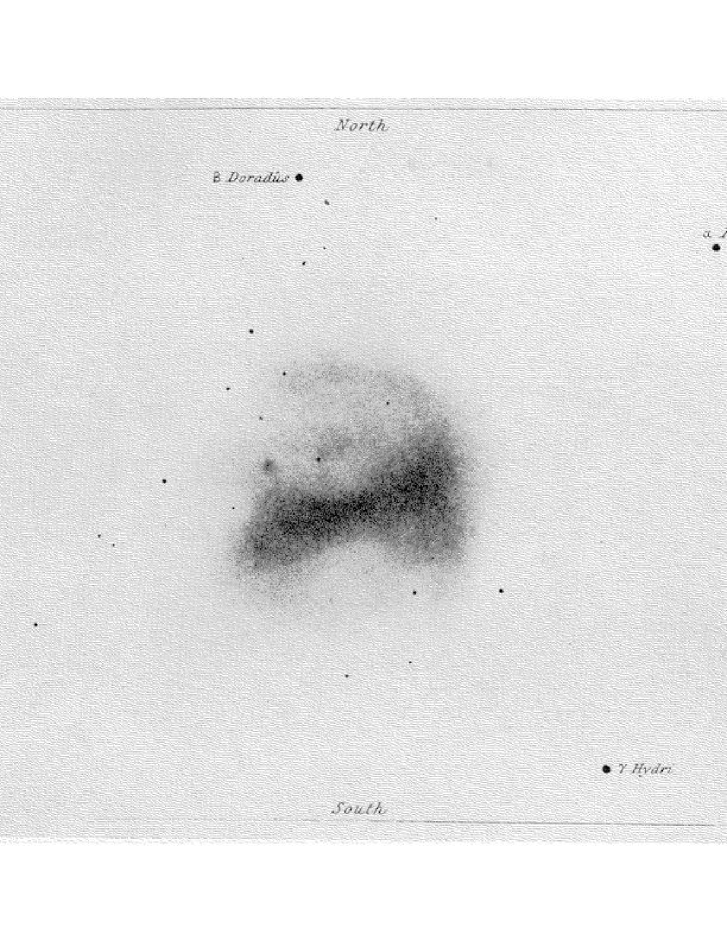
Bars have been recognized in galaxies since the time of Curtis (1918) and Hubble (1926), although the bar-like structure of the LMC was already beautifully portrayed in a remarkable sketch by J. Herschel in 1847 (Figure 1). Bars are among the most interesting features of galaxies that present a clear challenge to theorists. It is not surprising, then, that bars attracted the early attention of Ken Freeman, who applied his mathematical expertise to understanding them in a remarkable series of papers published in the 1960s (Freeman 1965; 1966a,b,c). Of course, at that early stage, bars were regarded mostly as dynamical curiosities rather than representing a major topic of research, which still continues to unfold at the present time. Nevertheless, Ken pursued them initially in his Cambridge dissertation work and later developed a model of asymmetric barred galaxies in a collaborative effort with G. and A. de Vaucouleurs (de Vaucouleurs, de Vaucouleurs, and Freeman 1968).
Ken’s work, in a way, culminated with his fine review of barred galaxies with Gerard de Vaucouleurs, the first really significant review of the subject (de Vaucouleurs and Freeman 1972). This long article focussed mainly on the features of late-type, asymmetric barred spirals of the Magellanic type, and also outlines an early interpretation of the nature of the inner rings of SB(r)-type galaxies in terms of a class of resonant periodic orbits. It is interesting to note that at the time of Ken’s work, the status of rotation curves suggested that bars rotated as rigid bodies (see also Figure 2).
It is also remarkable that only recently have people perceived just how strong bars are in their host galaxies, that is, how significant is their forcing relative to the dominant mass components. This was previously known only in a few individual cases that had been the subject of detailed dynamical models (e.g., Lindblad, Lindblad, and Athanassoula 1996). For the general galaxy population, the quantification of bar strength in terms of forcing had to wait for the advent of routine near-infrared imaging. We have been engaged in dust-penetrated galaxy classification for some time now, and describe here a recently-developed method for quantifying the gravitational torques of bars using potentials inferred from near-IR images. Bar strength is important in galaxy morphological studies because phenomena such as gas inflow, angular momentum transfer, noncircular motions, lack of abundance gradients, nuclear activity, starbursts, and the shapes and morphologies of rings and spirals, may all be tied in various ways to the effectiveness with which a bar potential influences the motions of stars and gas in a galactic disk (e.g., Sellwood & Wilkinson 1993; Buta & Combes 1996; Knapen 1999).
2. Removing the Mask: Dust-Penetrated Galaxy Classification
Two hours north of Dunk Island, our meeting locale, lies the land of Papua New Guinea. It is the country where masks still dance. Customs have remained unchanged for centuries. Where men and women, as if from the stone age, meet the New Millennium. In Roget’s Thesaurus, we find the following:
Mask: [noun] screen, cloak, shroud. [verb] to camouflage, to make opaque, to disguise.
Optically thick dusty domains in galactic disks can completely camouflage or disguise underlying stellar structures. Cosmic dust grains act as masks. The dust masks obscure whether or not the dust lies in an actual screen or is well intermixed with the stars. The presence of dust and the morphology of a galaxy are inextricably intertwined: indeed, the morphology of a galaxy can completely change once the Population I disks of galaxies – the masks – are dust penetrated (e.g., Block and Wainscoat 1991; Block et al., 1994, 2000).
The classification of galaxies has traditionally been inferred from photographs or CCD imaging shortward of the 1 window, where stellar Population II disks are not yet dust-penetrated. Images through an (0.8 ) filter can still suffer from attenuations by dust at the 50% level. The NICMOS and other near-infrared camera arrays offer unparalleled opportunities for deconvolving the Population I and II morphologies, because the opacity at – be it due to absorption or scattering – is always low. The extinction (absorption+scattering) optical depth at is only 10% of that in the V-band.
Many years before the advent of large format near-infrared camera arrays, it became increasingly obvious from rotation curve analyses that optical Hubble type is not correlated with the evolved Population II morphology. This was already evident in the pioneering work of Zwicky (1957) when he published his famous photographs showing the ‘smooth red arms’ in M51. In the Hubble Atlas and other atlases showing optical images of galaxies, we are looking at masks: at the gas, not the stars, to which the properties of rotation curves are inextricably tied.
3. A duality in spiral structure
There is a fundamental limit in predicting what an evolved stellar disk might look like (Block et al. 1994, 2000). The greater the degree of decoupling, the greater is the uncertainty. The fact that a spiral might be flocculent in the optical is very important, but it is equally important to know whether or not driving the dynamics is a grand design old stellar disk.
Decouplings between stellar and gaseous disks are cited in many studies including Grosbøl & Patsis (1998), Elmegreen et al. (1999), Block et al. (2000) and Puerari et al. (2000). The Hubble type of a galaxy does not dictate its dynamical mass distribution (Burstein & Rubin 1985). This is confirmed by examining Fourier spectra, for example, of the evolved disks of NGC 309 (Sc) and NGC 718 (Sa); these spectra are almost identical (Figs. 11 and 12 in Block et al. 2001a).
4. Bar Strength: the 60s versus the 00s
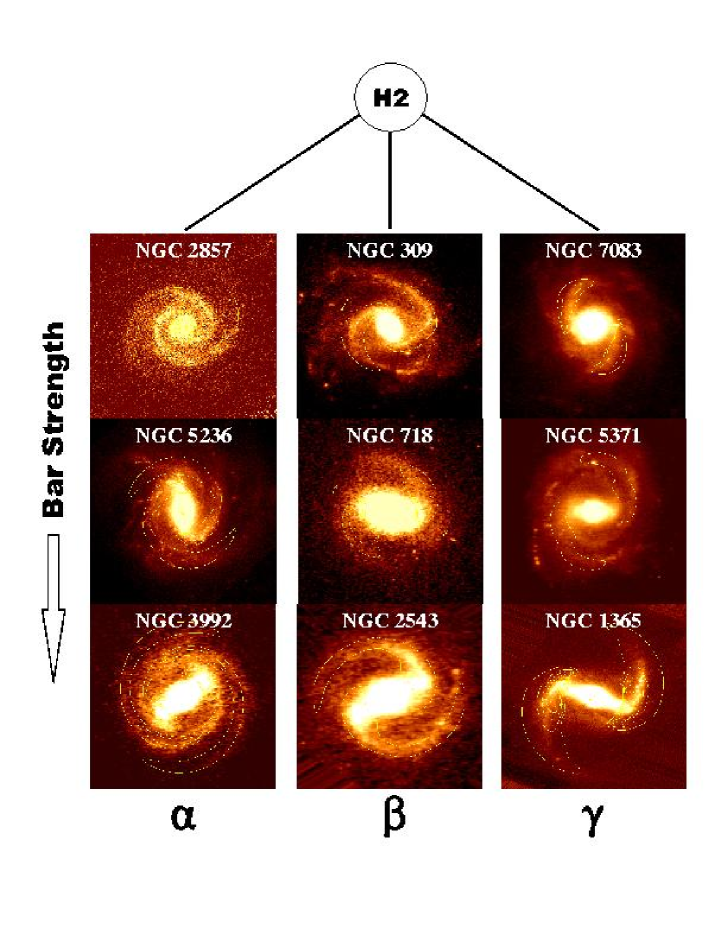
In the 60s, bar strength was something that was judged visually on blue-light photographs. Galaxies were recognized as either S or SB in Hubble’s (1926, 1936) system, or as SA, SAB, SB in de Vaucouleurs’ (1959) revised Hubble system. It was assumed that an SB galaxy has a stronger bar than an S galaxy, and that the sequence SA-SAB-SB was a sequence of increasing average bar strength However, neither the Hubble nor the de Vaucouleurs bar classifications can be expected to be accurate measures of bar strength in individual cases because apparent bar strength is impacted by wavelength, the effects of extinction and star formation, inclination and bar orientation relative to the line of sight, and also on observer interpretations. The percentage of unbarred galaxies in the Carnegie Atlas dramatically drops from 70% to only 27% when Sa, Sb, Sc spirals are mask-penetrated (Eskridge et al. 2000; see also Knapen, Shlosman & Peletier 2000, Block & Wainscoat 1991). Thus, the near-IR is the best wavelength regime for quantifying the strength of bars. A simple, easily reproducible quantitative near-infrared morphological classification scheme for spirals that accounts for bar strength, dominant harmonic, and arm pitch angle class has been proposed by Block & Puerari (1999) and Buta & Block (2001) and is seen in Figure 3.
5. Bar Strengths Derived from Gravitational Torques
Any reliable measure of bar strength ought to involve forces, because this is how the influence of a bar is actually felt. Unlike the axisymmetric background, a bar involves both radial and tangential forces. The most elegant definition of bar strength in terms of these force components was proposed by Combes and Sanders (1981). Given the gravitational potential in the disk plane, these authors defined the bar strength at radius as
| (1) |
where represents the maximum amplitude of the tangential force and is the mean axisymmetric radial force, inferred from the =0 component of the gravitational potential. In this approach, the strength of the bar is measured relative to the axisymmetric forces of the background disk. A relatively thin bar imbedded in a massive axisymmetric disk may have significant tangential forces, but relative to the background radial force field, it could be weak. Thus, measuring bar strength as a force ratio (rather than an isophotal axis ratio) is an idea whose time has come. Our gravitational potentials are derived from near-IR images under the assumptions of a constant mass-to-light ratio and an exponential vertical scale height (Quillen, Frogel, & González 1994).
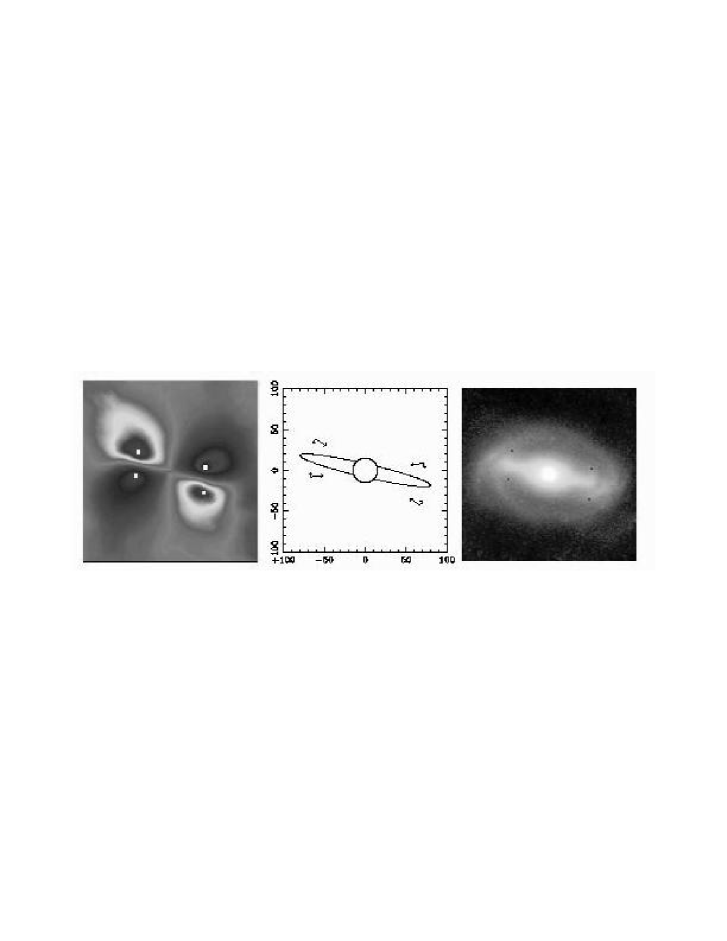
A tangential-to-radial force ratio map reveals a butterfly pattern that is the characteristic signature of a bar (see Figure 4, adapted from Buta & Block 2000). The actual force ratio changes sign from quadrant to quadrant relative to the bar axis, because the total force in the plane is slightly offset towards the ends of the bar. In the case of perfect symmetry, would reach a maximum at the same radius and angle relative to the bar in each quadrant. However, slight asymmetries and/or noise can make these maxima different in each quadrant. If we let = in quadrant , then the average of these four values can provide a single measure of bar strength for a whole galaxy, if the gravitational potential is known. We call this average the relative bar torque parameter, . The are known as the “maximum points.”
Bar torque classes are defined in terms of intervals of . Bar class Bc=1 includes galaxies having relative torques = 0.10.05 (meaning the tangential force reaches a maximum of 10% of the axisymmetric background radial force); class 2 involves those with = 0.20.05, etc., up to class 6 (Buta & Block 2001).
Uncertainties in the bar torque method are discussed in Buta & Block (2001). These include simple deprojection uncertainties, such as bulge “deprojection stretch”, as well as more complex uncertainties, such as variations in the stellar mass-to-light ratio with position, the impact of dark matter and bulge thickness, vertical resonances and the thickening of bars, and the generally unknown vertical scale heights of disks. Future studies will involve evaluating these uncertainties further and refining the method.
6. Hubble Classifications and Bar Torques
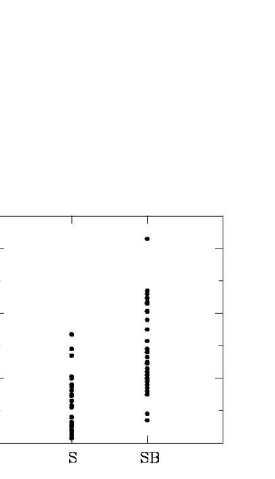
From our studies (Buta & Block 2001; Block et al. 2001b), we have estimates of for 75 galaxies at this time. Figure 5 shows how this parameter correlates with optical bar classification in the Revised Shapley-Ames Catalogue (RSA, Sandage and Tammann 1981). A wide range of relative bar torques characterizes each of the S and SB categories. Category S (i.e., optically unbarred) in Fig. 5 includes galaxies ranging from bar torque class 0 (e.g., NGC 628) to bar class 3 (e. g., NGC 1042). NGC 4321, a Hubble Sc prototype, has a bar class of 2. Likewise, NGC 4450 (Sab) is of bar class 2.
Similarly, Hubble category SB in the RSA has a wide range of bar strengths. This category commences at a bar torque of class 1 (e.g., NGC 5371) and reaches bar class 5 (e.g., NGC 7741) and class 6 (e.g., NGC 7479). In other words, the bar strengths of some RSA SB galaxies may be weaker than those found in RSA unbarred spirals such as NGC 1042 (Sc; near-infrared bar class 3). This is not due to the uncertainties in the method, but instead reflects the difficulties of making reliable bar strength judgments in the visual Hubble system. The work of Knapen et al. (2000) reaches this identical conclusion, using their independent definition of bar strength.
Martin (1995) classified bars according to shape of isophotes. One of the strongest classes in Martin’s sample is bar ellipticity class 7. It is interesting to note that highly elliptical bars as measured by Martin (1995) need not have strong gravitational bar torques (see Figure 6).
7. Toward the future: Choice of instruments for NGST and Dust penetrated morphology in the high-redshift universe
HDF morphology preferentially samples restframe UV light. Does the duality of spiral structure, found in our local Universe (section 2) persist at higher ? In order to explore the capability of NGST for undertaking stellar (as opposed to gaseous) morphology studies in the higher redshift universe, Block et al. (2001a) present NASA-IRTF and SCUBA observations of NGC 922, a chaotic system in our local Universe which bears a striking resemblance to objects such as HDF 2-86 () in the HDF North. If objects such as NGC 922 are common at high-redshifts, then this galaxy may serve as a local morphological ‘Rosetta stone’ bridging low and high-redshift populations. Block et al. (2001a) show that quantitative measures of galactic structure are recoverable in the rest-frame infrared for NGC 922 seen at high redshifts using NGST, by simulating the appearance of this galaxy at redshifts z=0.7 and z=1.2 in rest-frame K′. Our results suggest that the capability of efficiently exploring the rest-wavelength IR morphology of high-z galaxies should probably be a key factor in deciding the final choice of instruments for the NGST.
8. Concluding Thoughts: Freeman and Ornithology
The work of Ken Freeman in bars and galaxy dynamics may be likened to his great passion for ornithology. Species such as Aquila Rapax (the Tawny Eagle) and Aquila Nipalensis (the Steppe Eagle) survey their terrain with exceptionally keen foresight. Ken recognised the fundamental nature of bars three decades ahead of the commissioning of large format HgCdTe arrays in the early 1990s.
Acknowledgments.
DLB is indebted to Ken and to the SOC for their invitation to participate in this Workshop. It is also a pleasure to thank Gary Da Costa for his prompt reply to emails, to facilitate travel to Dunk Island. RB would like to thank Ken for inspiring his early interest in barred galaxies and resonance rings. DLB is indebted to SASOL for sponsoring his sabbatical, during which time this paper was prepared. In particular, he wishes to express his deep appreciation to Mr P. Kruger, Mr P. Cox and the entire SASOL Board. Without the financial support of the Anglo-American Chairman’s Fund, none of this research would have been possible. A special note of thanks is expressed to the CEO of the Anglo-American Fund, Mrs M. Keeton. BGE was supported by grant AST-9870112 from the U. S. National Science Foundation.
References
Block D.L. et al. 1994, A&A, 288, 365
Block D.L. & Wainscoat R.J. 1996, Nature, 353, 48
Block D.L. & Puerari I. 1999, A&A, 342, 627
Block, D.L. et al. 2000, ‘Toward a New Millennium in Galaxy Morphology’ (eds. D.L. Block, I. Puerari, A. Stockton & D. Ferreira, Kluwer); see also Ap&SS, 269, 5
Block, D.L. et al. 2001a, A&A, 371, 393
Block, D.L. et al. 2001b, A&A(in press) [astro-ph/0106019]
Burstein D. & Rubin V. 1985, ApJ, 297, 423
Buta, R.J. & Combes, F. 1996, Fund. Cosmic Phys. 17, 95
Buta, R.J. & Block, D.L. 2001, ApJ, 550, 243
Combes, F. & Sanders, R. H. 1981, A&A, 96, 164
Curtis, H. D. 1918, Pub. Lick Obs. XIII, Part I, 11
de Vaucouleurs, G. 1959, Handbuch der Physik, 53, 275
de Vaucouleurs, G. & Freeman, K.C. 1972, Vistas in Astronomy, 14, 163
de Vaucouleurs, G., de Vaucouleurs, A, & Freeman, K. C. 1968, MNRAS, 139, 425
Elmegreen, D.M. et al. 1999, AJ, 118, 2618
Eskridge, P. et al. 2000, AJ 119, 536
Freeman, K.C. 1965, MNRAS, 130, 183
Freeman, K.C. 1966a, MNRAS, 133, 47
Freeman, K.C. 1966b, MNRAS, 134, 1
Freeman, K.C. 1966c, MNRAS, 134, 15
Freeman, K. C. 1992, in Physics of Nearby Galaxies: Nature or Nurture?, T. X. Thuan, C. Balkowski, and J. Tran Thanh Van, eds., Gif-sur-Yvette, Editions Frontiere, p. 201
Grosbøl, P.J. & Patsis, P.A. 1998, A&A, 336, 840
Herschel, J. 1947, ‘Results of astronomical observations made during the years 1834-8 at the Cape of Good Hope’, Smith and Col., London.
Hubble, E. 1926, ApJ, 64, 321
Knapen, J.H. 1999, in The Evolution of Galaxies on Cosmological Timescales, J.E. Beckman & T.J. Mahoney, Eds., ASP Conf. Ser. 187, 72
Knapen, J.H., Shlosman, I. & Peletier, R.F. 2000, ApJ, 529, 93
Lindblad, P. A. B., Lindblad, P. O., & Athanassoula, E. 1996, A&A, 313, 65
Martin, P. 1995, AJ, 109, 2428
Puerari, I. et al. 2000, A&A, 359, 932
Quillen, A. C., Frogel, J. A., & González, R. 1994, ApJ, 437, 162
Sandage, A. & Tammann, G. 1981, “A Revised Shapley-Ames Catalog of Bright Galaxies” [RSA] (Carengie Inst; Wash. DC)
Sanders, D.B. 2000, Ap&SS, 269, 381
Sellwood, J.A. & Wilkinson, A. 1993, Rep. Prog. Phys. 56, 173
Zwicky, F. 1957, ‘Morphological Astronomy’, Springer-Verlag, Berlin.