BZ Cam during its 1999/2000 optical low state
We report optical observations of the VY Scl star BZ Cam during its previous optical low state in 1999/2000. We find drastic variations in the line profiles. Narrow-band imaging observations show that its nebula extends farther than previously known and seems to be composed of two components. We determine the [O III] line intensity of BZ Cam’s nebula to 4.810-13 erg/cm2/s. We discover a proper motion of BZ Cam of 252 mas/yr which together with the systemic radial velocity yields a space velocity of 125 km/s. We re-interpret the nebula as being photo-ionized by hypothesized transient, luminous, supersoft X-ray emission during optical low states, and shaped by the transverse motion of BZ Cam.
Key Words.:
X-ray: stars – binaries: close – reflection nebulae – stars: individual: BZ Cam, RX J0513.9–6951, CAL 831 Introduction
BZ Cam is a binary system with a period of 221 min (Patterson et al. 1996). It is thought to contain an accreting white dwarf and a 0.3–0.4 M⊙ main-sequence donor (Lu & Hutchings 1985). BZ Cam belongs to the group of variable stars called VY Scl stars, or anti-dwarf novae, due to its occasional drop in brightness. Most of the time it spends at around V = 12.0-12.5 mag ( 0.2 mag), but during low states it is as low as V = 14.3 mag. Only one previous optical low state is known, which occurred in 1928 (Garnavich & Szkody 1988).
BZ Cam is surrounded by a faint emission nebula (Ellis et al. 1984) which has a bow-shock-like structure (Krautter et al. 1987, Hollis et al. 1992). This nebula is also detected at radio frequencies (Hollis et al. 1992), implying a 35 cm-3 density in the H II recombination region (assuming an electron temperature of 104 K). Based on the optical emission line ratios these authors argue that photoionization can not alone account for the excitation of the nebula, and that shock wave heating seems to contribute. Based on IUE data BZ Cam was found to exhibit a wind (Hollis et al. 1992), which was recently also detected in the optical as well as to display rapid variability (Ringwald & Naylor 1998), rare among canonical CVs.
Supersoft X-ray binaries (SSB) were established as new class of astronomical objects during the early 90ies (Greiner 2000). They contain a white dwarf (WD), accreting mass at rates high enough to allow quasi-steady nuclear surface burning (van den Heuvel et al. 1992). Their luminosities are of order of erg s-1, with typical temperatures of 30–50 eV. Two SSBs have particular properties which are worth mentioning in this context: (i) CAL 83: It is the only SSB (among a dozen SSBs searched) which is surrounded by a distinct nebula (Pakull & Motch 1989, Remillard et al. 1995) caused by ionization of the surrounding interstellar medium by the luminous X-ray radiation (Rappaport 1994). (ii) RX J0513.9–6951: It shows quasi-periodic optical low states (Southwell et al. 1996) during which supersoft X-ray emission is “on” (Schaeidt et al. 1993). Among the “classical” CVs two systems have recently been shown to exhibit transient, supersoft X-ray emission, both during periods of optical low states: the VY Scl star V751 Cyg (Greiner et al. 1999) and V Sge (Greiner & Teeseling 1998).
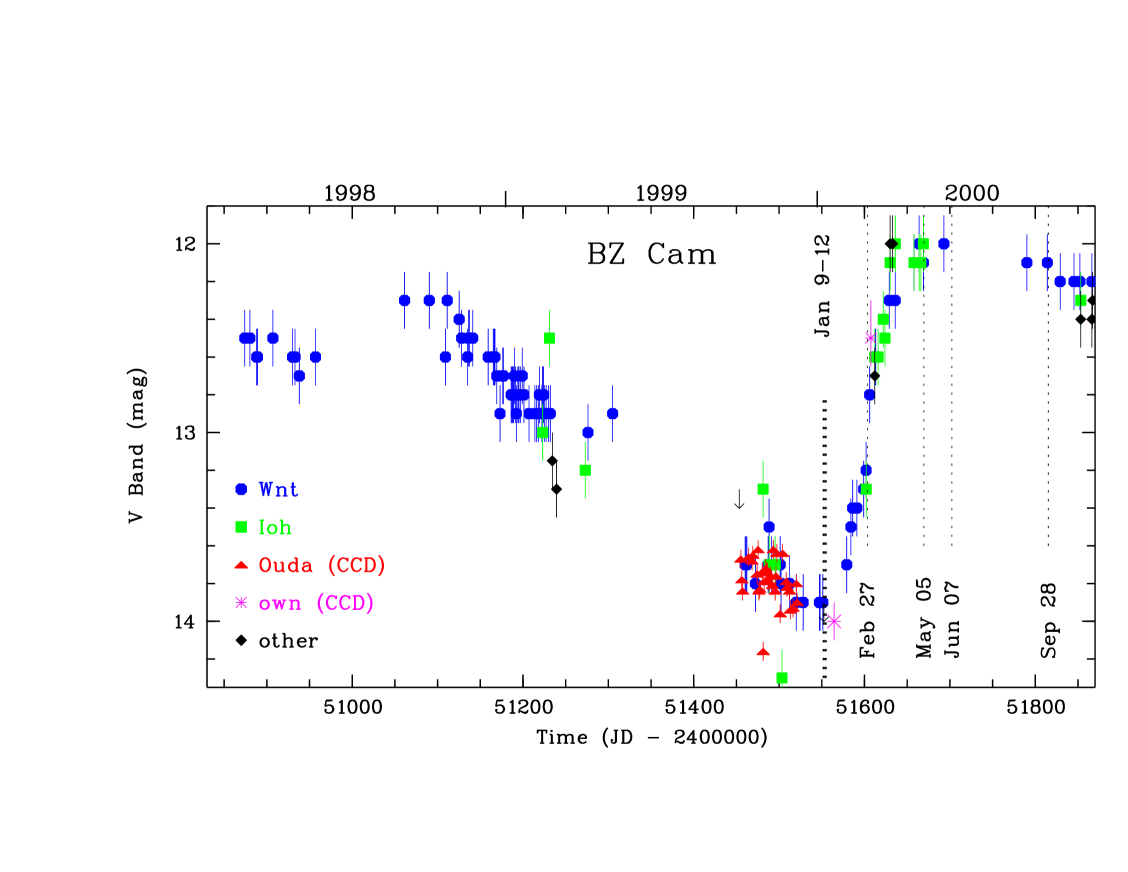
BZ Cam recently entered a very rare optical low state. Fig. 1 shows the optical light curve of BZ Cam over the last 2 years covering the recent optical low state. Due to the prolonged intermediate brightness state at around V 12.5–13.2 mag since at least 1997 it is difficult to accurately establish the beginning of this recent low state, but a reasonable estimate is after JD = 2451300 (see Fig. 1). BZ Cam moved out of its low state around Feb./Mar. 2000 (starting around JD = 2451580; note the seemingly slow fading, but rapid rise).
We report here on our observations triggered by this rare optical low state.
2 Observations and Interpretation
| Teles- | Date | Filter/ | D(2) | TInt |
|---|---|---|---|---|
| cope(1) | (2000) | Wavelength | (hrs) | (sec) |
| INAOE 2.1m | Jan 9–12 | 4000–7500 | 1.0(3) | 1500 |
| AIP 0.7m | Jan 21 | white | 1.7 | 10 |
| AIP 0.7m | Feb 02 | V | 0.5 | 30 |
| Tbg 2.0m | Feb 27 | 3500–9500 | 1.9 | 1800 |
| INAOE 2.1m | Feb 26–28 | 4000–7500 | 1.0(3) | 1800 |
| OAN 1.0m | Mar 04 | V/R | 0.5 | 60 |
| INAOE 2.1m | May 05 | 4000–7500 | 4.0 | 1500 |
| Tbg 2.0m | Jun 7/8 | 4000–8500 | 1.9 | 1800 |
| WIYN 3.5m | Sep 28 | [OIII], H | 600 |
(1) The abbreviations mean:
AIP = Astrophysical Institute Potsdam, Germany;
OAN = Tonantzintla, Mexico
INAOE = 2.1m at Cananea Observatory, 1.0m at Tonantzintla, Mexico;
Tbg = Tautenburg Observatory, Germany;
WIYN = WIYN Telescope, Kitt Peak, USA
(2) Duration of the temporal photometric coverage.
(3) 1 hr in each night.
We acquired photometric and spectroscopic observations (see Tab. 1 for a log) in the optical low state, during the rise out of the optical low-state and in the subsequent optical high-state. The optical light curve (including data compiled from VSNET) with the times of our observations marked is shown in Fig. 1.
Low resolution spectra of BZ Cam were obtained at the 2.1 m telescope at Cananea, México in winter of 2000. The LFOSC spectrograph (Zickgraf et al. 1997) was deployed in mid-January (8–11) observations to cover the 4000–7500 Å wavelength range with 13 Å FWHM resolution. A 3 arcsec wide long slit, as projected on the sky, was used at the entrance of this multi-object spectrograph. Later in the month (27-29 January) the object was again observed using the same telescope, but with the B&Ch spectrograph instead of the LFOSC. The resolution was slightly better than 10Å, and the coverage of wavelengths was about the same. Again, the B&Ch spectrograph with the same telescope and same settings was used in May, when BZ Cam was back to its high state, to acquire a few spectra. Spectrophotometric standard stars were observed at each night in order to provide flux calibration. A He-Ar arc lamp was utilized in order to calibrate the spectra for wavelengths. IRAF standard procedures of long slit spectroscopy were used for data processing.
The photometric measurements of the object in the and bands were done at the 1.0 m telescope of OAN in Tonantzintla, México on March 4.
Observations with the 3.5 m WIYN telescope at Kitt Peak (USA), operated by the University of Wisconsin, Indiana University, Yale University, and the National Optical Astronomy Observatories, were done using a mosaic of four 2K2K CCDs.
Spectroscopic observations at Tautenburg were done using the newly developed spectrograph for the Nasmyth-focus of the 2.0 m Schmidt telescope. Grisms with 200 Å/mm and 100 Å/mm were used, respectively. Reduction of the spectra was performed using standard MIDAS routines from the long-slit package. Wavelength calibration was done using night sky lines.
Photometric observations at the 0.7m telescope at AIP employed a 1K1K TEK CCD camera. In the Cassegrain focus the 24 m pixel size corresponds to a plate scale of 05/pixel, completely sufficient for the typically bad seeing (2–4′′). Initial basic reduction was done using standard MIDAS programmes, while the photometry was done with DoPhot (Mateo & Schechter 1989).


2.1 Low-/high-state spectra
Sample spectra are shown in Fig. 2, and emission line measurements during the optical low-state are presented in Tab. 2 (note that during the high state the lines vary very rapidly; see e.g. Ringwald & Naylor 1998, so we do not present emission line ratios). Several spectral differences are immediately recognized from the examination of the spectra in different brightness states:
-
•
The spectral slope is much flatter during the optical low state. Assuming that the spectrum is a composite of the contributions from the accretion disk and a hotter white dwarf, this changing slope suggests that the hot component gets even hotter (e.g. by reduction in size at constant bolometric luminosity), thus shifting the Wien tail out of the optical bandpass.
-
•
All emission lines strengthen with decreasing brightness.
-
•
The P Cyg profiles of (Balmer and He I) emission lines (indicative of a wind) show up only in the high state, but are absent during the optical low and intermediate state;
-
•
The He II emission is absent in the high state, is visible in the intermediate state, and strengthens further in the low state.
-
•
With H being stronger than H in the low state, or more generally, with the Balmer line ratios not following the canonical intensity ratios in close binaries, it seems plausible that these lines are emitted on top of a (sometimes broader) Balmer absorption system. This is particularly obvious in the intermediate state where the Balmer absorption is much broader than the emission system.
As was shown by Ringwald & Naylor (1998) the emission line profiles and their variability during the optical high state confirm the close binary nature of BZ Cam, but yet the profiles as well as the variability differ significantly from ordinary CVs. Also, the rapidly variable wind is exceptional among CVs. This could be due to the accretion rate being very high during the optical high state, leading possibly even to a more spherical-like accretion geometry. One could speculate on whether or not this may lead to the ignition of H burning. Since then the white dwarf would burn more matter than the companion transfers into the disk, it could possibly empty the disk, and thus lead to the consequent onset of an optical low state.
The non-canonical intensity ratios of the Balmer emission lines during the optical low state (Tab. 2) is most probably due to a Balmer absorption system which is obvious during the intermediate state, but possibly has not completely vanished during the other states. We mention here that it is a general feature in short-period SSBs that e.g H and H are clearly seen in absorption while H and H are progressively filled. Certainly, this effect is much more drastic in SSBs, but it could potentially serve as an explanation of the emission line ratios in BZ Cam as well.
Another noteworthy property is the rather small intensity of the He II emission. This is in contrast to the fact that in SSB the He II emission line is usually the strongest line, or at least stronger than H. However, this can be understood in terms of different temperatures of the white dwarf and correspondingly different ionizing flux for He II. The mass of the white dwarf in BZ Cam is certainly smaller than 1 M⊙, and more probably in the range of 0.4–0.7 M⊙ (Lu & Hutchings 1985). In contrast, white dwarf masses in SSB are thought to be 1 M⊙, and consequently the effective temperatures are higher for SSB white dwarfs as compared to BZ Cam. While this difference has little effect on the number of ionizing photons for hydrogen (912 Å), it has a drastic effect on the number of ionizing photons for He II (228 Å).
| Spectral Line | Relative Flux |
|---|---|
| H | 0.81-0.91 |
| HeI | 0.21-0.34 |
| H | 0.78-0.85 |
| H | 1.0 |
| (2000) | epoch | source | |
|---|---|---|---|
| 06h 29m 33940 | 71° 04′ 3879 | 1897.994 | AC2000 |
| 06h 29m 34100 | 71° 04′ 3767 | 1953.113 | POSS1-E |
| 06h 29m 33844 | 71° 04′ 3765 | 1954.099 | POSS1-E |
| 06h 29m 34004 | 71° 04′ 3669 | 1983.847 | POSS-V |
| 06h 29m 33992 | 71° 04′ 3700 | 1983.847 | POSS-V |
| 06h 29m 34001 | 71° 04′ 3428 | 1986.160 | FONAC∗ |
| 06h 29m 34006 | 71° 04′ 3668 | 1989.971 | POSS2-R |
| 06h 29m 33937 | 71° 04′ 3620 | 1996.050 | POSS2-B |
| 06h 29m 33950 | 71° 04′ 3710 | 1996.670 | HST∗ |
| 06h 29m 33997 | 71° 04′ 3645 | 1997.184 | POSS2-R |
| 06h 29m 34122 | 71° 04′ 3634 | 1997.850 | POSS2-B |
∗ – not used in final proper motion solution.
2.2 Proper motion of BZ Cam
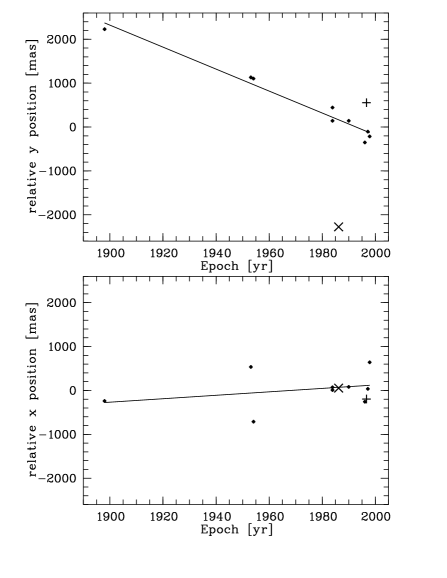
In order to estimate the proper motion of BZ Cam, we looked for Digitized Sky Survey (DSS) data using the plate finder service at the Space Telescope Science Institute. On the 8 Palomar Schmidt plates with a time baseline of more than 40 years (see Tab. 3) found in the DSS we measured the position of BZ Cam using the plate constants provided with the FITS images and the ESO Skycat tool. As one can see in Tab. 4, we obtain already a clear proper motion in negative -direction using only these Schmidt plates measurements, whereas in -direction the proper motion is smaller than its relatively large error.
Searching the VizieR database in Strasbourg for more independent measurements of the position of BZ Cam, we were lucky to find an early epoch from the Astrographic Catalogue AC2000 (Urban et al. 1997, Urban et al. 1998). In addition, there are two other positions from the HST archive and from the FONAC catalogue (Kislyuk et al. 1999), both with similar epochs as with the POSS2 data (see Tab. 3).
Combining the POSS measurements with the AC2000 position the resulting proper motion becomes more accurate in both directions, with reaching Hipparcos-like accuracy. The error in remains twice as large, mainly due to the very different positions measured on the POSS1 plates. When the additional positions from the HST and FONAC are included, the errors of remain at the same level whereas those of increase, especially after including the FONAC position. As can be seen from Tab. 3, the value from FONAC is a clear outlayer compared to all other values. This is also the reason, why the proper motion of BZ Cam given in the FONAC catalogue (as determined from only two positions - from the Astrographic Catalogue and from one second epoch plate measurement of the Kiev wide-angle astrograph) is distinctly different in (see also Tab. 4). The errors of the FONAC proper motion correspond to the catalogue precision given in Kislyuk et al. (1999).
For our further analysis we adopted the proper motion solution obtained from 8 POSS plates and the AC2000: = 3.94.1 mas/yr and = –25.11.8 mas/yr. This solution is in good agreement with other solutions (except the FONAC ) and shows the smallest total proper motion error.
| positions used in solution | ||
|---|---|---|
| [mas/yr] | ||
| 8POSS | 5.19.2 | 29.92.9 |
| 8POSS+AC2000 # | 3.94.1 | 25.11.8 |
| 8POSS+AC2000+HST | 3.24.2 | 23.62.7 |
| 8POSS+AC2000+HST+FONAC | 3.23.9 | 26.38.6 |
| FONAC (Kislyuk et al. 1999) | 3.73.0 | 42.63.0 |
# – finally adopted proper motion solution in this paper.
At a distance of 830160 pc (Naylor & Ringwald 1998) this corresponds to a transverse velocity of 10020 km (solely towards the South), where most of the uncertainty stems from the distance error. Adding a systemic radial velocity component of about –75 km/s (Lu & Hutchings 1985, Patterson et al. 1996) we derive a space velocity of BZ Cam of 125 km/s.
2.3 The nebula revisited
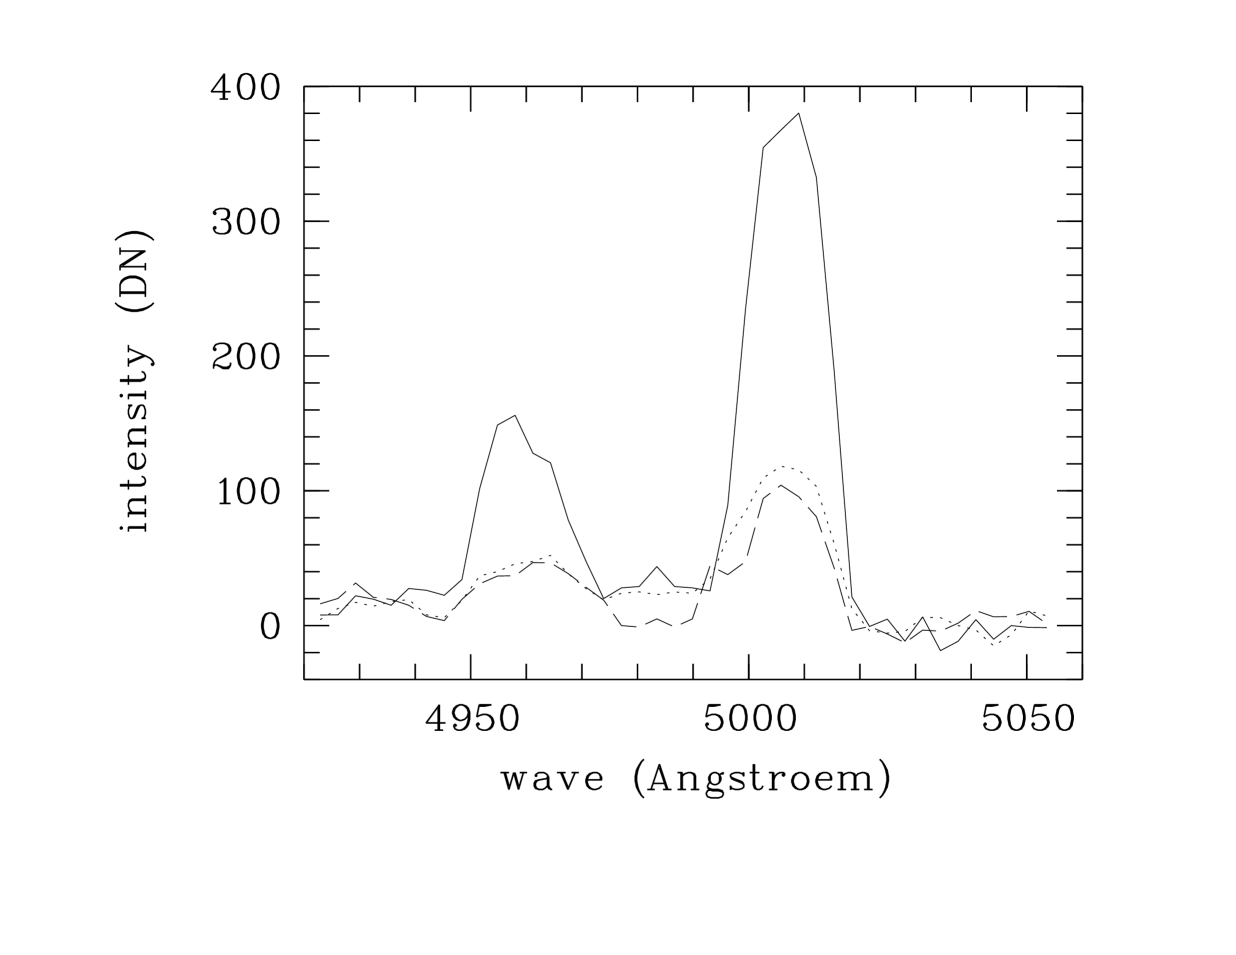
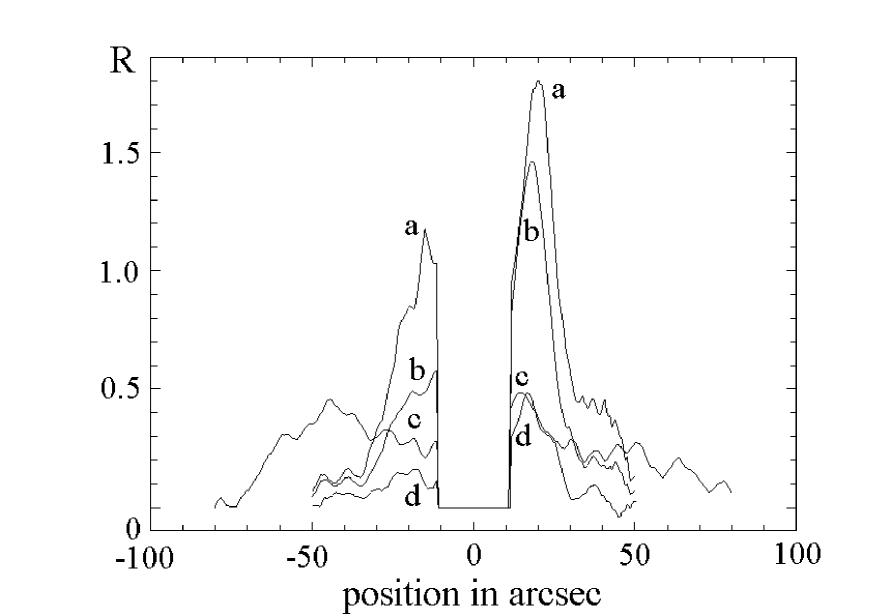
We also obtained narrow-band filter images in H and the [O III] 4959/5007 Å emission lines, showing the large nebula around BZ Cam (Krautter et al. 1987, Hollis et al. 1992). Based on our higher sensitivity we find that the nebula seems to be composed of two components: (i) a large, smooth component with bow-shock like shape towards the South, and a (ii) smaller, filamentary component which also has a bow-shock like shape towards the south, but with a smaller curvature radius, and in addition with cometary-tail like extensions towards the North-East and North-West (Fig. 4). A nebula spectrum around the [O III] line is displayed in Fig. 5. In certain regions of the nebula the [O III] line is very strong relative to H, whereas in other regions it is not. Fig. 6 shows these relative intensity variations for a few line ratios across the nebula. One prominent example is the spectral difference of the two arcs marked as “A” and “B” in the right panel of Fig. 4. While both arcs are similarly bright in H, only “A” is bright in [O III]. This argues against shock-excitation, but is consistent with photo-ionization from BZ Cam, since “B” is at a much larger distance from BZ Cam.
We have estimated the total nebular flux in [O III] to be 4.810-13 erg/cm2/s (after a 16% extinction correction when using =0.05 from Verbunt 1987). At a distance of 830 pc (Ringwald & Naylor 1998) this corresponds to erg/s.
| Spectral Line | Relative Flux Range in | predicted | ||
|---|---|---|---|---|
| app1 | app2 | app3 | ||
| H | 0.29 | 0.37 | 0.55 | 0.28-0.37 |
| [O III] | – | 0.54 | 1.08 | 0.12-2.13 |
| [O III] | – | 1.53 | 3.01 | 0.25-6.15 |
| HNII | 1.0 | 1.0 | 1.0 | 1.0 |
| NII | 0.46 | 0.37 | 0.55 | 0.43-2.5 |
| SII6717+6731 | 0.47 | 0.35 | 0.29 | 0.26-0.51 |
We have earlier speculated that based on the behaviour of the SSB RX J0513.9–6951 and the VY Scl star V751 Cyg possibly also other VY Scl stars could be emitters of supersoft X-ray emission during the optical low-state (Greiner et al. 1999). In the case of BZ Cam, the similarity in the wind properties with V Sge adds even more support to this conjecture. We will argue in the following that by assuming supersoft X-ray emission during the optical low-states we can explain the hitherto puzzling properties of BZ Cam’s nebula.
We first note that all measured nebular emission line ratios ([OIII], [NII], [SII] vs. H) of the nebulae surrounding BZ Cam (our own, Tab. 5, as well as those of Hollis et al. 1992) are in agreement with predictions for supersoft X-ray source nebulae (Rappaport et al. 1994). Second, models of such ionization nebulae (Rappaport et al. 1994) show that about 2–8% of the total ionizing flux is re-radiated by [O III]. These models have been calculated for luminosities of 10 erg/s and densities of 1–12 cm-3. In the case of BZ Cam, the ionizing luminosity will potentially be smaller (see below), and the density substantially higher: Krautter et al. (1987) estimates electron densities of 100–250 cm-3 under the assumption of an electron temperature of 10000 K. This implies that a model more appropriate for BZ Cam could be expected to re-emit substantially less than 2% of its X-ray flux in [O III].
To make this expectation somewhat more quantitative, we used the XSTAR 2.0 code (Kallman 2000) as distributed in the HEAsoft package, and computed the emission line luminosities over a grid of the following input parameters: (i) hydrogen density = 35 and 100 cm-3; (ii) temperature of the central, ionizing source = 15 and 25 eV. The following parameters were adopted and not varied: luminosity of the central source = 1036 erg/s; outer radius (in [O III]) of the nebula = 0.6 pc. We find that the luminosity of the [O III] 5007 line is in the range of 0.1-2% of the X-ray luminosity. Thus, based on our measured [O III] flux, the mean (over the last 10000 yrs) ionizing (X-ray) luminosity would be L 21033–41034 erg/s.
Only 2 optical low-states of BZ Cam are known over the last 110 years, separated by 71 yrs. As mentioned in the introduction, the duration of the 1999/200 optical low state is difficult to determine, but is shorter than 280 days. The duration of the 1928 low-state was less than about 100 days. Assuming 180 days as a mean low-state duration, results in a duty cycle of about 1/150. Thus, if supersoft X-ray emission occurs only during the optical low-states (as e.g. in RX J0513.9–6951), then we can deduce an ionizing luminosity (for [O III]) during the optical low-state of L 31035–61036 erg/s. Such an X-ray luminosity is very similar to that observed from the VY Scl star V751 Cyg (Greiner et al. 1999) or V Sge (Greiner & Teeseling 1998) during their optical low-states. Note that [O III] is only ionized if the effective temperature of the white dwarf is hot enough, say 10 eV, which is expected to primarily happen during optical low-states when X-ray emission is on. In contrast, hydrogen requires a lower ionizing potential, and therefore can be expected to be ionized also during the optical high states.
Since the size of the ionization zone is proportional to the ionizing flux (Rappaport et al. 1994), a rough estimate of the expected size of BZ Cam’s nebula can be made by comparison to the canonical SSB CAL 83 and its nebula (Remillard et al. 1995). With our X-ray flux, the expected size of the ionization nebula (in H) of BZ Cam should be a factor 50 smaller than that of CAL 83, i.e. 0.4 pc. Indeed, the size of the BZ Cam nebula in H is 25 5′, corresponding to 0.6 1.2 pc at 830 pc distance. Thus, the East-West extension of the nebula (perpendicular to the proper motion) is in perfect agreement with the prediction for an ionization nebula.
With the knowledge of the proper motion of BZ Cam, the bow-shock-like shape of the nebula as well as the two-component appearance can be explained based on a moving ionizing source, very similar to the theoretical considerations of Chiang & Rappaport (1996). Note that the time scale for illumination/photo-ionization is generally smaller than the time scale for recombination. In addition, the ionization time scale is fairly insensitive to the source luminosity (during the on-state) so that we can use the analogy to the more luminous, canonical 1037-38 erg/s SSBs (Chiang & Rappaport 1996). As a source emits ionizing photons, the ionization front propagates radially outward and decelerates as the ionizing flux attenuates due to both geometric (1/r2) dilution and photoelectric absorption. If a source moves substantially before the ionization front nears its equilibrium radius, the ionization nebula will become elongated, i.e. while ahead of the motion fresh gas is continually ionized, a slowly fading wake of recombining ions is left behind. Using formula (7) of Chiang & Rappaport (1996), and using cm-3 and L, this will happen for BZ Cam at any velocity larger than 50 km/s. With our above derived space velocity of 125 km/s (assuming 830 pc distance) and a homogeneous surrounding interstellar medium one theoretically would expect an axis ratio of about 1.4 (see Fig. 8 in Chiang & Rappaport 1996). Again, this is in surprising agreement with the value for BZ Cam of 1.3 as measured from the H image (right panel of Fig. 4).
As shown earlier (Fig. 4), BZ Cam’s nebula seems to consist of two components. We believe that the above description, i.e. ionization by a moving source, applies to both components. However, the smaller components with the filaments (which are very bright in the line emission) may represent regions of higher density which could be shaped by both the ram pressure of the bow-shock (ahead of BZ Cam’s motion) as well as episodes of transient major ejection events (in the far tail of BZ Cam’s nebula). Both the larger size of low-excitation emission as compared to e.g. [O III] as well as the distance dependence of the emissivity in [O III] argue in favor of photo-ionization also of the small, filamentary component which is just shaped, but not excited by the hydrodynamic shock formed by BZ Cam’s motion.
3 Conclusions
Our conclusions can be summarized as follows:
-
•
We have (1) discovered proper motion of BZ Cam, leading to a space velocity of 125 km/s; (2) measured variable [O III]/H ratios depending on the distance to the ionizing binary; (3) noted that the emission line ratios of BZ Cam’s nebula are in agreement to predictions of ionization by supersoft X-ray emission; (4) measured the [O III] flux which under the assumption of being recombination radiation and the knowledge of the duty cycle of optical low and high states of BZ Cam implies a mean ionizing soft X-ray flux of 31035–61036 erg/s; (5) shown that the transversal size of BZ Cam’s nebula is in agreement to the prediction of ionization by supersoft X-ray emission as measured from the [O III] flux, i.e. the size is compatible with the nebular [O III] flux; (6) explained the North-South extent of the nebula by a moving source, and found that the axis ratio of the nebula implies a velocity which is in agreement with the measured space velocity; (7) argued that only the shape of the small, filamentary component of the nebula could be a ram-pressure formed bow-shock, while the excitation of both nebular components is due to ionization.
This naturally explains the nebular emission line ratios, the shape, size and flux of BZ Cam’s nebula, and avoids the many complications related to a shock-excitation interpretation as proposed by Krautter et al. (1987), and elaborated by Hollis et al. (1992), which among others include (1) the radio emission is thermal, (2) the radio nebula anticorrelates with [OIII], (3) the large [OIII]/H ratio, (4) and the necessity to truncate the recombination zone by e.g. assuming an environment with larger rather than lower density. -
•
The deduced mean X-ray ionizing flux indeed suggests that BZ Cam is a transient supersoft source, presumably during optical low states. This supports our earlier conjecture that the whole class of VY Scl stars, or at least many of them, could be transient supersoft sources (Greiner et al. 1999). The small He II emission line strengths in BZ Cam (and similarly in V751 Cyg) can be understood if VY Scl stars are the low-mass extension of the canonical SSB with concordantly lower effective temperatures and hence less photons which are capable of ionizing He II. Like other VY Scl stars, BZ Cam is a known, hard X-ray source during optical high state (van Teeseling & Verbunt 1994, Greiner 1998), noticable similar to V Sge and V751 Cyg. The origin of this hard X-ray emission is presently not clear.
-
•
The P Cyg profiles of emission lines (wind with few thousand km/s) are absent during the optical low-state. At present, it is not clear how this wind is related to the phase of conjectured supersoft X-ray emission. Note, however that for orbital periods shorter than 4–5 hrs, as is the case for BZ Cam, the canonical interpretation of SSBs with thermal timescale mass transfer from a companion more massive than the white dwarf is not applicable. Instead, large mass overflow is possible in wind driven systems (van Teeseling & King 1998). BZ Cam may be the first system where we observe such a wind.
-
•
The ultimate proof of our scenario is simple: detect luminous, supersoft X-ray emission during the next optical low state of BZ Cam.
Acknowledgements.
Much of the optical data presented in Fig. 1 were taken from the VSNET which we kindly acknowledge. This research has made use of the SIMBAD database and the VizieR Catalogue Service, Strasbourg, of the Digitized Sky Survey data produced at the Space Telescope Science Institute, Baltimore and of the ESO Skycat Tool, version 2.1.1. RDS gratefully acknowledges financial support from the Deutsches Zentrum für Luft- und Raumfahrt (DLR) (Förderkennzeichen 50 OI 0001). We thank the referee, K. Mukai, for constructive comments.References
- (1) Chiang E., Rappaport S., 1996, ApJ 469, 255
- (2) Ellis G.L., Grayson E.T., Bond H.E., 1984, PASP 96, 283
- (3) Garnavich P., Szkody P., 1988, PASP 100, 1522
- (4) Greiner J., 1998, A&A 336, 626
- (5) Greiner J., van Teeseling A., 1998, A&A 339, L21
- (6) Greiner J., Tovmassian G.H., Di Stefano R., Prestwich A., Gonzalez-Riestra R., Szentasko L., Chavarria C., 1999, A&A 343, 183
- (7) Greiner J., 2000, New Astr. 5, 137
- (8) Hollis J.M., Oliversen R.J., Wagner R.M., Feibelman W.A., 1992, ApJ 393, 217
- (9) Kallman T., 2000, User’s Guide, http://heasarc.gsfc.nasa.gov/lheasoft/xstar/docs/html/xstarmanual.html
- (10) Kislyuk V., Yatsenko A., Ivanov G., Pakuliak L., Sergeeva T., 1999, The FON Astrographic Catalogue, Version 1.0, Main Astronomical Observatory of National Academy of Science of Ukraine
- (11) Krautter J., Klaas U., Radons G., 1987, A&A 181, 373
- (12) Lu W., Hutchings J.B., 1985, PASP 97, 990
- (13) Mateo M., Schechter P., 1989, 1st ESO/ST-ECF Data Analysis Workshop, eds. Grosbol P.J., Murtagh F. & Warmels R.H., p. 69
- (14) Pakull M.W., Motch C., 1989, in Extranuclear Activity in Galaxies, ed. E.J.A. Meurs, R.A.E. Fosbury, Garching, ESO, p. 285
- (15) Patterson J., Patino R., Thorstensen J.R., Harvey D., Skillman D.R., Ringwald F.A., 1996, AJ 111, 2422
- (16) Rappaport S., Chiang E., Kallman T., Malina R., 1994, ApJ 431, 237
- (17) Remillard R.A., Rappaport S., Macri L.M., 1995, ApJ 439, 646
- (18) Ringwald F.A., Naylor T., 1998, AJ 115, 286
- (19) Schaeidt S., Hasinger G., Trümper J., 1993, A&A 270, L9
- (20) Southwell K.A., Livio M., Charles P.A., O’Donoghue D., Sutherland W.J., 1996, ApJ 470, 1065
- (21) Urban S.E., Corbin T.E., Wycoff G.L., 1997, The AC2000: the Astrographic Catalogue on the Hipparcos System, US Naval Observatory
- (22) Urban S.E., Corbin T.E., Wycoff G.L. et al., 1998, The AC 2000: The Astrographic Catalogue on the System Defined by the HIPPARCOS Catalogue, AJ 115, 1212
- (23) van den Heuvel E.P.J., Bhattacharya D., Nomoto K., Rappaport S.A., 1992, A&A 262, 97
- (24) van Teeseling A., Verbunt F., 1994, A&A 292, 519
- (25) van Teeseling A., King A.R., 1998, A&A 338, 957
- (26) Verbunt F., 1987, A&AS 71, 339
- Zickgraf etal. (1997) Zickgraf F.-J., Thiering I., Krautter J., Appenzeller I., Kneer R., Voges W.H., Ziegler B., Chavarria C., Serrano A., Mujica R., Pakull M., Heidt J., 1997, A&A Suppl. 123, 103