AMS, a particle spectrometer in space 111Talk given at the XXIV Symposium on Nuclear Physics, January 3-6, 2001, Taxco, Mexico.
M. Buénerd
Institut des Sciences Nucléaires, IN2P3/CNRS, 53 av. des Martyrs, 38026 Grenoble cedex, France
for the AMS collaboration
Abstract: The results of the precursor flight of the AMS experiment are reviewed, the interpretation of the measured proton flux reported, and the prospects for the forthcoming main phase on the International Space Station outlined.
1 Introduction
Accurate measurements of particle fluxes close to earth have been performed recently by the AMS experiment, bringing a body of excellent new data on the particle populations in the low altitude terrestrial environment. These results should rejuvenate the long standing interest of a broad community of scientists for the interactions between the cosmic ray (CR) flux and the atmosphere and for the dynamics of particles in the earth neighborhood. They certainly open new prospects for accurate studies of these phenomena to investigate the interaction mechanisms generating the observed populations.
The AMS experiment took its first data during a precursor flight on june 2-12, 1998, on the Space Shuttle DISCOVERY. The flight was primitively intended as a qualification test for the spectrometer instrumentation. The orbit altitude was close to 370 km. During 100 Hours of counting, about 108 events were recorded providing new results of high quality on the particle distributions at the altitude of the detector. Some of these results were rather unexpected. They illustrate the discovery potential of the experiment in its future steps.
This contribution is devoted to a general presentation of the project, of the results obtained during this first experimental test and of their interpretation, and of the goals and plans of the forthcoming phase II of the experimental program. The first part will deal with a description of the measurements performed and questions raised on the dynamics of the detected particles in the earth environment, by the results obtained. The second part will describe a phenomenological approach based on a simulation to account for the observed distributions. The third and last part will consist of a description of the phase II AMS spectrometer which will begin on the International Space Station as of next october 2003, which will be very different from the version flown on the shuttle, and of its physics program.
2 The AMS01 precursor flight
The spectrometer operation during the flight has been very successful with only a few instrumental defects, having no significant consequence on the quality of the measurements achieved.
2.1 The spectrometer
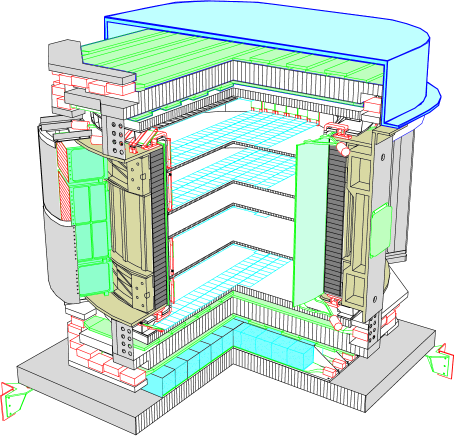
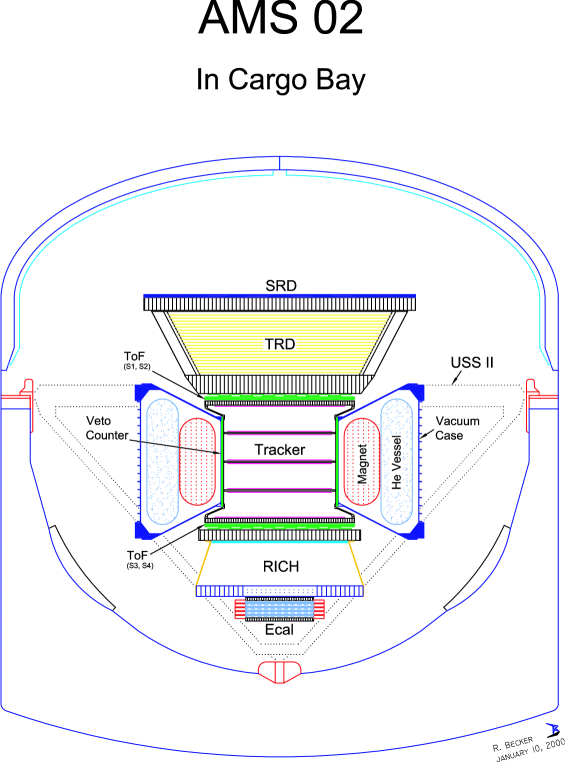
Figure 1 shows a cut view in perspective of the spectrometer which was flown on the shuttle. The apparatus included a cylindrical permanent magnet generating a 0.15 Tesla dipole field perpendicular to the axis of the cylinder inside its volume [1]. The inner volume was mapped with a tracker consisting of 6 planes of silicon microstrips partially equipped at this stage, allowing the reconstruction of particle trajectories [3] . The tracker planes also provided dE/dX measurements of the particles. Above and below the magnet, two double planes of scintillator hodoscopes with perpendicular orientations of their paddles, provided both a measurement of the particle time of flight (TOF) and of their specific energy loss (dE/dX). The paddle location and the position sensitivity inside the paddles also provided a complementary determination of the particle hit coordinates, useful for background rejection. A skirt of scintillators around the tracker was used to veto on particles outside the fiducial angular acceptance of the counter. At the bottom of the device a threshold Cherenkov counter equipped with n=1.035 aerogel material allowed and /e- discrimination below the threshold around 4 GeV/c particles [4].
2.2 Results
Some of the results have already been published [5, 7, 8, 9, 11]. The measured data are still under analysis however, and the physics issues addressed by the experiment are being actively investigated. Some of the latters are discussed on in the following.
2.2.1 Search for antimatter
The first claimed objective of the experiment is the search for primordial antimatter in
space. It was then very important to investigate the capability of the spectrometer to
identify antiparticles with Z2, and to identify and reject background events.
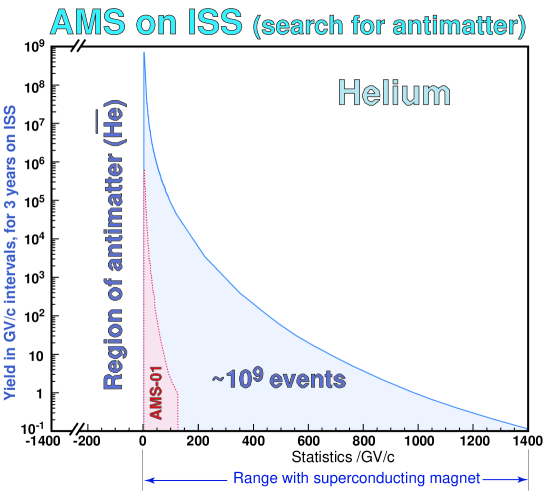
Antihelium [5] -

Figure 2 shows the spectral distribution of Z=2 particles as a function of their rigidity, i.e., momentum/charge, the sign of the charge being measured by the sign of the trajectory curvature in the tracker. Positive rigidities correspond to He particles, whereas antiHeliums are expected on the negative side. A few fake antiheliums due to soft interactions in the detector, were rejected by means of appropriate cuts on the energy deposit in the tracker planes.
Finally the experiment has allowed to set a new lower limit on the /
fraction in cosmic rays, of 1.1 10-6. See [6] for recent results from the BESS
experiment.
Antimatter nuclei Z2 - The particle identification capabilities of the spectrometer have been used to search also for antimatter nuclei with Z2. This search has been negative so far. The limit obtained will be reported in a future publication.
2.2.2 Protons [7, 8]
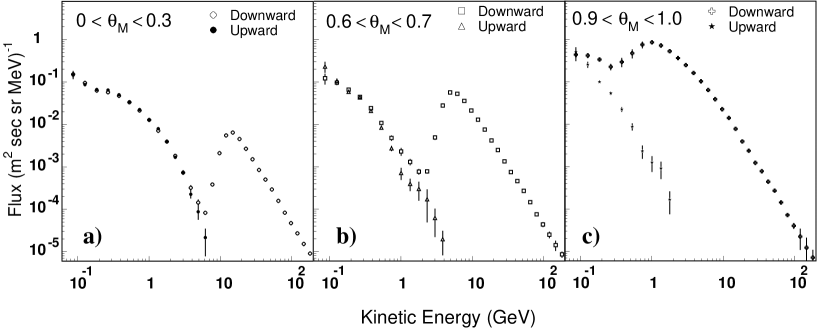
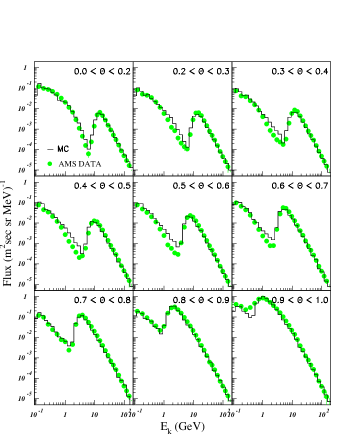
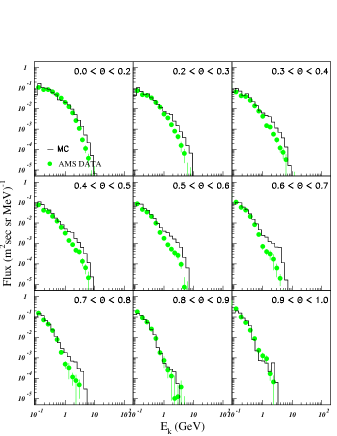
The CR proton distribution was already very well known from previous experiments before the AMS flight. The measurements were intended to be used for checking and calibrating the experiments, no new result being expected. Figure 3 show the kinetic energy distributions of incoming particles (towards earth) measured by AMS in bins of latitude. The spectra show some expected features like the power law decrease with energy. The geomagnetic cutoff (GC) due to the sweeping away of particles by the earth magnetic field below a critical momentum, is clearly observed in the spectra, decreasing from about 15 GeV around the equator down to zero in the polar region. The spectrum at high latitudes is in good agreement with previous measurements. Although no significant flux was expected below GC, a strong rise of the spectra at low energy is observed at all low latitudes with a strong enhancement in the equatorial region. The Albedo (outgoing particles) spectra at the same latitude do not show as expected the high energy features due to the incoming CR flux, but they display one single component peaked at low energy and overlapping almost perfectly (to within 1%) with the low E component of the incoming flux. These features indicate that we are dealing with a population of trapped particles circling around earth magnetic field lines, exactly as in the Van Allen belts but at much higher energy and much closer to earth. This will be confirmed by the analysis reported below.
2.2.3 Leptons [9]
The flux of leptons has been measured up to about 100 GeV for electrons. It was limited to about 3 GeV for positrons by the discrimination range set by the Cherenkov counter threshold for protons.
Electrons The electron spectra show quite similar features as the proton spectra, with the low energy component of the downgoing flux and the upgoing flux almost perfectly overlapping in the equatorial region. In addition these components of the lepton flux have exactly the same shape to within statistical errors, as for protons, indicating that the particles are likely involved in the same dynamical process.
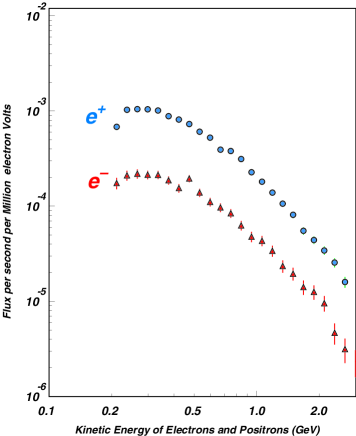
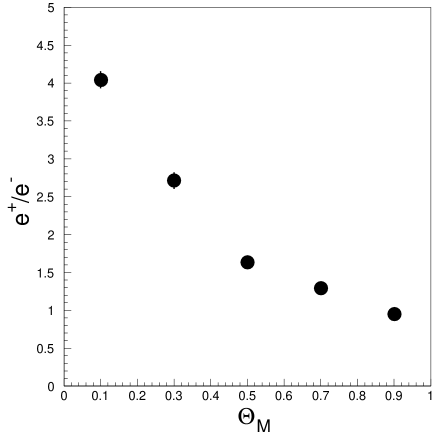
Positrons The positron spectra are similar to the electron’s over the range investigated. The surprising feature is that the positron to electron flux ratio is about 4 in the equator region, while in the cosmic flux it is about 0.1, and about one in the atmosphere. The origin of this feature is an open question which is being addressed by the groups of the collaboration.
Figure 4 shows the distributions of electrons and positrons over the positron ID range in the equatorial region (left) and the distribution of the e+/e- ratio in latitude.
2.2.4 Ions
Deuterium [10] - The flux of deuterium has been measured and some preliminary results are available.
Helium [11] -
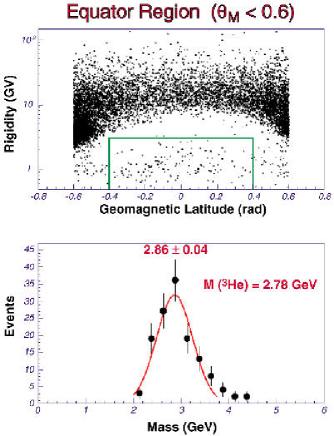
The measured flux of Helium is in agreement with previous measurements and doesn’t show a strong rise of flux below GC as the proton flux does. However a small flux of 3He is found below GC, which originates probably at least partly from the fragmentation of cosmic 4He (figure 5. A consistent picture of these population based on known nuclear reaction mechanisms is being invetsigated to account for these populations of light nuclei [12].
Z2 Nuclei - Some significant samples of light ions with 2Z10 have been measured during this run. They are still being analyzed.
3 Origin of the measured proton flux [13]
3.1 Simulation program
The inclusive spectrum of protons at the altitude of AMS (390-400km) has been calculated by means of a computer simulation program built to this purpose. CR particles are generated with their natural abundance and momentum distributions. They are propagated inside the earth magnetic field. Particles are allowed to interact with atmospheric nuclei and produce secondary protons with cross sections and multiplicities as discussed below. Each secondary proton is then propagated and allowed to collide as in the previous step. A reaction cascade can thus develop through the atmosphere. The reaction products are counted when they cross the virtual sphere at the altitude of the AMS spectrometer, upward and downward. Particles undergo energy loss by ionisation before and after the interaction. Multiple scattering effects have not been included at this stage. Each event is propagated until the particle disappears by either colliding with a nucleus, or being stopped in the atmosphere, or escaping to outer space beyond twice the production altitude. Note that particles are counted each time they cross the sphere of detection altitude. The contributions of trapped particles are thus weighted statistically with their numbers of crossings, which increases their contribution to the final spectrum.
The secondary nucleon spectrum generated has to cover two orders of magnitudes in kinetic energy, between about 100 MeV and 10 GeV. The main component of proton production cross section was obtained by means of analytical relations fitted to 14.6 GeV data. The scaling properties of the cross section have been checked with the FRITIOF/PYTHIA (Lünd) event generator. Since this generator is not expected to account for the very low energy and backward proton emission (target-like to negative rapidities), this latter component was incorporated using a parametrization. The respective contributions to the total multiplicity-weighted proton production cross-section, were 352 mb for the QE component and 88 mb for the DI components. Cross sections on atmospheric nuclei were renormalized from the original data or parametrizations obtained on different nuclei, using ratios of geometrical cross sections.
3.2 Results
Many features of the dynamics of particles in the earth magnetic field appear in the simulation results. Some of them are discussed in the published paper. Others will be reported later. Figure 6 shows the experimental kinetic energy distributions of downward (left) and upward (right) protons measured for some bins of latitude, compared to the results of the simulation. No free parameter was used for normalization to the data: The calculated results are entirely determined by the physics input to the calculation. It is seen that the agreement between the data and the simulation result is remarkably good, at all latitudes and for both the inward and outward flux. In particular, the cutoff region is particularly well reproduced, which indicates that the processing of the particle dynamics and kinematics is good. The shaded histograms in the figure correspond to secondary particles in the simulation. The fraction of events originating from the DI component of the proton production cross section described previously, vary from about 10% in the equatorial region up to 25% in the polar region, with a momentum distribution peaking at low kinetic energy and distributed below 500 MeV.
It can be concluded from this result that the proton flux measured by AMS can be accounted for to a good accuracy by the single interaction of the incoming CR flux with the atmosphere.
3.3 Future prospects
This successful result opens a world of new prospects on the phenomenology of particles in the earth environment. Beside the ongoing investigations of the other AMS results described above, some other issues of general or particular interest are being addressed or will be addressed soon, like the study of the atmospheric neutrino flux and the secondary antiproton populations close to earth. The same type of approach can be used also for particle propagation in the galactic interstellar medium and the study of the various astrophysical issues associated to this propagation.
4 AMS02, a particle observatory in space
The second phase of the AMS experiment will begin on october 2003 with the launch of the spectrometer and its installation on the International Space station (ISS) for a 3 to 5 years campaign of measurements.
4.1 Spectrometer structure
The new spectrometer shown on figure 7, will improve on the AMS01 (figure 1) version by many respects. Its main change consists of the permanent magnet (Bmax=0.15 T) of AMS01 being replaced by a superconducting magnet in AMS02 (Bmax=1 T) which will result in a 6 times better resolution and 6 times larger momentum range, because of this larger magnetic field. In addition, several new detectors will be implemented in AMS02: A transition radiation detector (TRD) will provide lepton identification up to above 300 GeV and an improved tracking accuracy. A Cherenkov imager (RICH) will allow nuclear isotope identification up to about 13 GeV/c for mass around carbon [15]. An electromagnetic calorimeter (ECAL) will provide the energy measurement of electromagnetic particles , leptons, and their discrimination from hadrons up to the TeV range. The synchrotron radiation detector (SRD) would provide e+/e- identification/discrimination at very high energies [16].
4.2 Physics program
The physics program to be covered with the new instrument is wide, with a high discovery potential and a significant probability of unexpected results and new findings. Basically the spectrometer will be able to accumulate statistics larger by 3 to 4 orders of magnitudes than those measured so far by other embarked experiments, for all the species studied. The range in rigidity will extend from around 300 MV up to 3 TV, depending on the particle species, with a good identification capability for leptons, hadrons, and ions, provided by the spectrometer instrumentation. The TRD counter will provide lepton-hadron (mainly positron-proton) discrimination up to the TRD proton threshold around 300 GeV. The RICH will allow both charge and mass measurements: The charge can be obtained from the photon yield, proportionnal to Z2, for momenta going from threshold up to the upper limit of the counter momentum resolution. The mass measurement is obtained from the ring image processing, over a range limited by the space resolution of the counter as shown in the table (see [15] for details). The final performances and range will depend on the choice of Cherenkov radiators. The electromagnetic calorimeter will allow the energy measurement of electromagnetic particles, leptons and photons, up to the TeV range, and lepton-hadron discrimination from the measured P/E ratio over the same range.
These features will allow a high statistics study of many cosmic ray species including , , , , and the lightest ions He. Heavier light ions will also be studied with mass identification up to A, and elements up to Z depending on the final performances of the instrumentation of the spectrometer (RICH in particular). Unstable ions like 10Be, and 26Al are of particular interest since they provide a measurement of the time of confinement of charged particles in the galaxy (galactic chronometers) [19]. The corresponding antimatter nuclei will be searched with equivalent instrumental performances in identification and kinematic range. The metrological perspectives are summarized in table 1.
| Particles | Pmin | Pmax | Comments |
| e- | 0.3 | 3000 | Upper limit set by rigidity resolution |
| e+ | 0.3 | 300 | Upper limit set by TRD |
| proton | 0.3 | 3000 | Upper limit set by rigidity resolution |
| Charge identification of elements | |||
| Ions Z¡20 | 0.3 | 1500 ? | Depending on RICH performances |
| Mass identification of isotopes | |||
| Ions A¡4 | 1 to 4 | 20 | Depending on RICH performances |
| Ions 4¡A¡20 | 1 to 4 | 12 | |
| Antimatter | |||
| 0.3 | 3000 | Depending on discrimination | |
| 0.3 | 1500 | , | |
These capabilities will allow to address with an unmatched sensitivity the main scientific
objectives of the program:
1) The search for antimatter in space [17]: The experimental signature for the
detection of an antinucleus basically requires a determination of its charge in module and
sign, the key point being the sign of the charge provided by the radius of curvature of the
trajectory in the tracker, its accuracy and contamination by various backgrounds. The
results discussed previously have shown that the background level is under control (see
details in [5]). It will be improved with the updated the tracker equipment in
number of planes and readout electronics.
2) The search for dark matter in space through the signature of neutralino annihilations.
The latter are expected to generate kinematic structures in the spectra of their annihilation
products [18]. Such structures will be searched for in and e+ spectra.
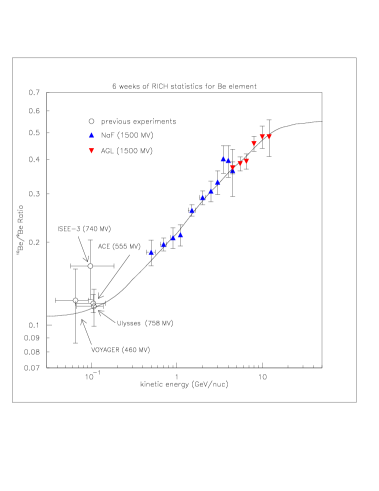
3) In addition, the study of the various ions within the spectrometer (RICH) range of
identification, will be achieved, in particular for the 10Be isotope. This is
illustrated on figure 9 with the result of a simulation incorporating the
ID resolution of the spectrometer provide by the RICH and a theoretical 10Be
distribution in momentum. It is seen that the measured sample for 6 weeks of counting time
on the ISS would provide highly accurate data over a range totally unexplored so far
by previous experiments. The study of this sample will provide an estimate of the accuracy
on the propagation parameters to be expected [19].
See ref [20] for a study of a possible high energy gamma ray astronomy program with
AMS.
5 SUMMARY and CONCLUSION
In summary, it has been shown that the first engineering flight of the AMS experiment has been very successful, both instrumentally and scientifically. This first step has provided a significant number of new unexpected physics results on the particle populations close to Earth. Although no new physics has emerged so far from these data, they are new and important and expected to provide some significant improvements in our understanding of the particle flux in the environment close to earth at the completion of the study. These result obtained in a region extensively explored by previous balloon or satellite experiments, illustrate the discovery potential of the spectrometer due to its instrumental characteristics: large geometrical acceptance, large momentum range and dynamics and particle identification capability, and to the long duration of the measurement campaign scheduled for the main phase of the experiment on the ISS, where close to 3 orders magnitude more statistics than in the first flight will be collected in much better instrumental conditions.
References
- [1] S. Ahlen et al., Nucl. Inst. and Meth. in Phys. A350(1994)351
- [2] D. Alvisi et al., Nucl. Inst. and Meth. in Phys. A437(1999)212
- [3] B. Alpat et al., Nucl. Inst. and Meth. in Phys. A446(2000)522; ibid, Nucl. Inst. and Meth. in Phys. A439(2000)53
- [4] D. Barancourt et al., Nucl. Inst. and Meth. in Phys., in press ; preprint astro-ph/0010242
- [5] The AMS collaboration, J.Alcaraz et al., Phys. Lett. B461(1999)387
- [6] M. Nozaki et al., Proc of 26th Int. Cosm. Ray Conf., Salt-Lake city, Aug, 17-25, 1999, vol 3, p 85.
- [7] The AMS collaboration, J.Alcaraz et al., Phys. Lett., B472(2000)215
- [8] The AMS collaboration, J.Alcaraz et al., Phys. Lett. B490(2000)27
- [9] The AMS collaboration, J.Alcaraz et al., Phys. Lett. B484(2000)10
- [10] G. Lamanna, AMS note 2000-07-02
- [11] The AMS collaboration, J.Alcaraz et al., Phys. Lett. B494(2000)193
- [12] L. Derome and M. Bu nerd, in preparation.
- [13] L. Derome et al., Phys. Lett. 489(2000)1; L. Derome and M. Bu nerd, Nucl. Phys. A, in Press.
- [14] see http://ams.cern.ch/AMS/ams_homepage.html
- [15] M. Buénerd and Z. Ren, Nucl. Inst. and Meth. in Phys. A454(2000)476; T. Thuillier et al., Nucl. Inst. and Meth. in Phys. A442(2000)74; T. Thuillier, PhD thesis, Universit J.Fourier, Grenoble (France), 1999;
- [16] M. Pohl and H. Hofer Nucl. Inst. and Meth. in Phys. A416(1998)59
- [17] See the references in H. Kurki-Suhonio and E. Sihlova Phys. Rev. D62:103508,2000
- [18] E.Diehl et al., Phys.Rev.D52(1995)4223; S. Rudaz and F.W. Stecker, ApJ 325(1988)16; see E.A. Baltz et al, Phys. Rev. D61:023514,2000; and Phys. Rev. D59(1999)023511 for a recent status of the field
- [19] A. Bouchet et al., Nucl. Phys. A, in press.
- [20] R. Battiston et al., Astropart. Phys. 13(2000)51